Qodana
The code quality platform for teams
New Quarter, New Qodana 2025.2 Release Highlights
Following the recent rollout of our new Insights dashboard, Native mode, Self-Hosted Lite version, SSO functionality, and Visual Studio plugin, our Qodana 2025.2 update promises another round of improvements and extensions. Take a look at what we’ve been doing as we focus on providing greater access to code quality and security in your organization, and let us know what you’d like to see on the roadmap.
Native mode is now available for Go and Python linters
We’ve expanded Native mode to three more linters:
qodana-goqodana-pythonqodana-python-community
To learn more about the difference between Native mode and Dockerized execution, how the choice can be important for setting up the right environment, and how Native mode simplifies the use of Qodana throughout the development lifecycle, take a look at this blog post. It details how you don’t need to use Docker images anymore.
Now qodana-cli supports scans like:
```
qodana scan --linter qodana-go --within-docker false
```
Check out the documentation for details on how to specify a virtual environment for analysis, with qodana-python, for example.
Security analysis has a new look with a redesigned Taint Trace Explorer
Version 2025.2 brings enhancements to the Taint Trace Explorer interface in the Security Analysis by Qodana plugin for IntelliJ IDEA. The updates are designed to improve trace readability, make navigation more efficient, and provide more information about traces.
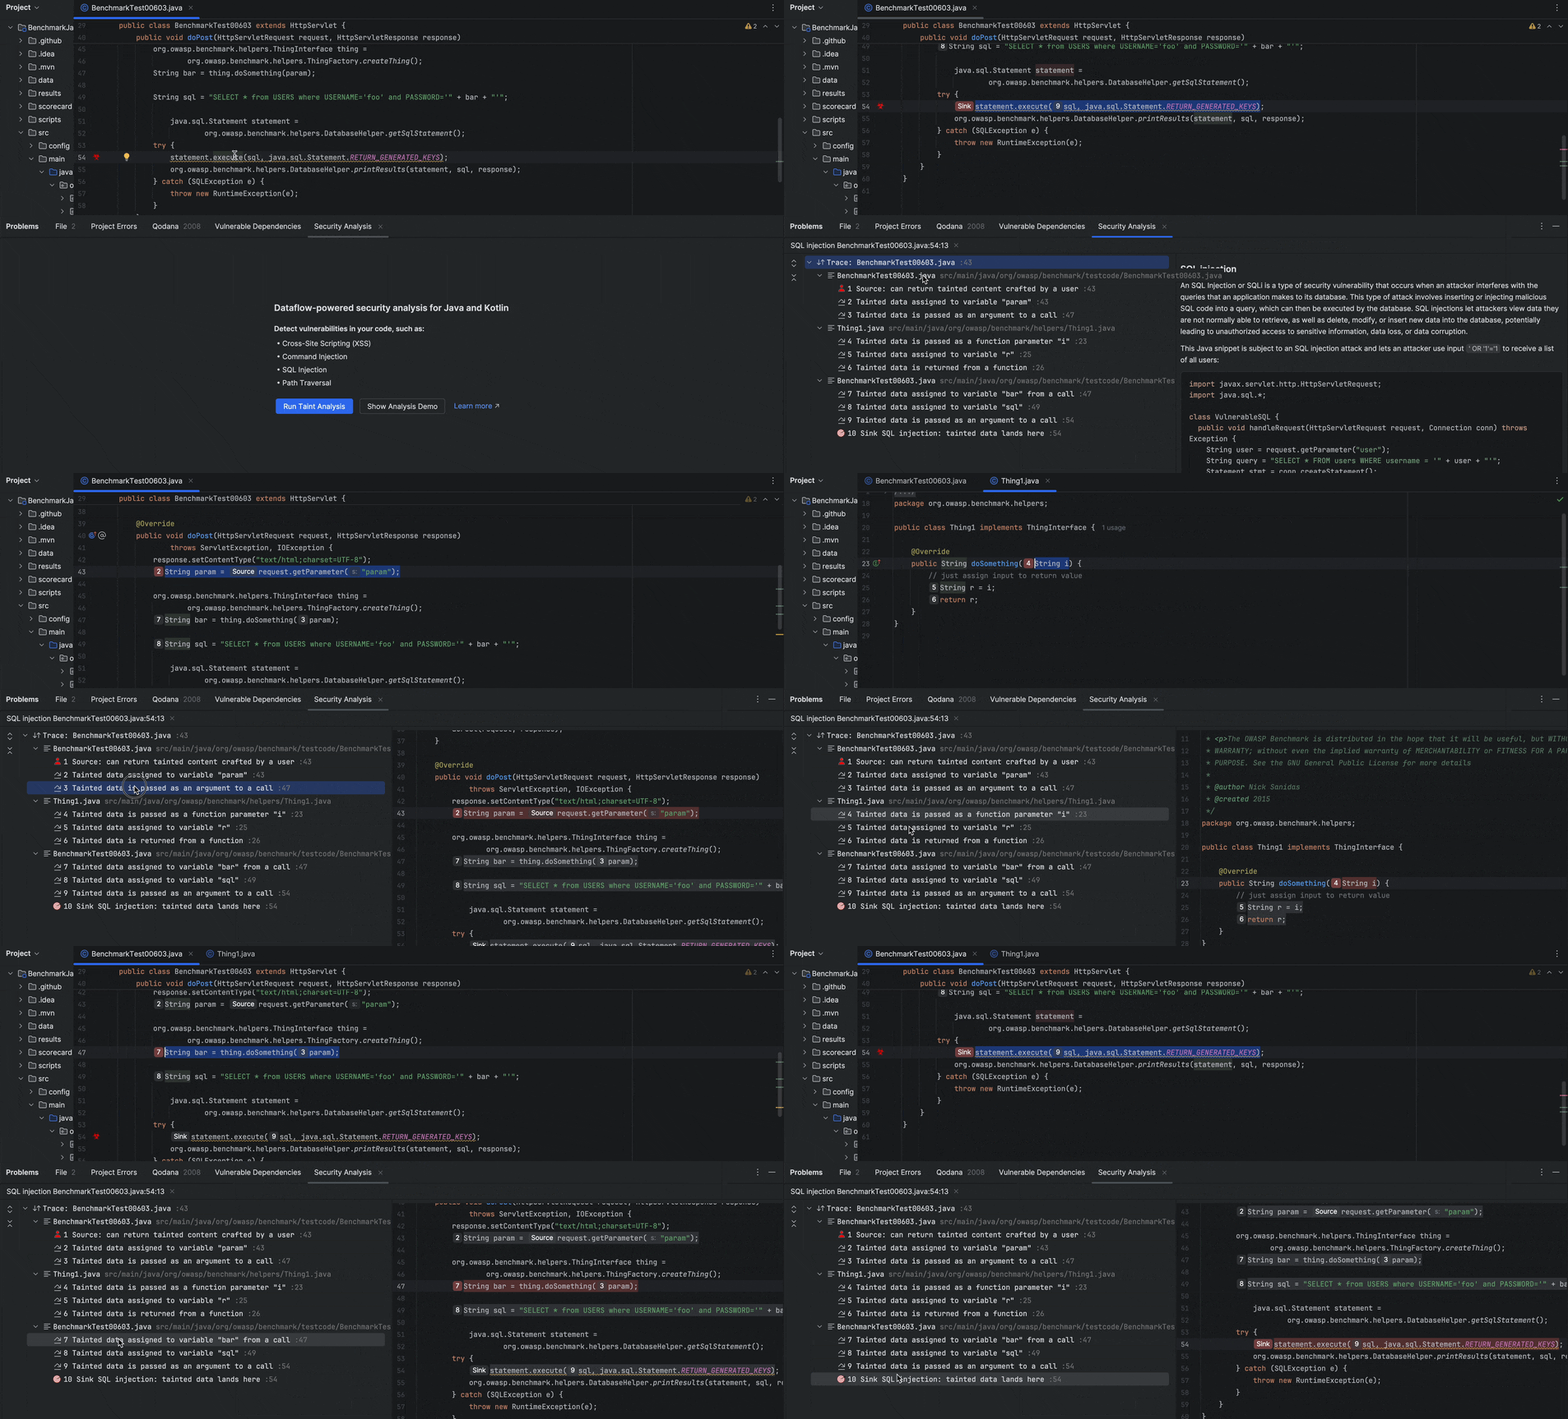
We’ve redesigned the interface to offer you a more structured and informative layout. The updated UI simplifies the navigation of complex, multi-step traces, and a clearer visual hierarchy makes it easier to understand the results of the analysis.
The interface now provides descriptions for trace steps
Each step in a taint trace now includes a contextual description explaining its role in the data propagation chain. The description clarifies the semantics of each transition, like variable assignments, method calls, and the propagation of tainted data through parameters. This simplifies understanding how tainted data moves through the application.
Additionally, taint traces now feature summary-level descriptions that provide quick overviews of the flow from source to sink. These summaries help show the significance of each trace at a glance, making it easier to assess the impact of a vulnerability and prioritize which issues to fix during large-scale reviews.
View highlighted steps in the main editor
Each step of a taint trace is now directly highlighted in the code editor. As you navigate through the trace, the corresponding step in the source code is highlighted. This allows you to easily context switch between trace and code, improving your understanding of the code as you go.
What does this mean for you and your team?
✓ Faster trace analysis through improved UI clarity and contextual insight.
✓ Better trace triaging, with high-level context available up front.
✓ Greater scalability for analyzing applications with complex or overlapping data flows.
✓ Enhanced usability for both application security specialists and developers.
Taint analysis is faster and more accurate
Taint analysis has become much faster thanks to the ability to pre-filter.
A lightweight interprocedural finite distributive subset analysis (IFDS) now runs as a preprocessing step. It checks whether there are any potential paths from sources to sinks within the current scope.
If no paths exist through certain functions, those functions are eliminated from further analysis.
The IFDS algorithm operates in linear time and is field-sensitive, call-sensitive, and flow-sensitive thanks to SSA transformation.
Analysis is also more precise
After filtering, the original, more precise taint analysis runs on the reduced scope, focusing only on potentially relevant paths.
This allows Qodana to analyze codebases of 7 million lines of code in just under half an hour.
IFDS also makes the reported paths linear and unambiguous.
We’ve also increased accuracy by fixing a number of false positives and false negatives. And on top of all that, none of these improvements compromise analysis speed.
OWASP Top 10 coverage for Java and Kotlin has been enhanced

Not long ago, we announced that Qodana would increase its number of OWASP Top 10 checks. This release brings key improvements to Java and Kotlin support, with stronger detection across critical OWASP Top 10 categories. These updates help you dive deeper into your code, catch more issues, and work more reliably with large codebases.
Expanded taint modeling for Java collections: We’ve added support for all standard Java collections, so taint information now flows more accurately through the data structures you use every day.
Coverage for Kotlin collection APIs: With support for Kotlin’s standard collection APIs, you and your team can now surface more issues related to data flow and security in your Kotlin code.
Kotlin string taint propagation: We’ve added tracking for Kotlin string APIs to help you catch injection risks and data exposure problems in string operations.
Kotlin engine stability improvements: We fixed several behind-the-scenes issues to make Kotlin analysis more stable and consistent, especially in bigger projects.
Improved field-sensitive data flow in Java: Taint tracking now follows data through class fields more effectively, giving you better visibility into complex object graphs and helping reduce missed issues.
CMake preset support in qodana-cpp
Qodana for C++ (EAP) now supports CMake presets, giving you greater control over compilers and environments. You can use the new cpp section in qodana.yaml to specify a CMake preset for your project:
version: "1.0"
cpp:
  cmakePreset: my-qodana-preset
What is a CMake preset?
Introduced in version 3.19, CMake presets allow for a structured way of versioning, modifying, and sharing various configuration options you would usually specify on the command line. They are defined in a CMakePresets.json file inside your project, which should be committed to VCS. In the context of Qodana, when we talk about “presets”, we are referring to “configuration presets” – those specified in the eponymous field inside the JSON file.
Each preset allows you to specify options you would usually write in the command line when configuring CMake: target build directory, cache variables, preferred generator, compilers, etc. You can check out the CMake documentation for more information.
How do you use a CMake preset to customize analysis?
First, you need to make some decisions about the environment you want to run your analysis in, for instance:
- Do you want the analysis to run when your project is configured for debugging or release?
- Do you care which compiler is used (GNU Compiler Collection, Clang, cross-compiler, etc.)?
- Do you want to set any CMake -D… variables?
Now, create a CMakePresets.json file in the root of your project and specify this environment. Below is an example with comments added for clarity. Note that comments are not allowed in actual JSON files.
{
  "version": 3,
  "configurePresets": [
    {
      "name": "my-qodana-preset",
      // Specify generator.
      "generator": "Ninja",
      "binaryDir": "build",
      "cacheVariables": {
        // Specify build type.
        "CMAKE_BUILD_TYPE": "Release",
        // Use a specific C and C++ compiler.
        // Check out the `bootstrap` secion in qodana.yaml to install your own compiler!
        "CMAKE_C_COMPILER": "clang-16",
        "CMAKE_CXX_COMPILER": "clang++-16",
        // Set project-specific variables.
        // Equivalent to `cmake ... -DUSE_OPENGL=1`
        "USE_OPENGL": true,
        "BUILD_EXTENSION": false
      }
    }
  ]
}
What is the difference between a CMake preset and a CLion profile?
CLion profiles perform a similar function to CMake presets, but are specific to the CLion IDE.
When working in CLion, the IDE scans your CMake presets and creates an equivalent profile with the same name. Keep in mind that a CLion profile with the same name as a preset will override it. Using CLion profiles for analysis is not explicitly supported.
What if I don’t use a preset? What happens to my current configuration?
If the cmakePreset field is missing from qodana.yaml, Qodana will try its best to analyze the project with the default settings. However, for best results, it’s recommended to use a preset.
CLI parameter updates for smoother setup
In this release, we reorganized the parameters available for configuring linter behavior. We’ve introduced two new parameters (--image and --within-docker), changed the available values for the --linter parameter, and deprecated the –ide parameter.
We’ve also simplified the --linter parameter. So, instead of writing:
qodana scan --linter jetbrains/qodana-jvm:2025.2
you should use:
qodana scan --image qodana-jvm
If the linter should be executed in Native mode, the only difference is that you need to add `--within-docker false` . So instead specifying it the old way:
qodana scan --ide QDJVM
use this instead:
qodana scan --linter qodana-jvm --within-docker false
Here’s another example, this time of a case where the linter should be executed with a specific Qodana Docker image. In this case, you no longer need to use:
qodana scan --linter %some-repo%/qodana-jvm:2025.2
You should instead use the –image parameter, like so:
qodana scan --image %some-repo%/qodana-jvm:2025.2
For more detailed information, read the documentation or take a look at the qodana-cli repo on GitHub.
What to do next
Those are the key updates for this release. If you’re using the latest release tag, you don’t need to do anything to enjoy the benefits of our new Qodana 2025.2 release. Otherwise, please switch from 2025.1 to 2025.2 to update. Users of GitHub Actions, Azure DevOps, and Circle CI can find the latest version of the extension here.
For more information, including detailed setup instructions for each feature, please refer to our official documentation. Click on the button below to speak to our team, and join our community on X for updates between releases.

