JetBrains Research
Research is crucial for progress and innovation, which is why at JetBrains we are passionate about both scientific and market research
Computer Science Learning Curve: Insights from 18k Learners Worldwide

The world of computer science (CS) education is changing rapidly. From AI-powered tools to new modes of online and blended learning, it has never been more dynamic – or more critical. Education research has looked into some aspects of how students learn computer science, but when we ask the big questions about who is learning computer science, how, and why, there are surprisingly few big-picture studies out there.
Our Education Research team with our Strategic Research and Market Intelligence and JetBrains Academy teams addressed this gap by surveying a diverse audience on a wide range of topics. The collaboration combined their strengths: JetBrains Research brought expertise in conducting studies and writing research papers, while SRMI and JetBrains Academy brought experience with large-scale industry surveys. The dataset is available online, and we encourage you to explore it yourself!
Our researchers will present insights from the study this October 23rd at ACM CompEd, a SIGCSE family conference. And in this blog post, we will tell you about the survey and the paper to be presented, including:
- Why this kind of study is important
- How the survey was set up
- What applications the results have in the real-world
- How you can work with the data and collaborate with us
The importance of the big picture in computer science education
While individual studies have examined specific aspects of CS learning, few have captured the global picture at scale. Studies are often limited in terms of sample demographics, for example, in types of education (both formal, like university, and informal, like self-paced courses or bootcamps), participant number or country. This limitation leaves educators and policymakers without the necessary insights into how people worldwide approach CS education today. Especially considering that many people learn online, we need more collaboration and broader studies revealing higher-level trends that might otherwise be missed.
Recognizing this gap, our Education Research, our Strategic Research and Market Intelligence, and JetBrains Academy teams conducted a comprehensive survey of CS learners, representing 18,032 participants across 173 countries (paper, dataset). Our initial goal was to better understand how people learn to program today, in order to make our tools more supportive for learners. While working on the survey, we realized that the dataset has potential for other researchers; this realization led to the paper and making the dataset available on Zenodo.
The study has many advantages over similar work done previously. For one, it explicitly includes self-taught learners, which has been rare in previous studies. On top of that, it includes:
- A wide range of topics and questions
- A diverse set of learners to ensure broad representation
This post will describe the details of the study’s methodology and discuss both its key findings and potential applications.
Our computer science education survey
A primary goal of our study was to survey a broad sample size of CS learners about diverse topics. The results have been – and continue to be – useful here at JetBrains to improve our educational products. And the impact doesn’t have to end within our company or with our products: this dataset is available for anybody to explore!
With our comprehensive survey, we want to provide an example of collaboration between industry and academia. Industry resources can help academic researchers tap into a broader pool of participants or at a larger scale; and by agreeing on open data sharing, the data and results are available to the entire research community. These are just some ways we can work together to learn about CS education and, ultimately, to help CS students.
The rest of this section will describe the methodology behind the dataset, including survey design, data collection, and data processing. The next section will discuss insights that have already been gained from the survey, plus further potential applications.
Data collection
Our Strategic Research and Market Intelligence team prepared the survey and piloted it internally at JetBrains before a wider external release. The survey contained 87 questions (a mix of open and multiple-choice; all can be found here), organized into the following 10 topics:
- Demographics. Basic demographic identifiers: age, gender, geographical location, and language preferences.
- Formal Education. Educational level, institution types, and fields of study.
- Career. Career trajectory, industry experience, professional development, and job-seeking behaviors.
- Learning Topics and Formats. Subject areas studied, self-assessed proficiency, educational platforms, and course preferences.
- Coding Experience. Technology adoption patterns and development practices.
- Development Tools. IDE usage patterns and tool preferences.
- AI Integration. AI tool usage in learning contexts (for the state of things at data collection).
- Learning Challenges. Obstacles, reasons for quitting, and methods to overcome learning difficulties.
- Study Habits. Learning routines, environments, productivity strategies, and device usage.
- Motivation. Drivers for CS education engagement.
With many topics, and many questions, there is both the opportunity to gain a better understanding of CS education and also see relationships between categories that might otherwise be missed.
In addition, our team:
- Localized the survey questions into ten languages, namely:
- English, Chinese, French, German, Japanese, Korean, Brazilian Portuguese, Russian, Spanish, and Turkish
- Recruited participants with:
- Targeted advertisements on social media platforms
- Invitations to a list of people who have already given consent to be contacted by JetBrains for research purposes
- External survey panels to ensure responses from underrepresented regions such as Japan and Ukraine
- Collected the data in the first half of 2024
After collecting the initial data, our team did a sanity check, removing suspicious responses, similar to other large surveys’ methodologies (see Stack Overflow or DevEco). Examples of suspicious responses include low reported age in combination with high experience or unusually quick response times, i.e., less than five seconds per question.
Following the sanity check, the dataset contained 18,032 responses from 173 countries. Note that 14,396 of these are full responses, meaning that these respondents completed all questions in the survey.
Data processing
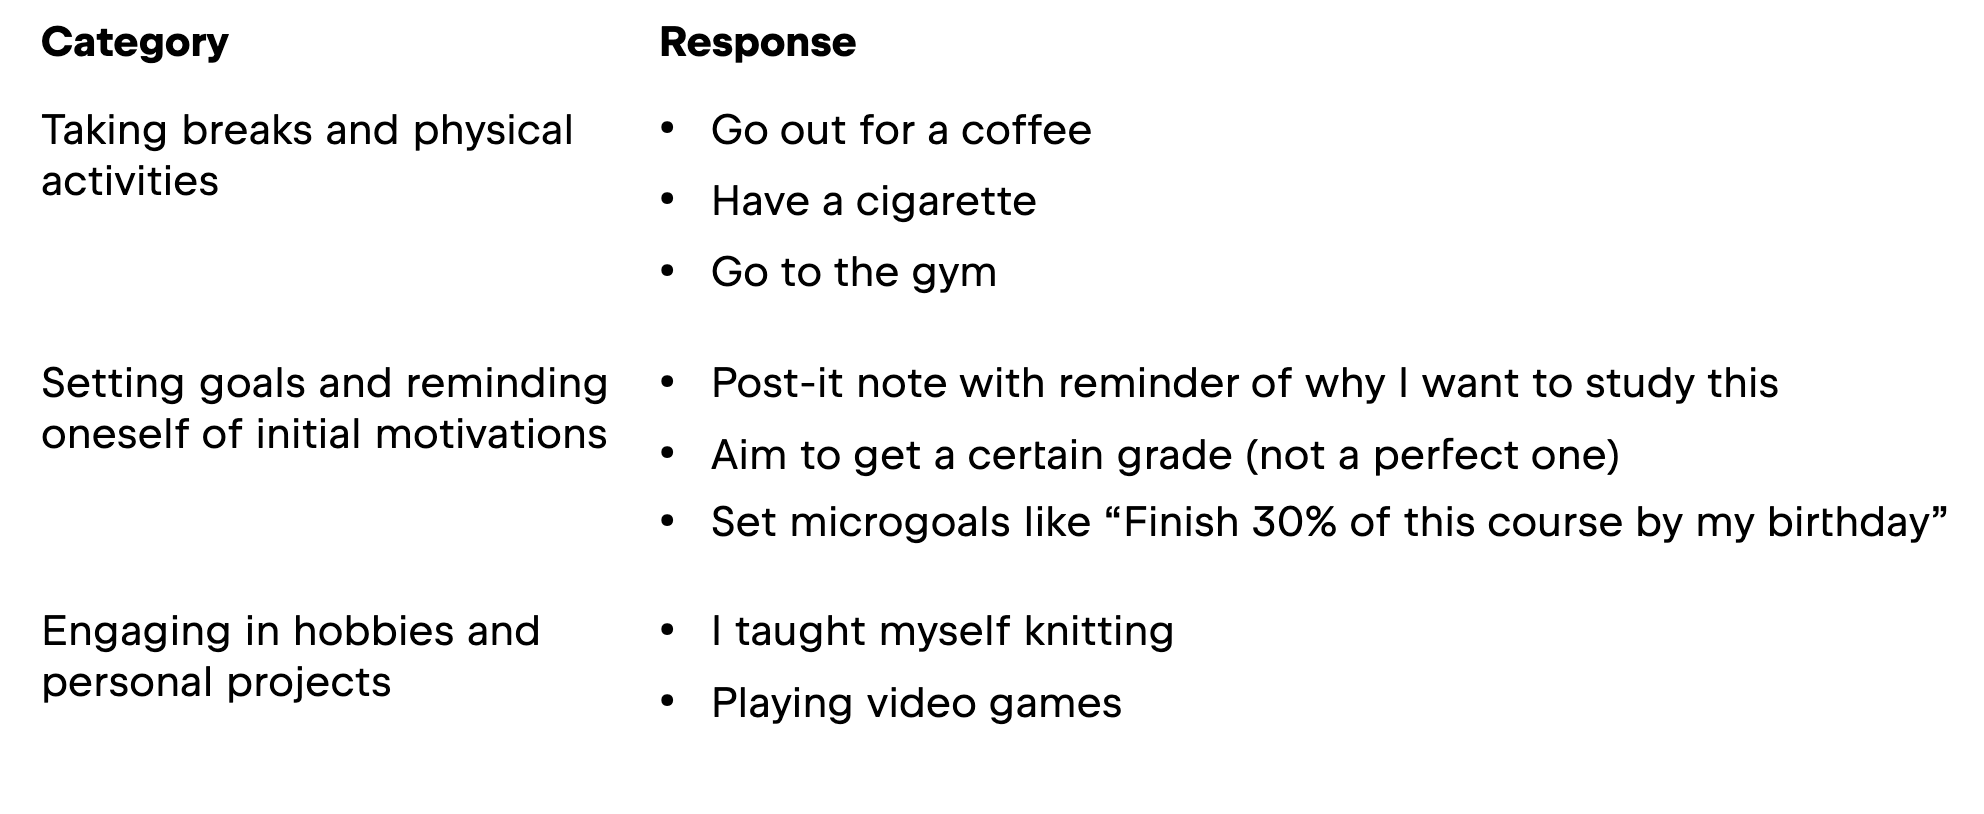
For this survey, data processing comprised two main steps: (i) translating all responses into English and (ii) coding the responses into categories for analysis. The following table contains example responses and their labels for the open-ended question Do you have any methods of overcoming frustration and/or the feeling that you want to give up on your studies?
For both steps, our research team used GPT-4o. While coding the responses into categories, we had to manually review the LLM output. For example, we checked the number of clusters per question, the naming of clusters for each question, and how the responses were distributed across these clusters.This manual review was necessary because the LLM would group some of the inputs into an Other category even though they might actually belong to a category; in some cases, multiple responses marked as Other would form a new category.
In addition to data processing, our researchers were careful to address potential sampling bias (details can be found in the paper). They followed industry standards in weighing the data (see, for example, the detailed methodology for DevEco or the methodology for DeveloperNation’s Pulse Report), assigning a weight to each response so that underrepresented groups would have more influence in the analysis. The main feature of the weighting process was to divide the results into:
- External: collected from social network ads, together with responses from peer referrals
- Internal: collected from JetBrains social networks and the JetBrains email list
One goal of weighting external responses was to elevate responses from underrepresented countries. Based on previous internal research, our team determined what the expected distribution should look like and applied the post-stratification method to it.
For the internal responses, in addition to the country bias, potential biases include a higher proportion of JetBrains product users and a higher amount of experience in software engineering overall. In this case, the weighting technique, a type of calibration, involved using information from the external responses for the country bias, plus a series of calculations.
By applying the weighting methodology to both the internal and external responses, our team reduced potential biases. This ensured the study remained as unbiased as possible across the diverse global sample.
The full dataset, including categorization and data weighting, is available as supplementary material. The supplementary material, in particular the dataset, is intended to be accessible (and useful!) to researchers regardless of their technical background.
Real-world applications
In the paper, our team presented the following example research directions and their corresponding results. We will go into more detail about them in the rest of this section. which might inspire you for your own analysis based on the dataset:
- Learning challenges
- Emerging learning formats, including massive open online courses (MOOCs) and code schools
- In-Integrated developer environment (–IDE) learning practices
These are just a sample of what could be explored. For example, you could look at the table from the previous section and pick out a topic to explore further, like learning motivations. Or, you could look at how AI integrations look today compared to data collection. Or see if there is a relationship between students’ learning routines and frequency of quitting. What would your research idea be?
Learning challenges
First, we will look at what frustrations students identify when studying CS. Previous studies on this topic have looked specifically at why some students drop out of formal CS programs at universities, why some students persevere in the same type of program, and the challenges faced in different learning modes such as massive open online courses (MOOCs) and in-IDE learning. Our dataset builds on this body of work, complementing their results. Some of the relevant survey questions are listed below.
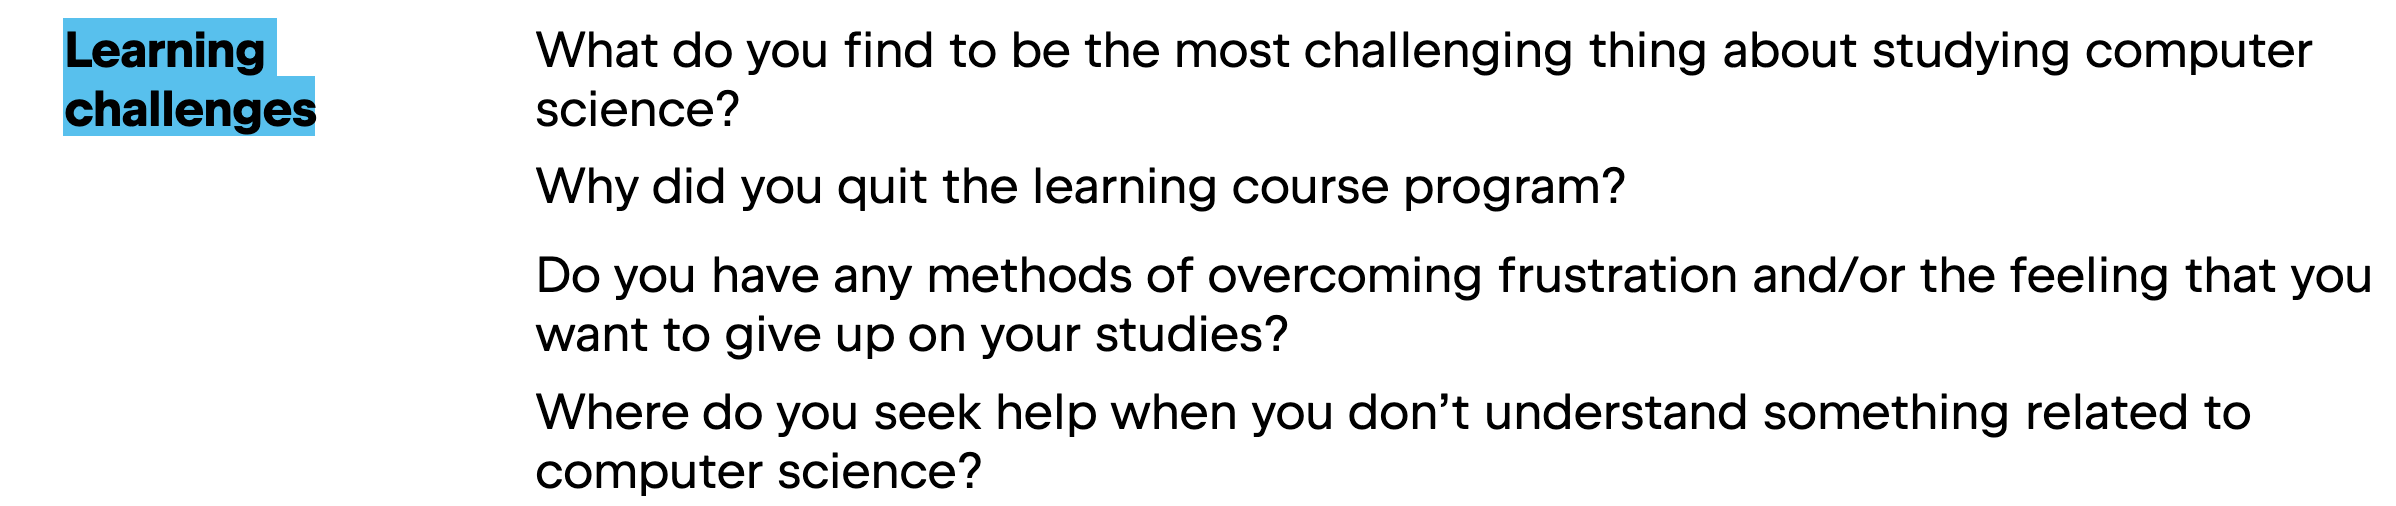
The first two of the above questions were multiple-choice, and only the third one was open-ended. For the multiple-choice questions, participants could pick more than one answer.
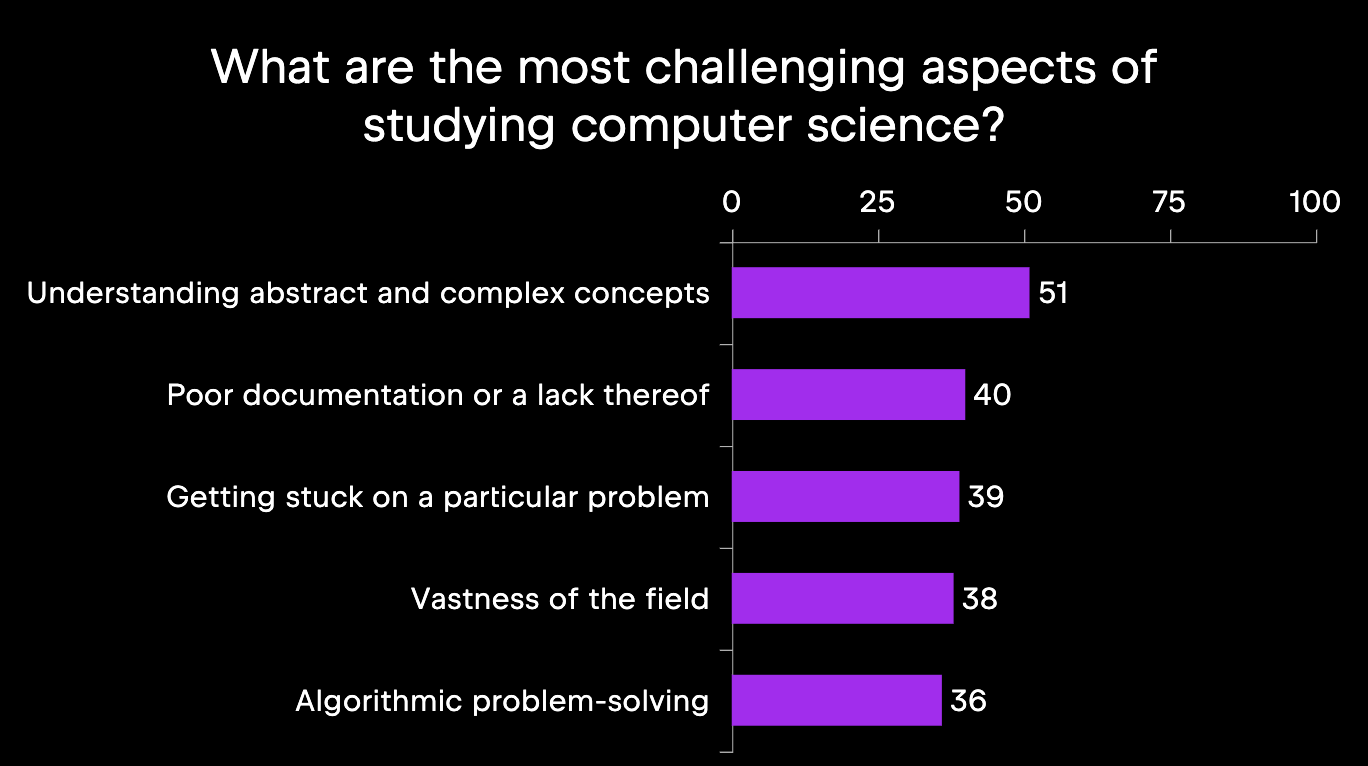
For the first question, the participants selected several challenges, both at the theoretical and practical levels. The top five choices and their percentages are shown in the following infographic.
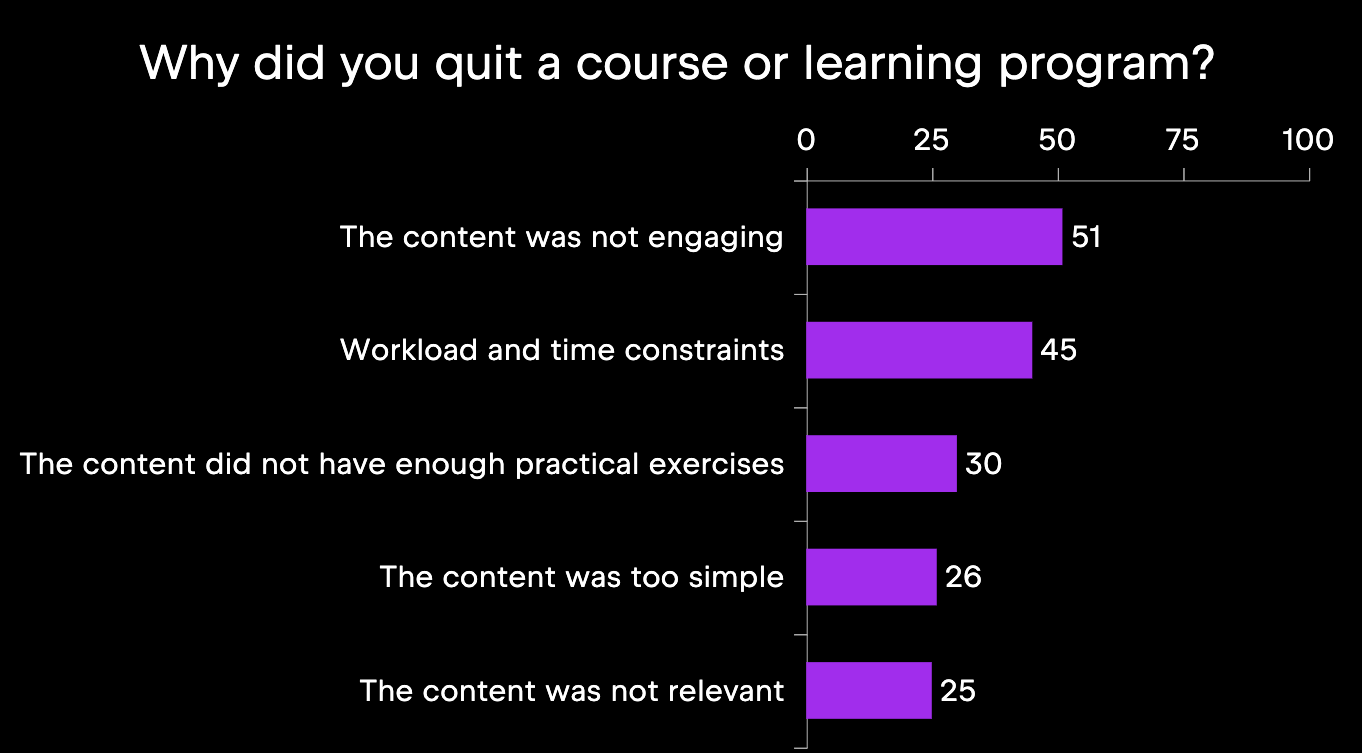
There are some students who find learning CS so challenging that they decide to abandon their studies. The survey participants reported Unengaging content as a top reason for leaving, followed by Heavy workload and time constraints. These and the rest of the top five reasons are depicted below.
Despite the challenges, many CS learners find ways to stay motivated and continue learning. Commonly reported methods of overcoming frustration are listed in the image below. Note that this question was the only open-ended one of the bunch, so the responses were categorized during data processing.
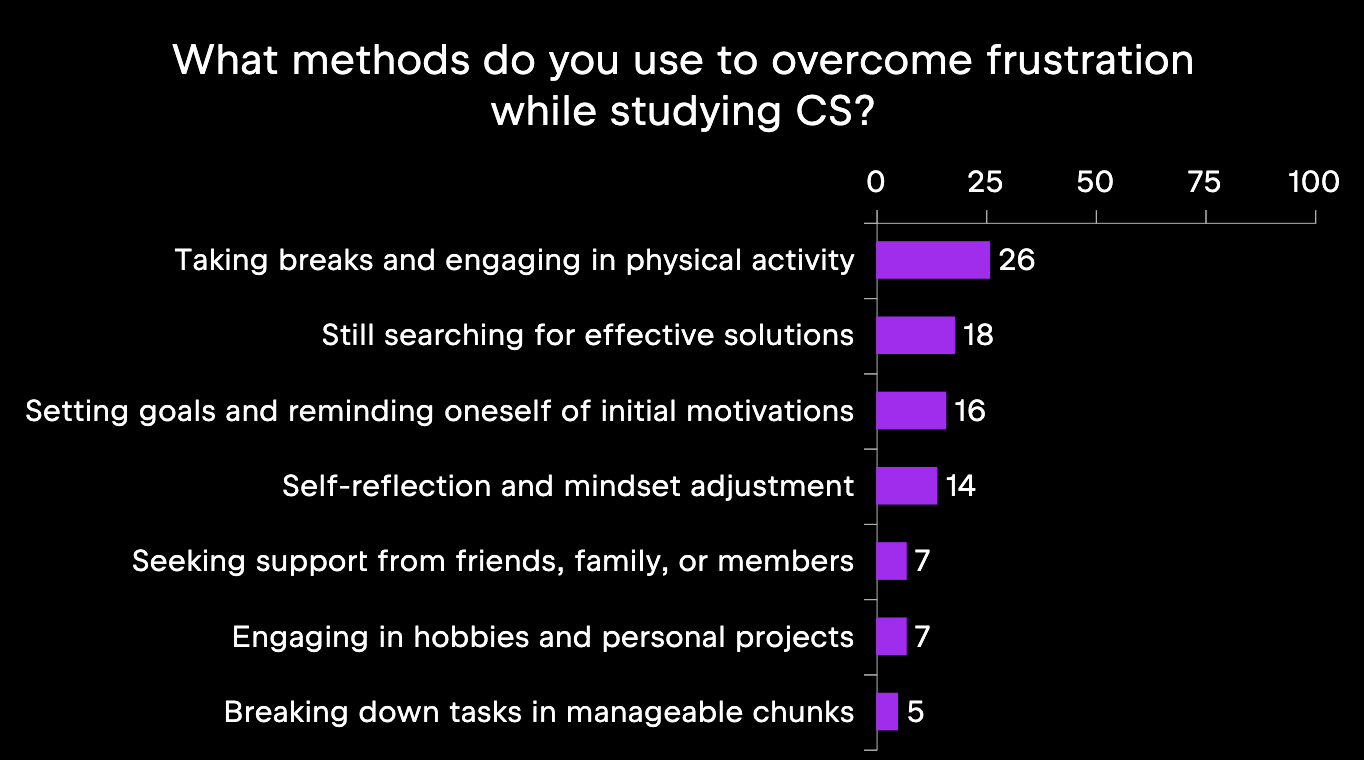
The students who answered this question reported a variety of methods, but one of the most common responses was that they are still looking for an effective way to overcome frustrations in CS learning. For educators and those creating CS courses, this is a valuable insight!
In summary, studying CS involves challenges like abstract concepts, heavy workloads, and unengaging content, which can lead to frustration and course dropout. To cope, students try to offset the frustration with physical activity and internal motivations, but many still need support in this. Our dataset can offer answers to questions about student behavior beyond what is reported here.
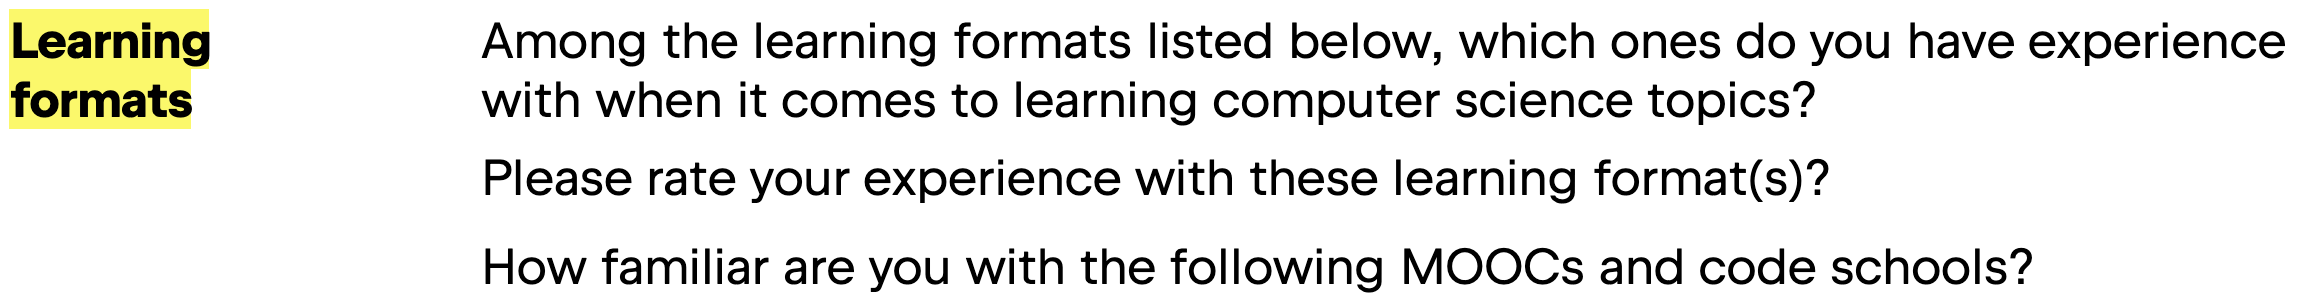
Learning formats
In this subset of questions, we were interested in the most popular learning formats and what the participants’ experience with them was. Although we already know that it is possible to study CS with in-IDE courses or with MOOCs, we were interested in a more systematic view of learning formats and in including more formal education options like university. The relevant survey questions are listed below; all three were multiple-choice.
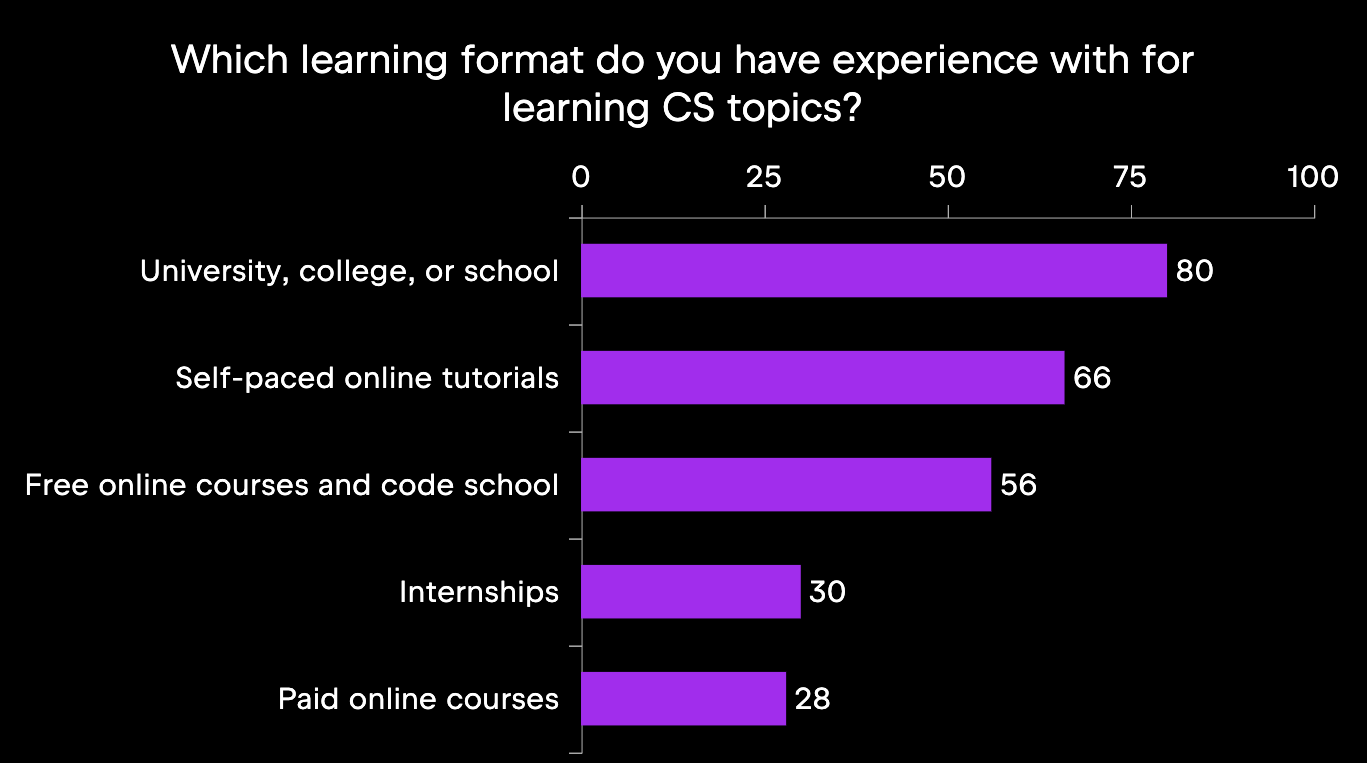
First, we will look at the most common learning formats, depicted in the below infographic. The most popular format is to learn at university, college, or school at about 80%; the second most popular are self-paced online tutorials with two-thirds of the participants reporting this experience. Internships and paid online courses, for example, are less common, at about 30% for each.
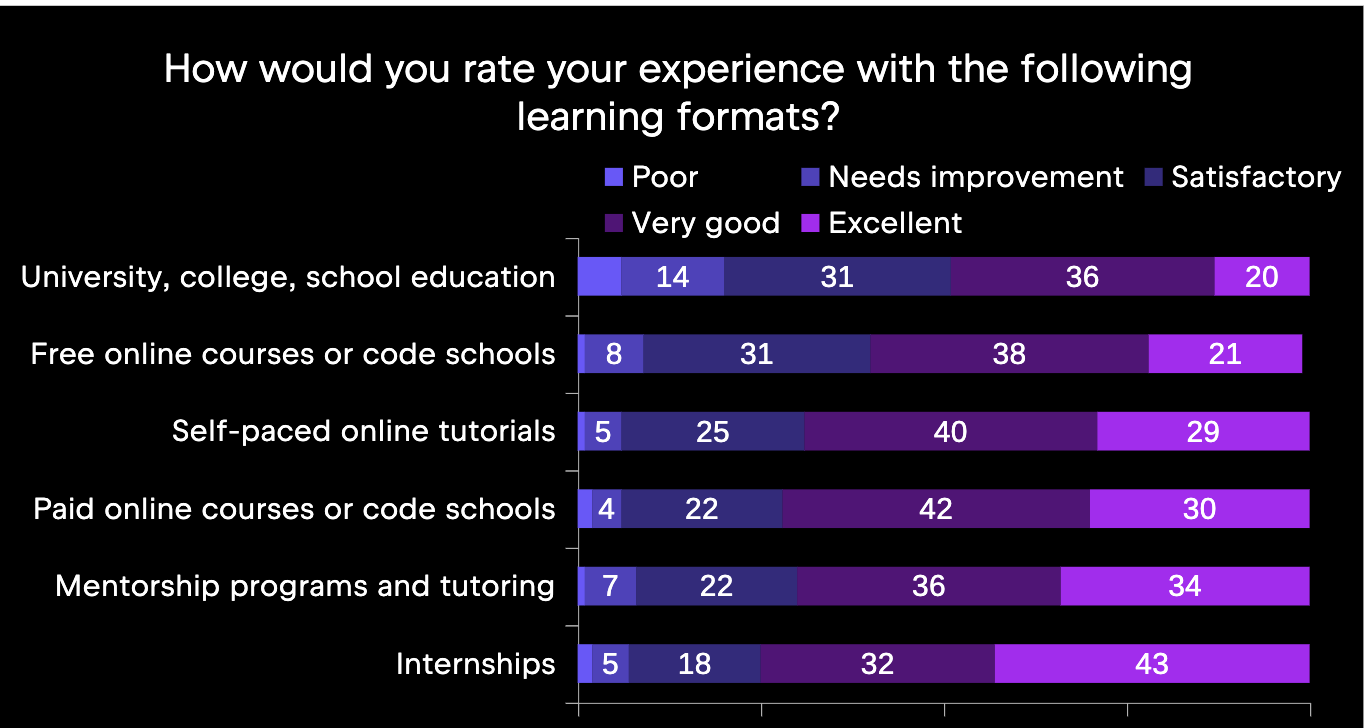
Interestingly, while formal CS studies are very popular, our survey participants rated this format as the worst. More positively rated learning formats include both the more common self-paced online tutorials, and the less common paid online courses and internships. Check out the ratings in the below image.
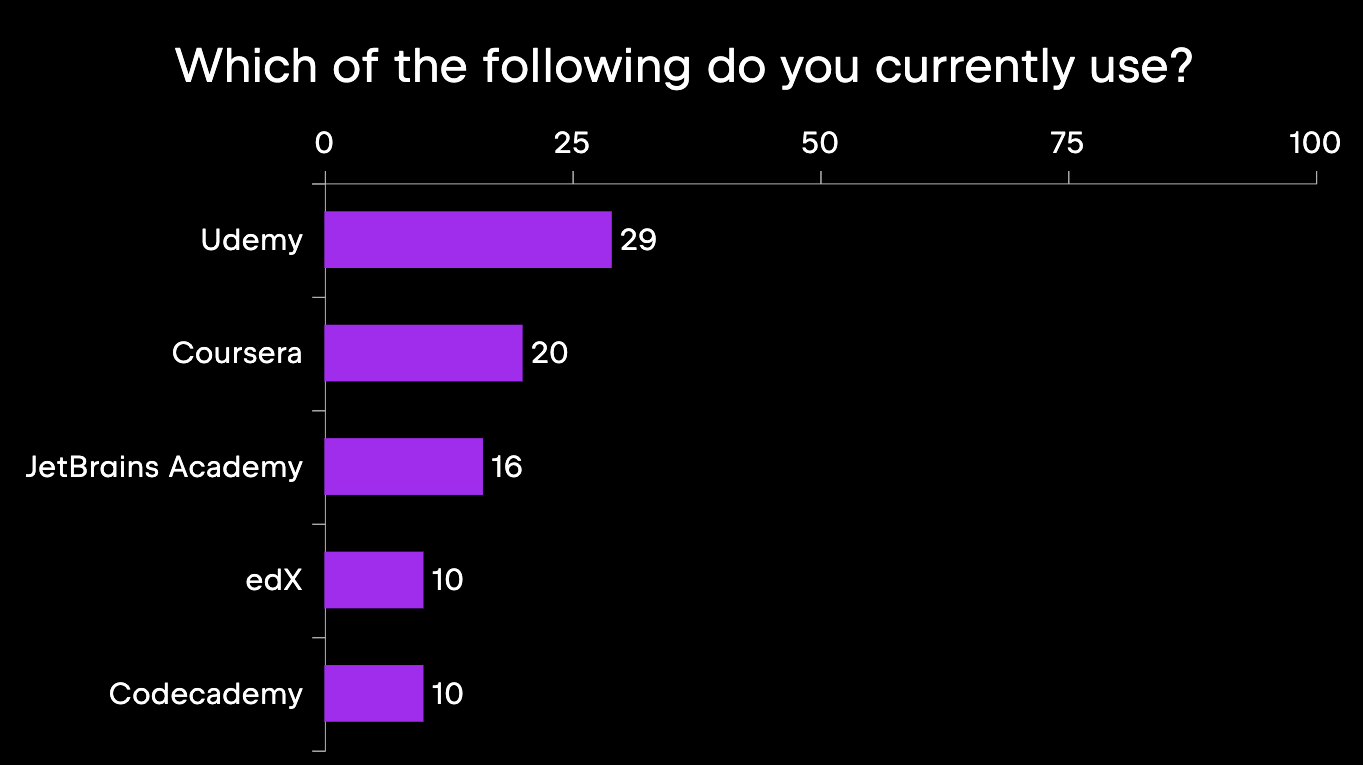
As far as which online courses are the most popular, we can see in the following image that Udemy is used by about 30% of respondents, followed by Coursera at 20% and JetBrains Academy at just above 15%.
From this data, it is clear that students are exploring alternative learning formats, in addition to the traditional formal schooling path, and that they often rate the former better than the latter. As our dataset is available online, it can be used by any researcher to target more narrow topics or specific correlations not reported here – and we think there are many more patterns to explore!
In-IDE learning
Finally, we will look at CS learners’ challenges with in-IDE learning, a format that can be found in a subset of online CS courses. In-IDE learning is new and is becoming more and more popular, as the student can learn to code inside of a professional IDE, i.e., with an industry tool. For this topic, our researchers identified a subset of survey respondents based on answers to the following questions.
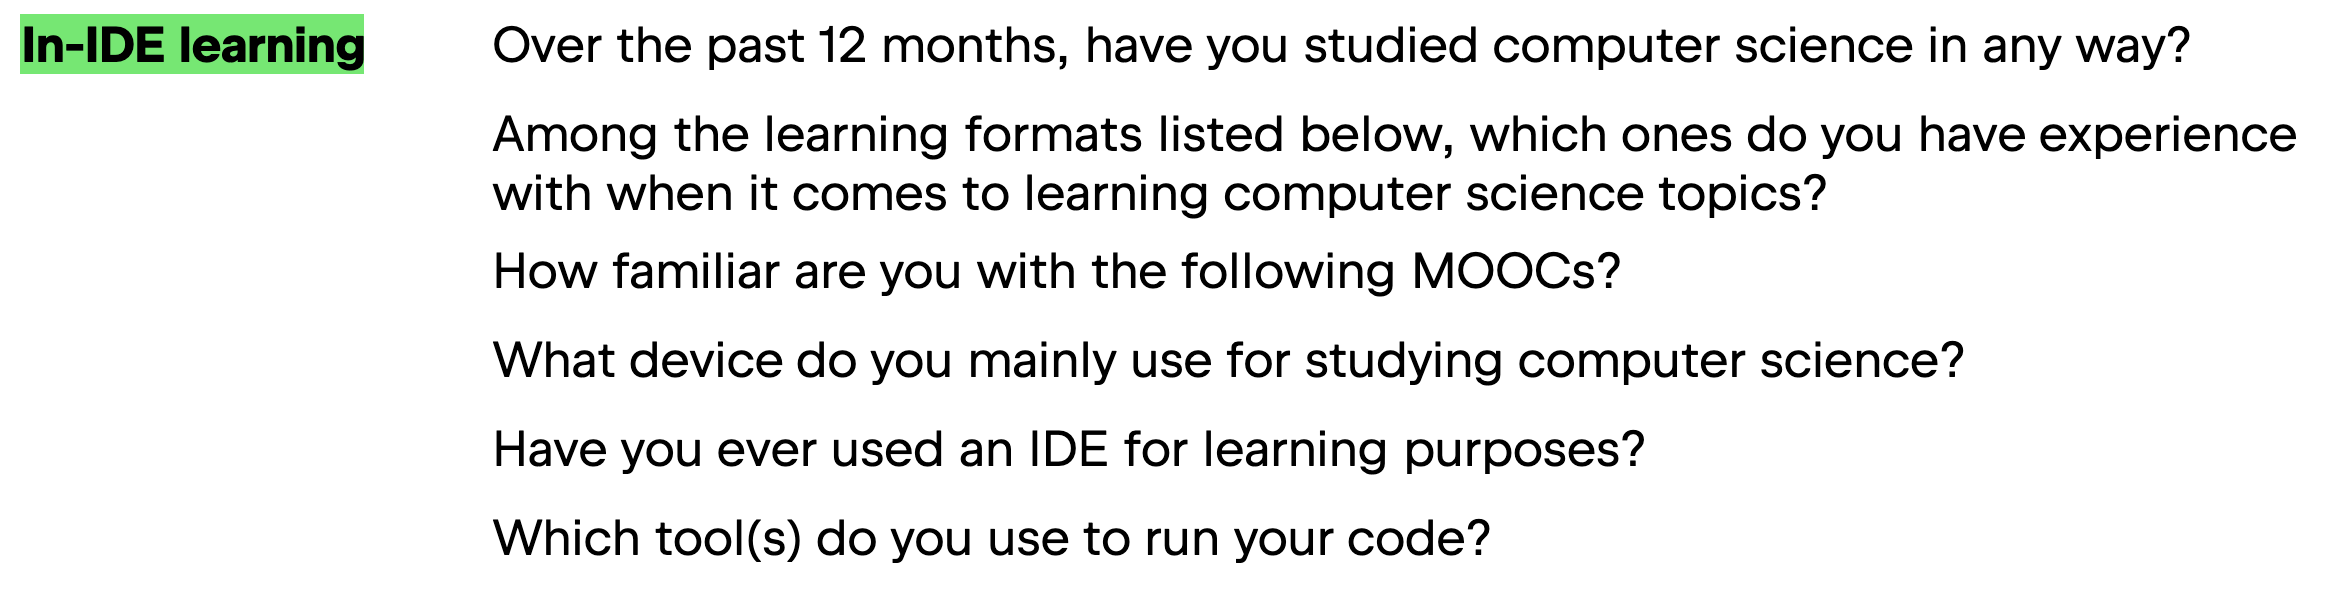
For example, if a respondent indicated that they recently studied CS and currently use a MOOC such as JavaRush or JetBrains Academy, it is very likely that they are familiar with in-IDE learning. After identifying a subset, we then looked at their responses to the following question:

The top responses in this subset parallel what we saw above in the previous subsection about general CS learning challenges: as shown in the below figure, the most common reported challenge is Understanding abstract and complex concepts.
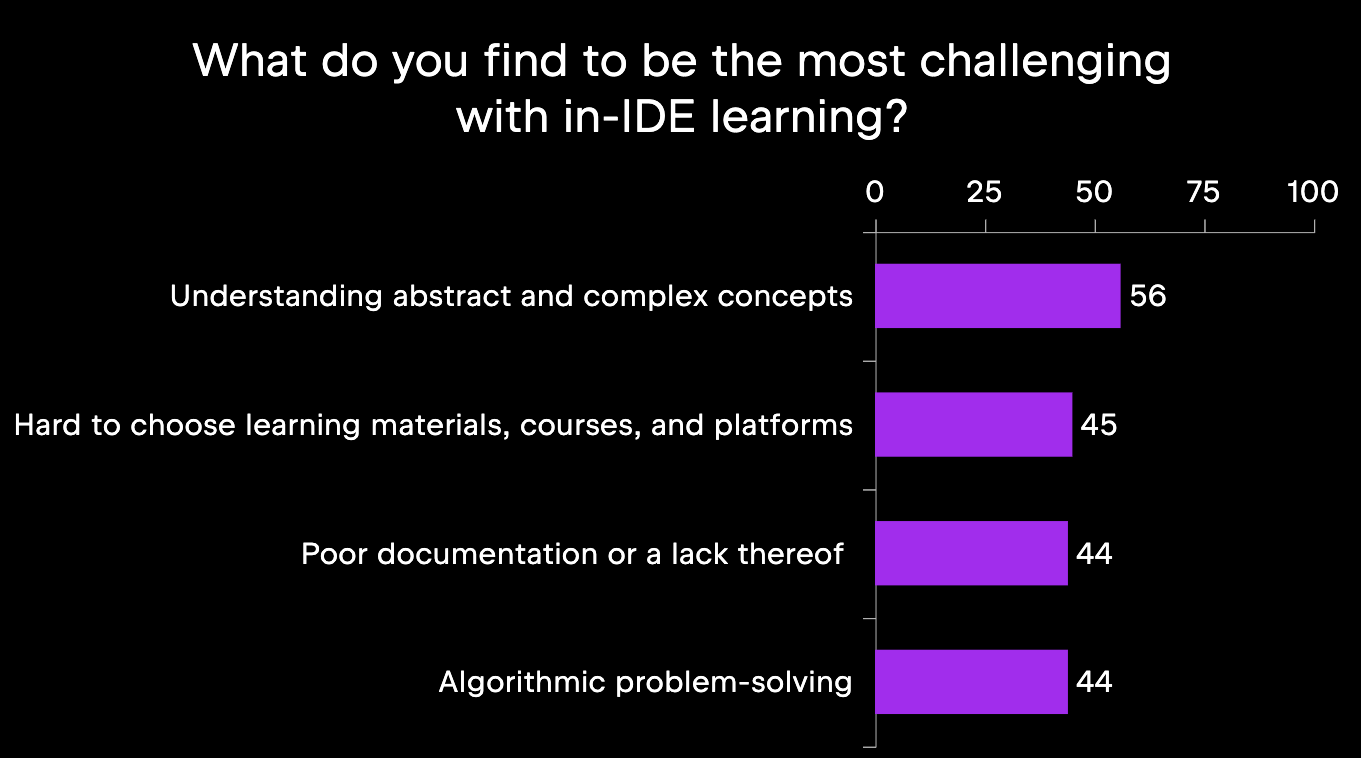
Where this subset differs from the broader dataset is in the subsequent categories: Hard to choose learning materials, courses, and platforms moved up to the top three, and categories like Getting stuck on a particular problem fell further down in importance. As in-IDE learning is quite new, it makes sense that getting oriented within the IDE presents a bigger challenge to students than completing specific tasks.
As this research direction concerns a very new learning format, it shows the most potential for future studies about CS learners. In addition, we reported this subset’s data as an example of how our dataset can be mined for information about particular groups, whether based on geographical location, area of study, or, as was done here, learning format subset.
Want to collaborate with us?
Our CS education dataset contains both broad topics and a broad demographic. In this way, it is suitable for the quantitative analysis of many CS-learning-related topics. Researchers can focus on specific subsets of the data or examine interactions between multiple variables to uncover new insights about CS education effectiveness.
This project also shows the potential of industry-academia partnerships in educational research. The benefits of combining industry resources with academic rigor include the following:
- We can conduct studies at scales previously impossible for individual institutions.
- We can accelerate progress in understanding educational effectiveness and help institutions make evidence-based decisions about curriculum design, teaching methods, and student support services.
- The commitment to open data sharing ensures that insights benefit the entire research community rather than remaining proprietary.
The Edu Research lab welcomes inquiries about dataset usage, research partnerships, and suggestions for future survey topics. Whether you’re investigating specific aspects of CS education or proposing new research directions, we’re eager to support studies that advance our understanding of effective computer science learning.
To discuss collaboration opportunities or share your research ideas for future global surveys:
Want to learn more about research insights and take part in future JetBrains studies? Join our JetBrains Tech Insights Lab!