Scala Plugin
Scala Plugin for IntelliJ IDEA and Android Studio
AttachMe – Attach the IntelliJ IDEA debugger to forked JVMs automatically
TL;DR
Sometimes you need to attach the IntelliJ IDEA debugger to a running JVM process. Using the Attach to process... action frequently, however, can slow you down a little bit. You might want the IntelliJ IDEA debugger to attach automatically to any process that was spawned outside of IntelliJ IDEA (from the terminal, a build tool, etc.) without having to interact with IntelliJ IDEA each time. Or you might want the debugger to attach to any child JVM that was spawned by the debuggee process. The AttachMe plugin helps solve these issues. Take a look at https://github.com/JetBrains/attachme for instructions and examples.
AttachMe Debugger plugin
The problem
Running a Java application in debug mode is quite straightforward in IntelliJ IDEA. To achieve this, IntelliJ IDEA adds the JDWP JVM agent by adding the -agentlib:jdwp=... option when you run a debug run configuration.
Now imagine a situation where we have to attach the IntelliJ IDEA debugger to a JVM process that’s spawned by a third party process (a build tool for example). First, we need to enable the JDWP agent so that the JVM can attach it. One option is to change the command line arguments and add the -agentib:jdwp=... configuration, but this may prove difficult if we don’t have access to the source code. There are many other ways to achieve this, but one of the easiest is to define an environment variable for the parent process (possibly bash shell), like this:
export JAVA_TOOL_OPTIONS="-agentlib:jdwp=transport=dt_socket,server=y,suspend=y,address=*:0"
Next, we can easily attach the IntelliJ IDEA debugger by finding and running the action Attach to process... This seems like an easy solution. However, when we have to do this frequently, it can get a little annoying to tell IntelliJ IDEA to attach to specific processes manually.
The solution
We’ve created a plugin called AttachMe that helps solve this problem. Using this plugin, the IntelliJ IDEA debugger will attach to any JVM application automatically regardless of whether it’s spawned from IntelliJ IDEA, the terminal window, a build tool, etc. As an added bonus, the debugger will attach to all of the subprocesses, essentially giving it the same behavior as set follow-fork-mode child in the GDB debugger.
Usage
- Download and install the plugin from the plugin marketplace. https://plugins.jetbrains.com/plugin/13263-attachme/
- Start the AttachMe listener by going to
Run > Edit Configurations > Add New. Then search forAttachme, select it, and run. - On the first run, the plugin will install a JVM agent jar and a bash configuration script in the $HOME/.attachme/ directory. To auto-attach the debugger, configure AttachMe like this:
source ~/.attachme/conf.sh

java com.example.MyApp # anything that runs on the JVM
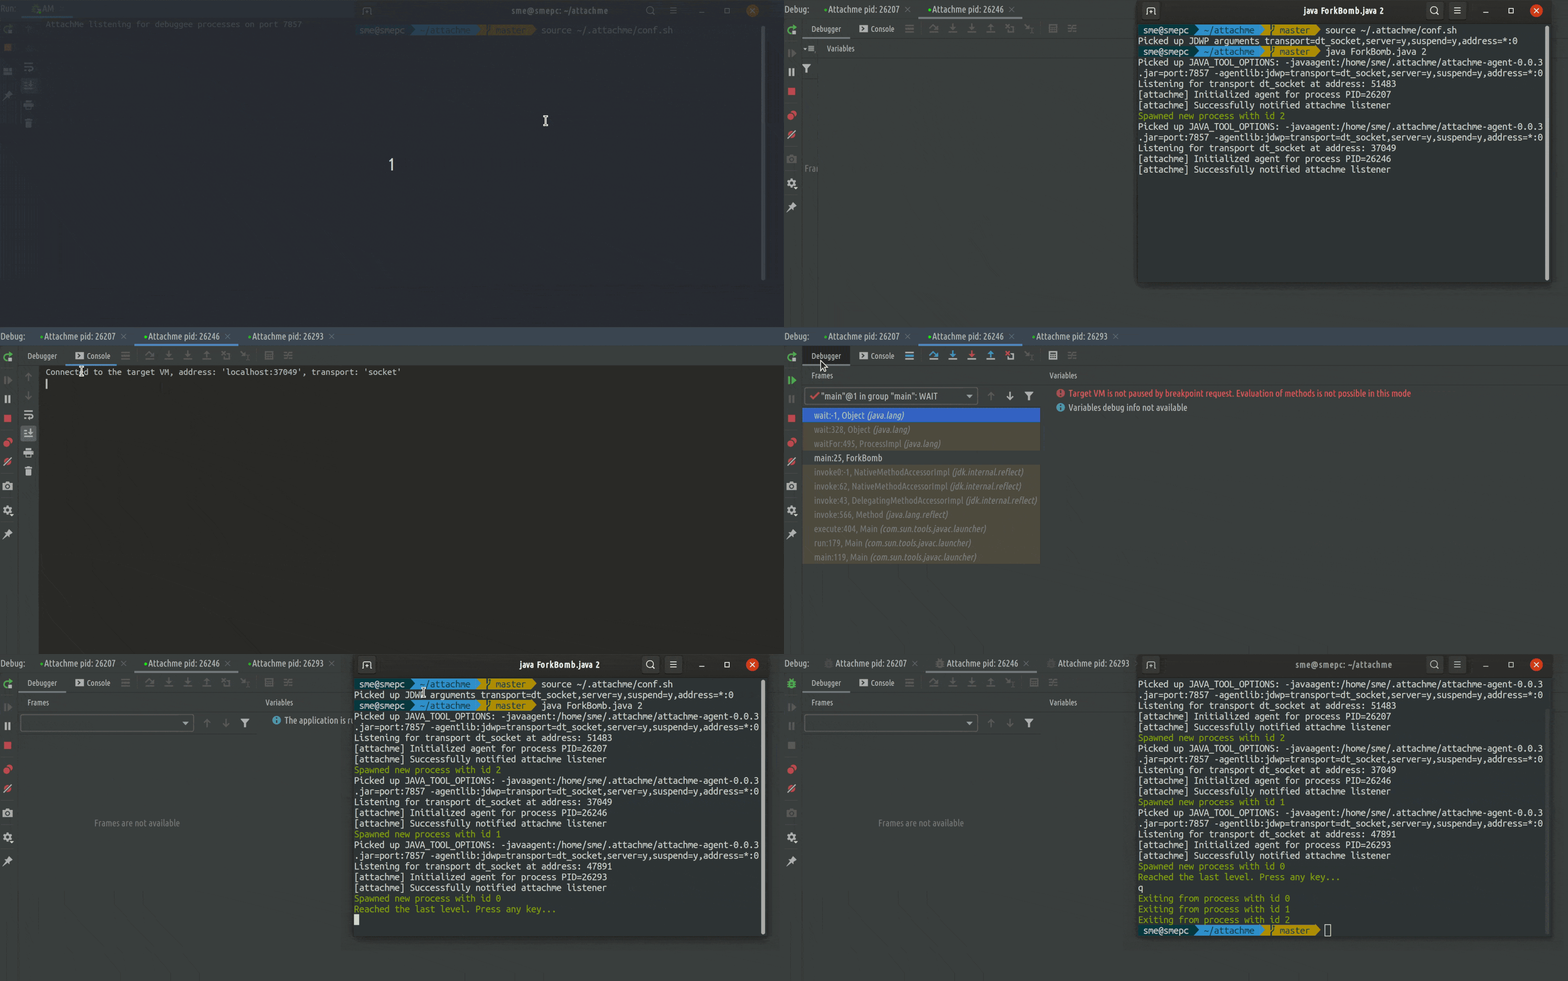
Now you should see a new debugger window attached to the process and any of its child processes.
If you want to have custom JDWP or AttachMe port configuration, you can run it like this:
JDWP_ARGS="transport=dt_socket..." AM_PORT=9009 source ~/.attachme/conf.sh

java com.example.MyApp
- (Optional) If you want your IntelliJ IDEA run config to use AttachMe, you need to copy and paste the JAVA_TOOL_OPTIONS environment variable to your run configuration. Note that the run config type should be an ordinary run config (not debug), since it will conflict with JDWP args provided by IntelliJ IDEA. To get the value of the JAVA_TOOL_OPTIONS environment variable, just run this in the bash terminal:
source ~/.attachme/conf.sh

echo $JAVA_TOOL_OPTIONS
How it works
AttachMe makes use of an agent library and the environment variable JAVA_TOOL_OPTIONS to configure the order of agents and to propagate that configuration to child processes. After running source ~/.attachme/conf.sh you can see it by using the following:
$ echo $JAVA_TOOL_OPTIONS

-javaagent:/home/sme/.attachme/attachme-agent-0.0.3.jar=port:7857 -agentlib:jdwp=transport=dt_socket,server=y,suspend=y,address=*:0
This should first load the AttachMe agent, then the JDWP debugger agent. The AttachMe agent tries to identify the listening port number of the debugger (it should always be set to 0, which means any free port). After finding the port, the agent sends it to the IntelliJ AttachMe listener through a TCP connection. It’s really important to have the JDWP bind to port 0 and set suspend to “y”
Known Issues
- You may have a problem with the bind address, which will manifest itself with this error:
JDWP exit error AGENT_ERROR_TRANSPORT_INIT(197): No transports initialized [debugInit.c:750]
To fix it, try to configure AttachMe with port address 127.0.0.1, like this:
JDWP_ARGS="transport=dt_socket,server=y,suspend=y,address=127.0.0.1:0" source ~/.attachme/conf.sh
- AttachMe is not compatible with the JMX agent. If you are having problems running it with the auto generated SpringBoot run configuration, most likely disabling JMX will fix the problem.


