TeamCity
Powerful CI/CD for DevOps-centric teams
Beyond the Build Log: How TeamCity Provides Actionable Build Insights

This article was brought to you by Kumar Harsh, draft.dev.
Where there is a CI/CD pipeline, there will be build logs. And while they’re important, anyone who’s stared at one knows the pain: thousands of lines of plain text, buried errors, and endless scrolling just to find out why something failed. What should be a quick diagnosis turns into a needle-in-a-haystack hunt.
Raw logs are useful, but they’re not enough. Developers don’t just need to know that a build failed; they need to know where, why, and how often it’s happening. That’s the difference between the text you read and the insights you act on.
In this article, we’ll look at how TeamCity goes beyond the build log. You’ll see how its structured log view, visual pipeline insights, and trend analysis help you navigate failures faster, spot performance regressions, and even anticipate recurring issues.
By the end, you’ll understand how TeamCity turns “just another log” into a tool for building better software faster.
The wall of text
Every developer has faced the dreaded wall of text. A build fails, and suddenly you’re staring at thousands of lines of console output. Somewhere inside is the clue you need: an error code, a failed test, or a timeout. But it’s buried under a flood of status messages and stack traces.
Searching helps, but you need to know exact keywords, and oftentimes you don’t know the exact error messages to search for. The longer the build, the longer its output, and the harder it gets to pinpoint issues.
Traditional CI systems don’t make this any easier. Take Jenkins. Its build logs are essentially flat text files. You can scroll, you can search, but there’s no real structure. A build step is just a line in the log, indistinguishable from all the noise around it.
If you want to know which step failed or how long each stage took, you’re left to manually scan through endless lines.
This lack of structure creates three major pain points:
- Flat logs with no hierarchy: There’s no easy way to jump between stages and steps or to test the results
- Zero visual cues: Errors don’t stand out. You have to read line by line.
- Hard-to-trace correlations: Connecting a failing test back to its stage or seeing how long a step ran becomes a lengthy, manual exercise.
The result is that debugging builds becomes a time sink. Instead of focusing on fixing issues, you waste cycles just trying to interpret the logs yourself.
That’s the problem TeamCity set out to solve.
What does a TeamCity build look like?
TeamCity rethinks how build information is presented. Instead of forcing you to scroll endlessly through output text, it structures results in a way that’s easy to navigate, interpret, and act on.
Think of it as moving from a raw server console to a dedicated dashboard built for surfing through logs. The build results page is designed to be a living view of your pipeline, complete with context, hierarchy, and visual cues.
You can see the entire flow of a build at a glance, drill into specific steps with a click, and watch logs update in real time as the build progresses.
This shift to a logs “browser” instead of a logs “dumper” is what makes TeamCity different. It focuses on highlighting problems so you can spend more time fixing issues than searching for them.
How does TeamCity structure its logs differently?
The first, most obvious thing you’ll notice in TeamCity is that logs aren’t just dumped into a giant text file. They’re organized hierarchically, following the natural flow of your pipeline.
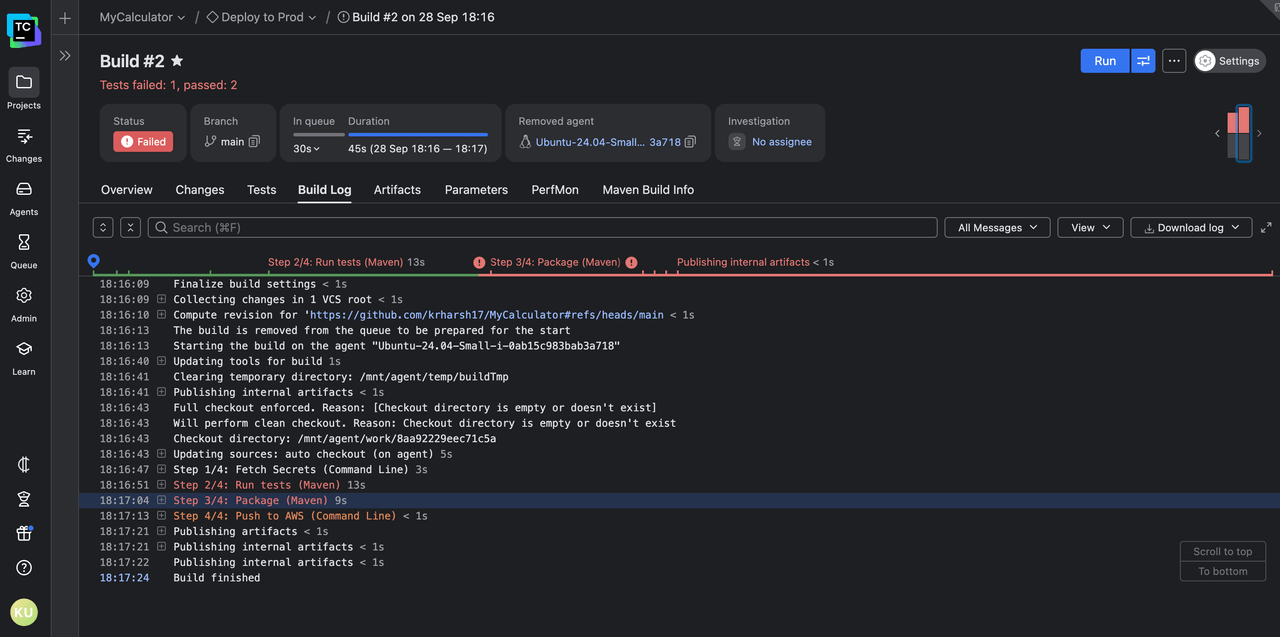
Each layer is collapsible, which means you don’t have to scroll past hundreds of lines just to find the one step you care about.
Want to focus on a failing test step? Collapse everything else and zoom in on the problem area.
This structure also updates in real time. As your build runs, you can watch each step expand with fresh output while the rest of the log stays neatly tucked away. No more hunting for the latest lines in a never-ending scroll.
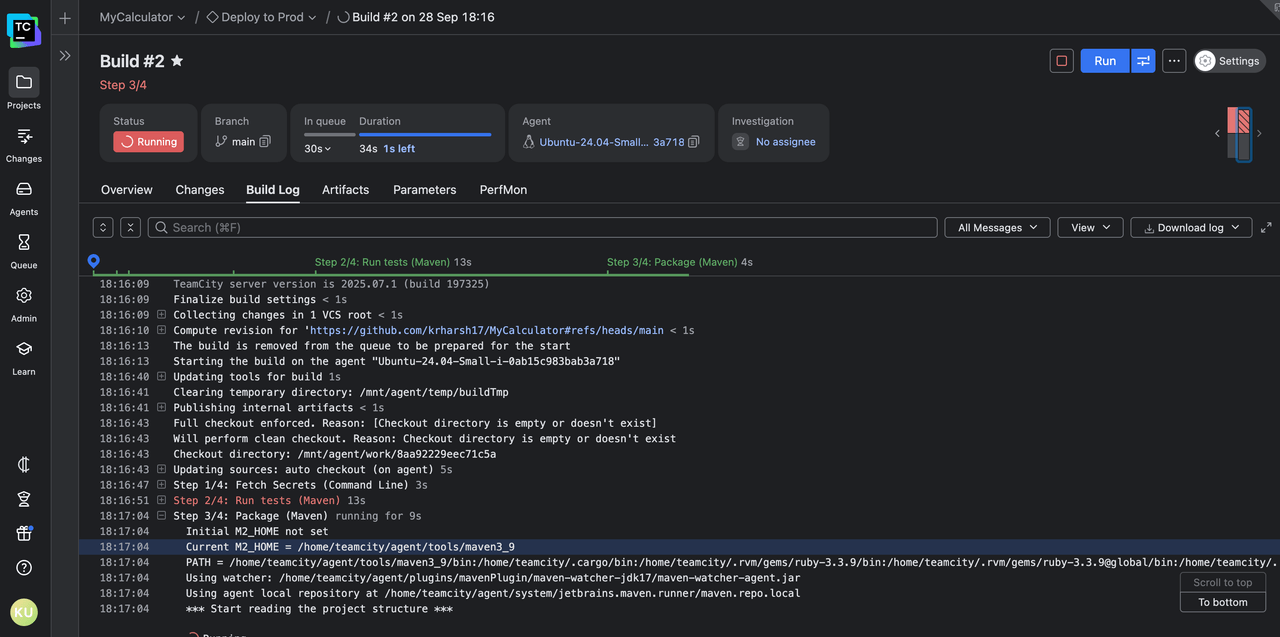
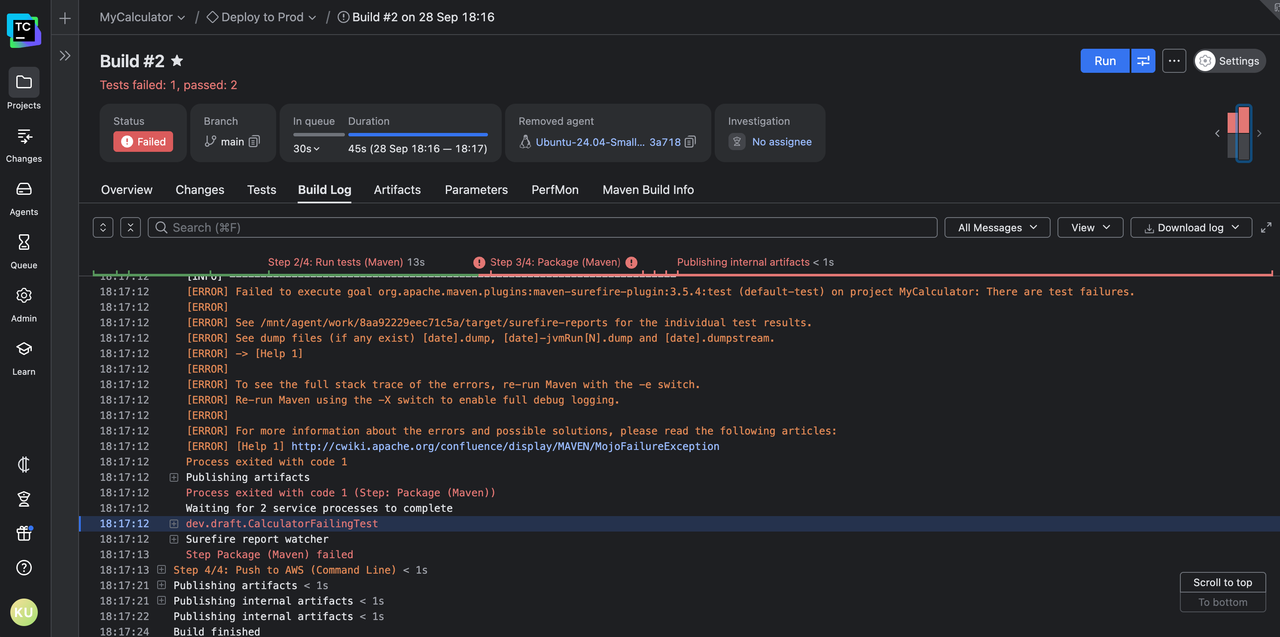
This means that, more often than not, you’ll pick up the error message and reason right in front of you as it happens instead of having to wade through lines after a build has failed and has dumped its logs.
How do TeamCity’s visual tools improve developer productivity?
Structured logs are a big step forward, but TeamCity doesn’t stop there. It layers visual context on top of the raw output, so developers can spot problems and patterns without needing to parse every line.
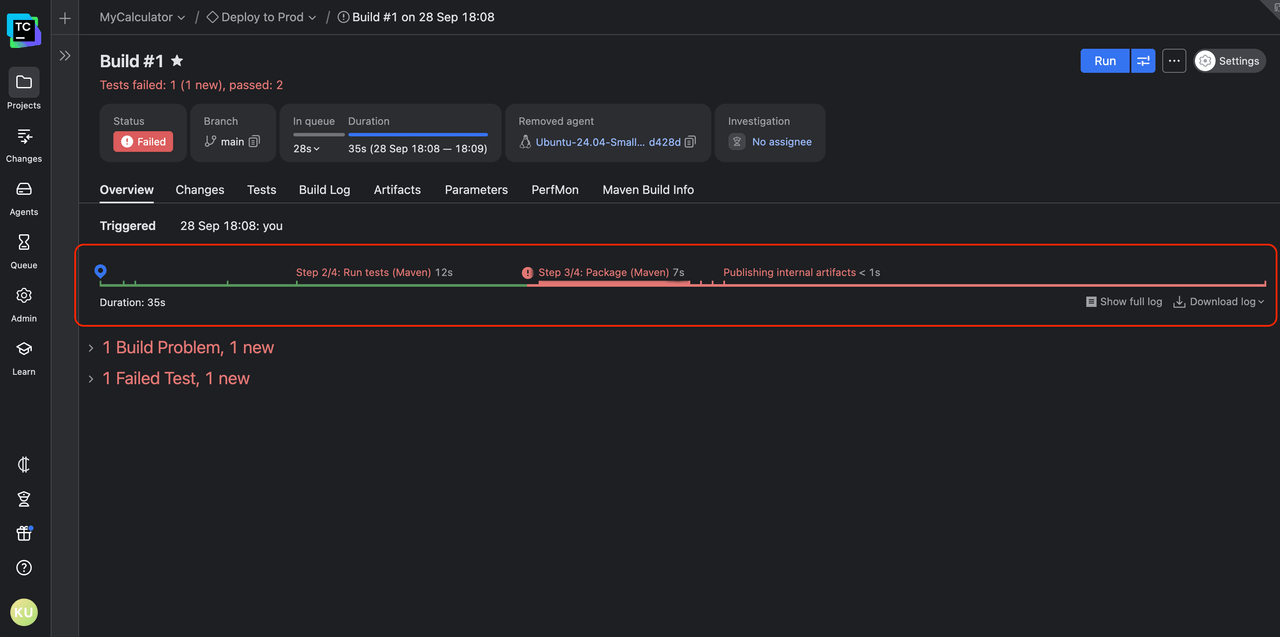
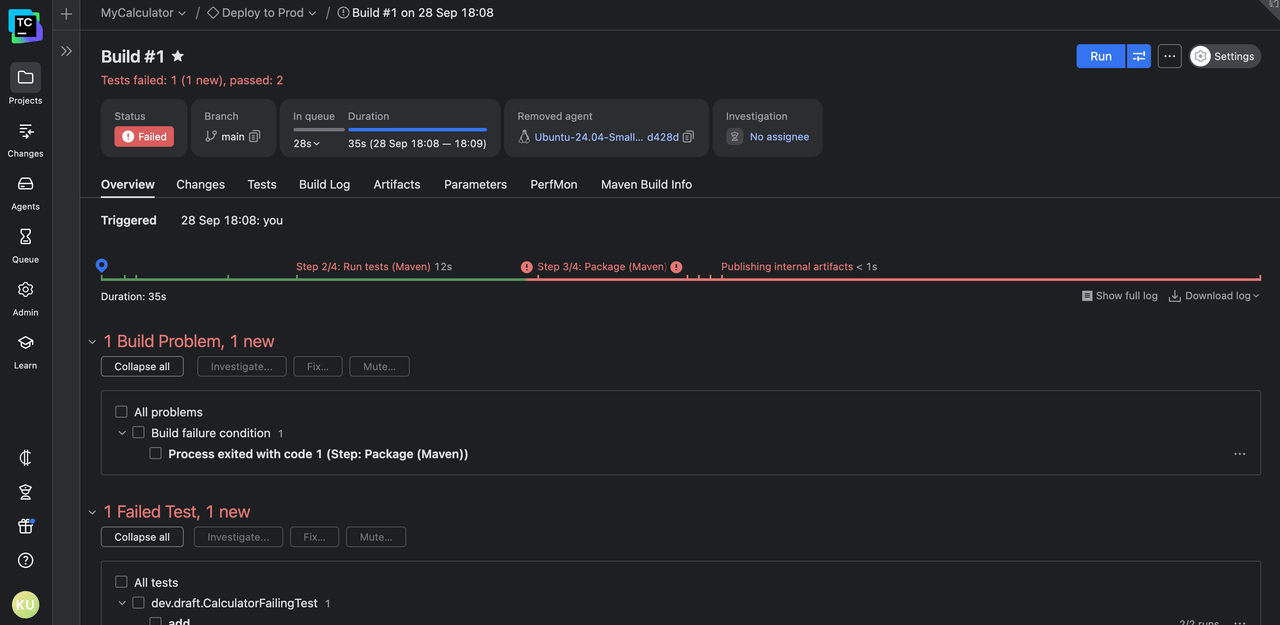
At a glance, you get a visual overview of the entire pipeline: each step, its status, and how long it took. This makes it easy to see whether a build failed fast or slowed down during a specific stage. Instead of you having to run a stopwatch in your head, TeamCity does the timing analysis for you.
Also, errors are highlighted in context, so they stand out immediately. No scrolling through lines of green “success” messages just to find the single red flag buried at the bottom.
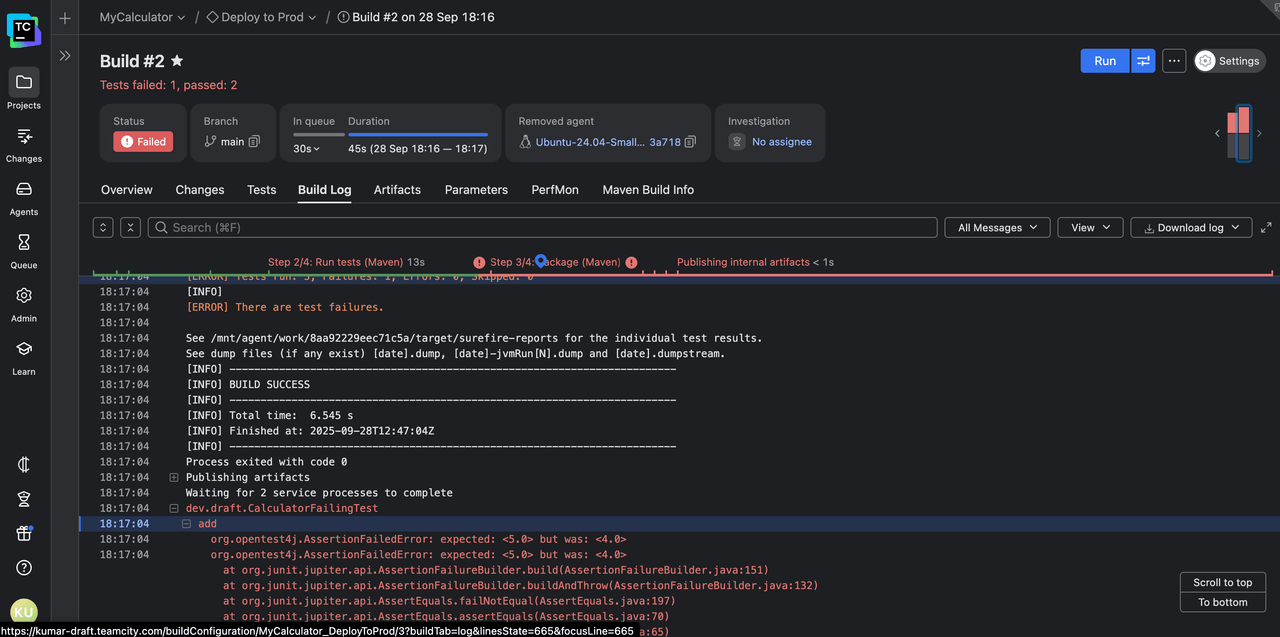
The failed step jumps out, both on the build timeline and the results page. Click on the timeline to quickly scroll to the error output line:
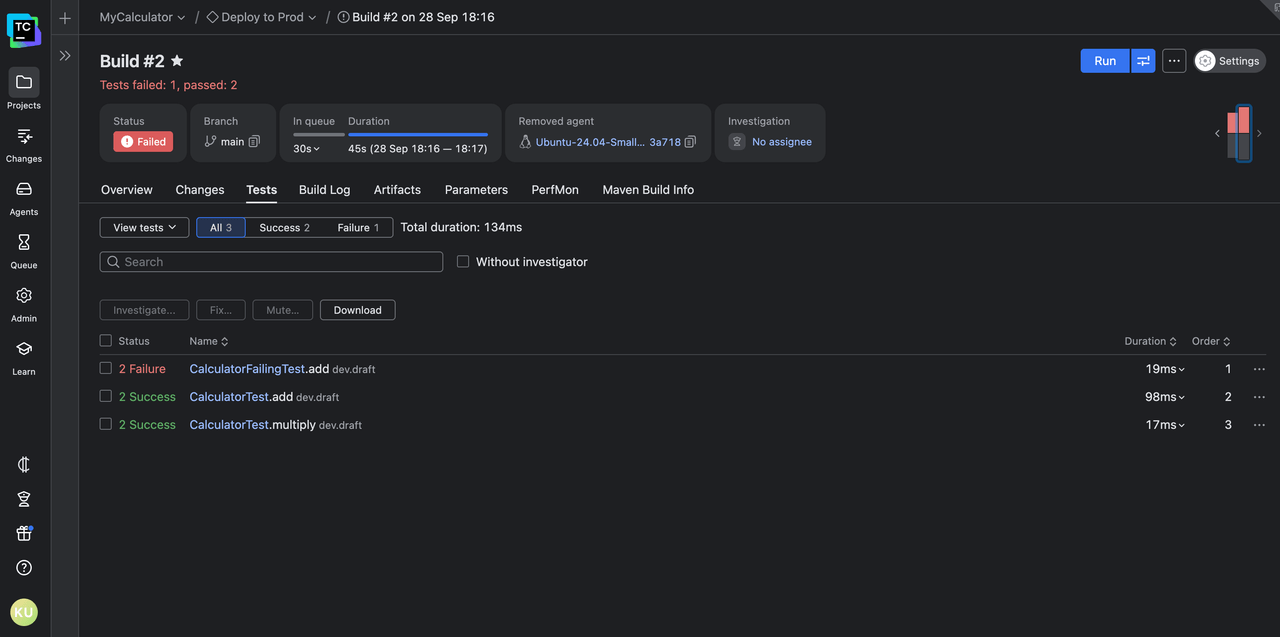
The Tests tab gives you detailed insight into how your tests performed across build steps:
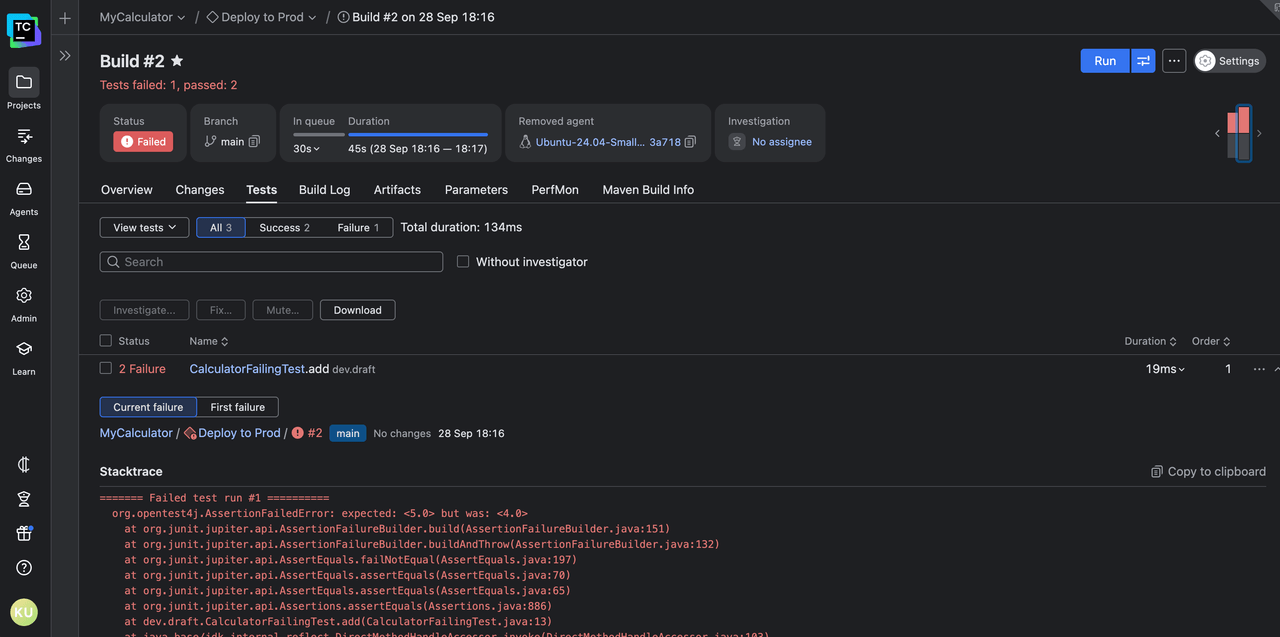
You can click on a failed test to see its output in the current run and the run where it failed for the first time:
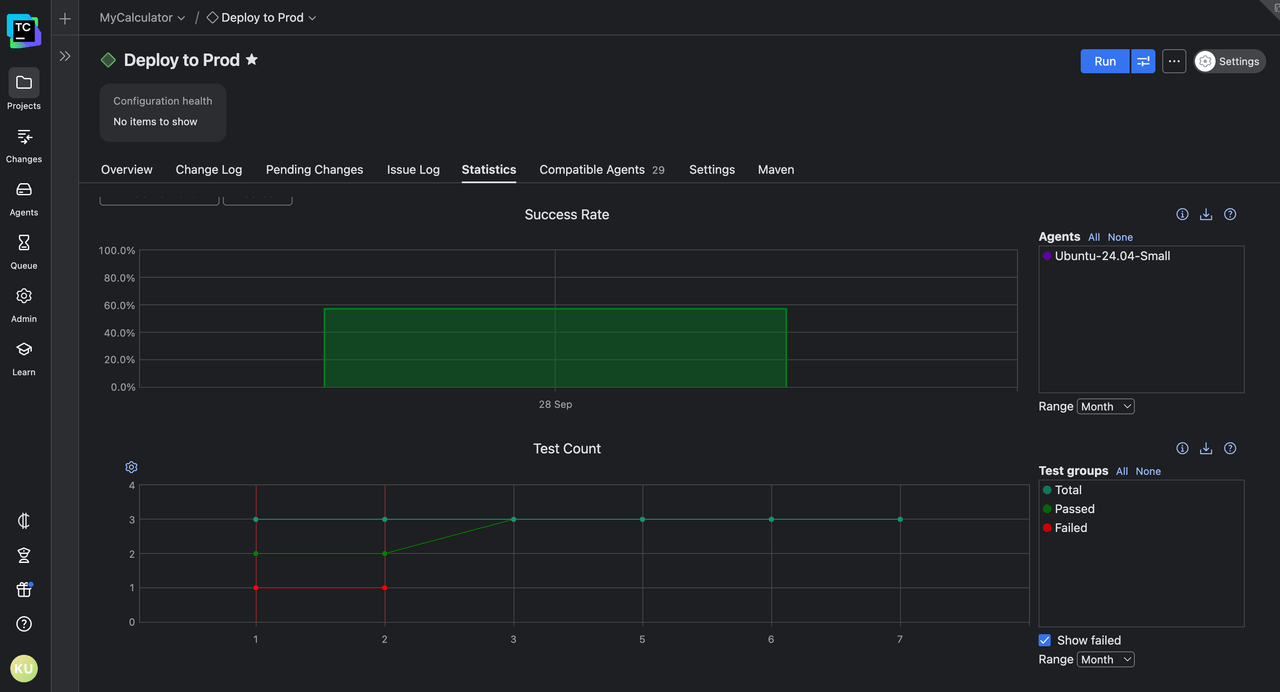
And because builds rarely fail just once, TeamCity also gives you historical statistics for your builds. You can see trends across multiple runs, like how often your builds have failed across days or how often your tests have failed with each build.
What types of insights are considered “actionable”?
Not every log line deserves your attention – what you really need are insights that point directly to the next steps.
TeamCity’s build statistics help you surface exactly those kinds of actionable signals.
For example, if a build suddenly takes twice as long, TeamCity can help you pinpoint the slow step. You can set up charts for each step that show trends over time so you know whether it’s a new dependency, a misconfigured cache, or an overloaded test suite. Instead of guessing, you see the bottleneck right away.
The following pipeline has had about seven builds so far, some of which failed as well. The build duration history looks like this:
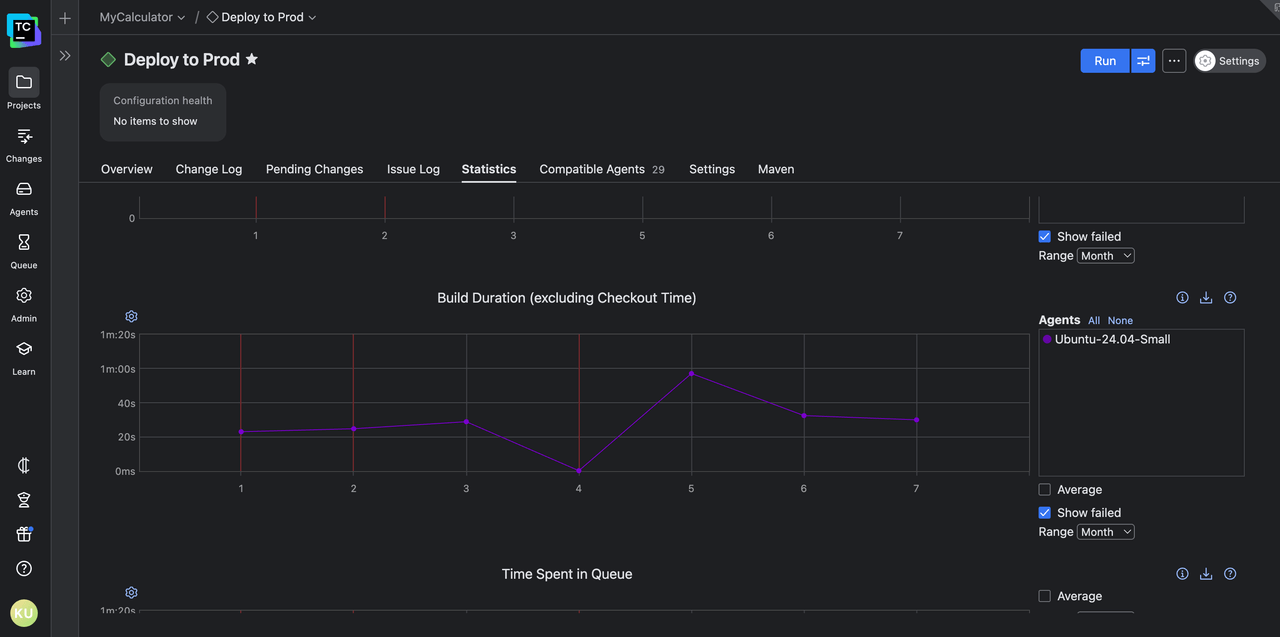
As you can see, after build #4 failed, build #5 succeeded, but it took way longer than usual to complete. The issue was somehow resolved in the next two build runs, #6 and #7.
This seems unusual at first. However, when you look at the stepwise build duration history for the build configuration, you find this:
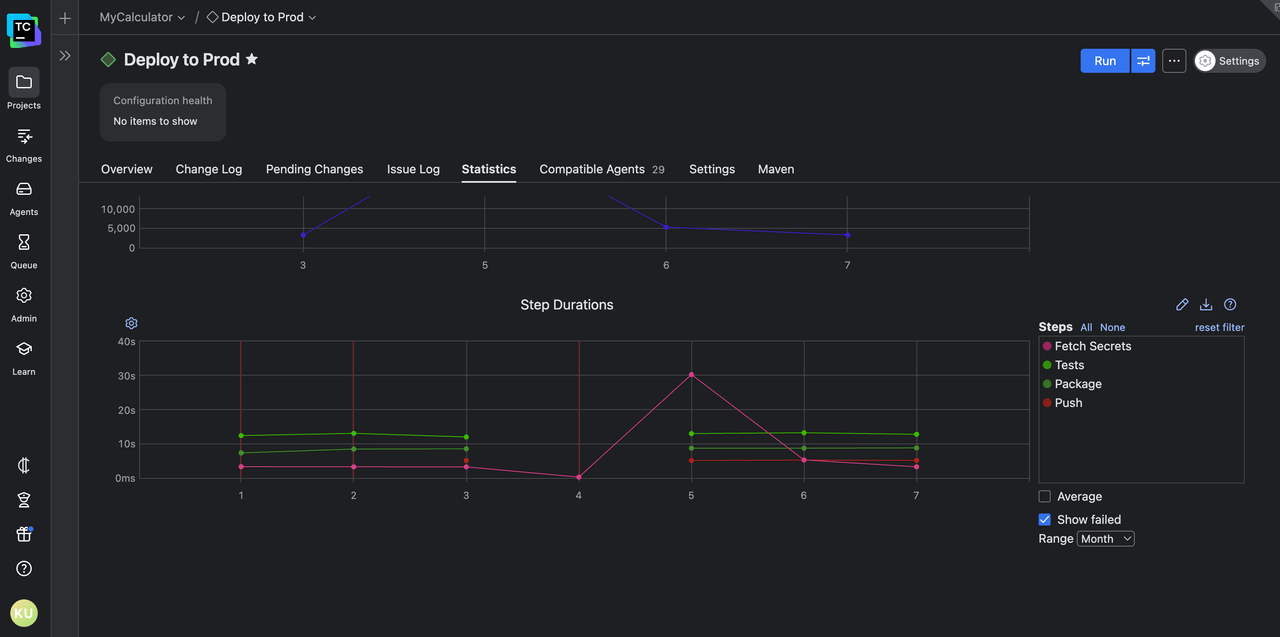
It’s clear that on build #5, the Fetch Secrets step took thirty seconds, which is way off from its usual two-to-five-second runtime. Since fetching secrets usually involves making network requests to a remote secrets manager, this could indicate an issue with your third-party secrets manager or with the network setup.
And you were able to narrow down the cause to the scope of a single step by looking at only two graphs.TeamCity also helps with other build-wide trends, like artifact size, block-level/class-level/line-level/method-level code coverage, time spent in the queue, and more.
You can see the full list of available statistics here. If you want to add a custom statistic for your pipeline, you can use service messages and easily create charts and graphs out of them.
What are the benefits?
So why does this matter for developers and teams working under pressure?
- Faster root cause analysis: The most obvious benefit is speed. TeamCity’s structured approach means you spend less time hunting and more time fixing. In high-velocity environments where every minute of downtime delays releases, this faster feedback loop makes a tangible difference.
- Understanding build performance: A failed test is one problem, but a slow build can be just as damaging. TeamCity’s step-by-step duration breakdown lets you spot build performance bottlenecks at a glance. Maybe a secrets fetch is dragging, or a test suite’s runtime has doubled. By surfacing this information, TeamCity gives you a starting point for optimization. You don’t just know that a build is slow; you know why it’s slow, and where to focus your efforts.
- Detecting patterns and preventing repeats: Another benefit is pattern recognition. Builds rarely fail for the first time out of nowhere. Often, you’ll see the same flaky test appear intermittently across runs or the same misconfigured environment variable pop up in different branches. Traditional logs leave you to connect those dots manually, but TeamCity makes those patterns visible through historical comparisons.
- Supporting proactive improvement: All these insights shift the developer mindset from reactive to proactive. Maybe you notice a steady increase in build duration, or memory consumption keeps varying without reason. TeamCity gives you the data to intervene before those issues become blockers.
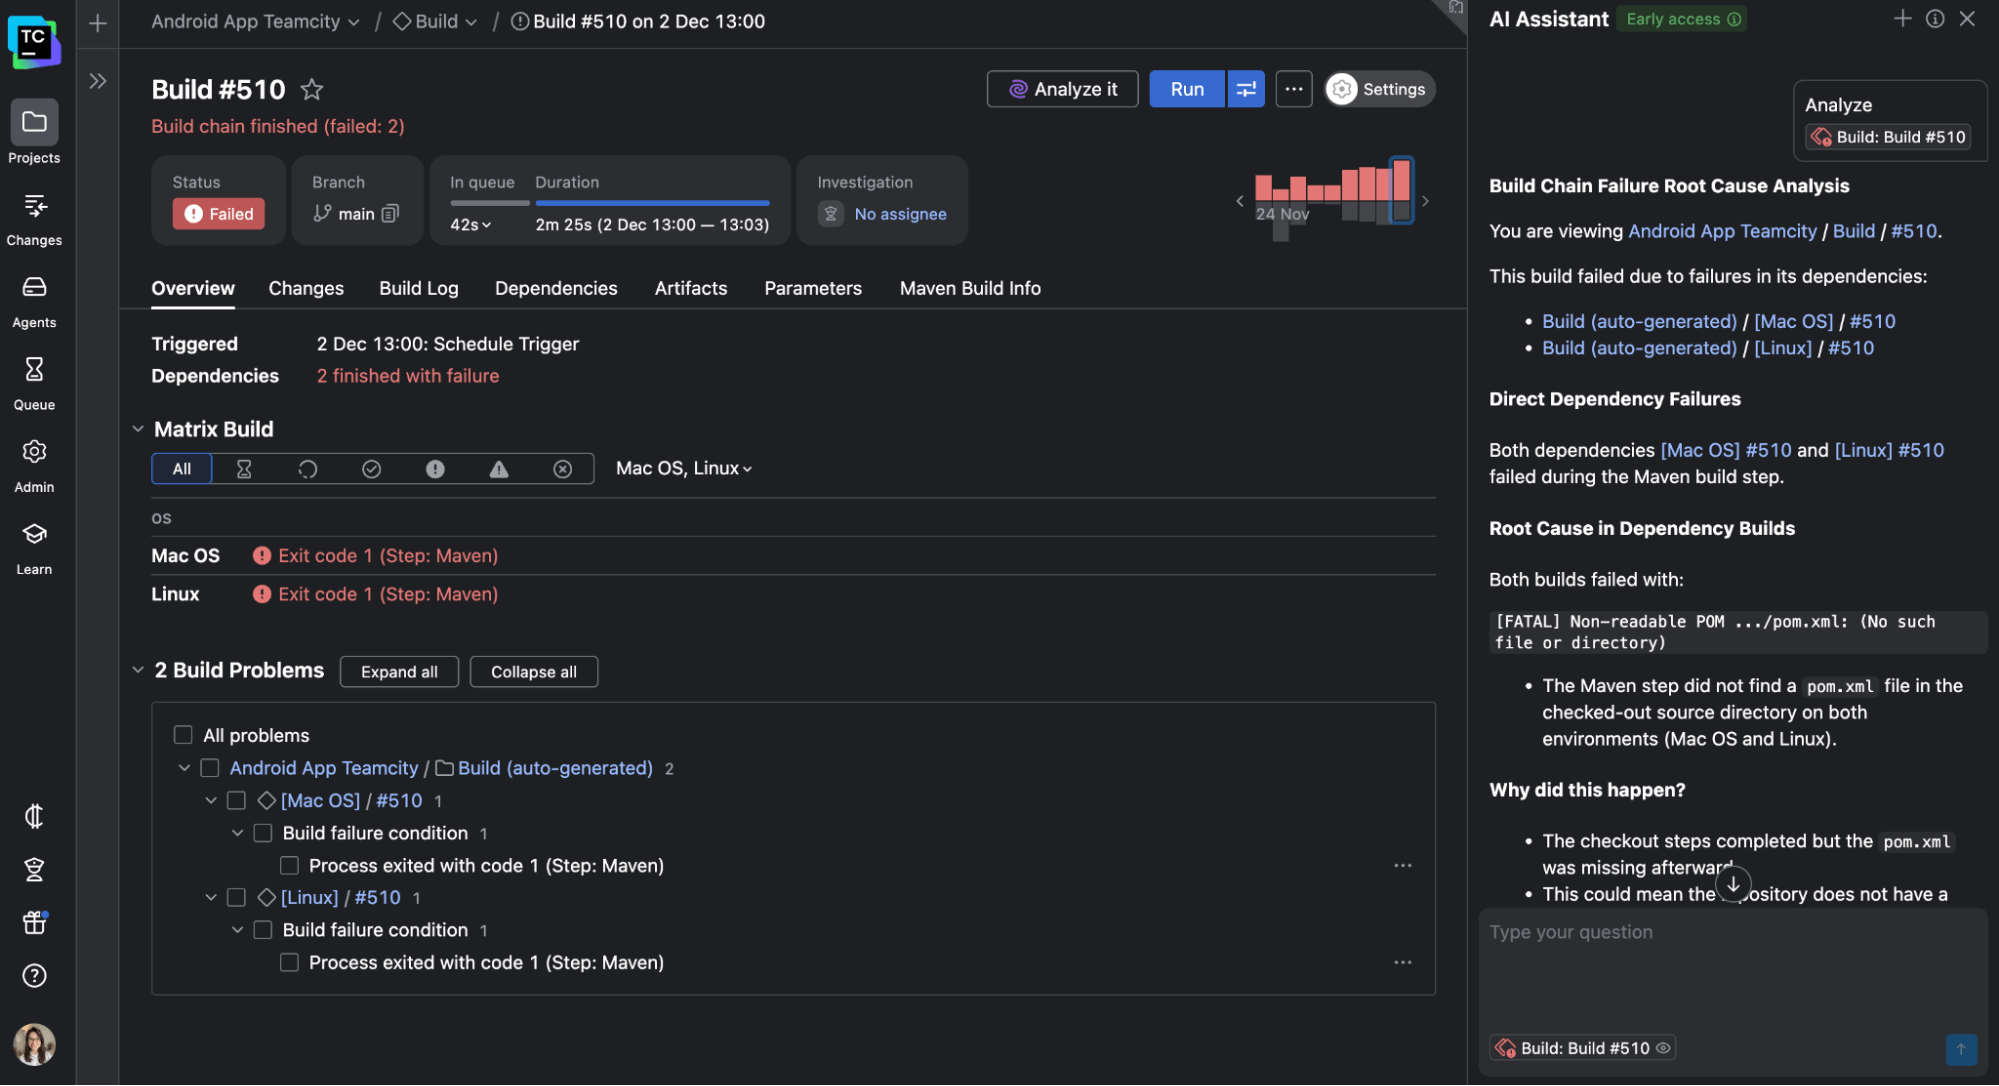
- Laying the groundwork for AI-powered insights: TeamCity’s structured data and historical awareness lay the foundation for what’s coming next. For instance, the upcoming AI Build Analyzer will analyze builds from multiple angles to suggest likely root causes and possible fixes. You won’t just read logs anymore but collaborate with an intelligent system to solve problems even faster.
Conclusion
Build logs will always be an important part of CI/CD debugging workflows, but they aren’t enough on their own. Raw text logs leave developers to do the heavy lifting of interpretation, slowing down feedback loops and burying critical issues in noise.
What developers need are insights: structured, visual, and actionable signals that point directly to the next step.
That’s what TeamCity delivers out of the box. From hierarchical logs and visual pipeline overviews to historical trends and pattern detection, TeamCity turns builds into a source of continuous learning rather than just reactive debugging.
The result is faster root-cause analysis, improved build performance, and a smoother path from code commit to deployment. And with innovations like the new AI Build Analyzer, the future of build intelligence looks even brighter.