
Debug command line scripts with PhpStorm 2.1

Hello everybody,
Recently, we have been often asked to provide a detailed guide in debugging command line scripts. And finally here you are!
Currently PhpStorm supports two debug extensions, namely Xdebug and Zend Debugger. Before start debugging command line scripts you need to configure your development environment: the PHP interpreter and PhpStorm.
Configuring PHP interpreter
Please, follow the links below to find detailed instructions in configuring Xdebug or Zend Debugger:
Configuring PhpStorm
First of all, you need to tell PhpStorm which interpreter to use for launching scripts.
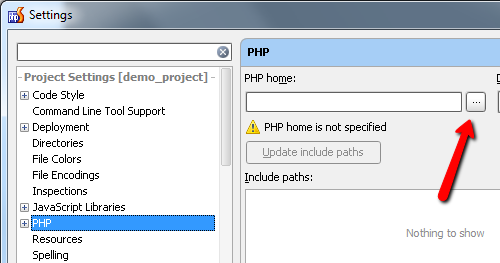
Select path to PHP home
Next, you need to specify the extension you are going to use for debugging.
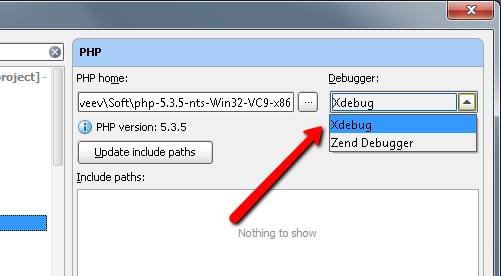
Select PHP debug extension
Now, let’s go ahead and start debugging!
Setting Breakpoints
Click the left gutter area at the line where you want to toggle a breakpoint.

Setting a breakpoint
Debugging Using Run Configurations
In PhpStorm, script execution capabilities are based on the ‘Run Configuration’ concept. See details in the PhpStorm on-line help:
PhpStorm enables using numerous run/debug configurations. Each run/debug configuration represents a named set of run/debug startup properties. When you perform run/debug operations with PhpStorm, you always start a process based on one of the existing configurations using its parameters.
PhpStorm comes with a number of pre-defined default run/debug configuration types for the various running and debugging issues.
PhpStorm features a dedicated ‘PHP Script’ run configuration for debugging command line scripts. Creating a run configuration from a PHP script context menu is as easy as a mouse click: just open the context menu and choose the ‘Create yourscriptname.php’ item if you need to specify a custom working directory or any script parameters.
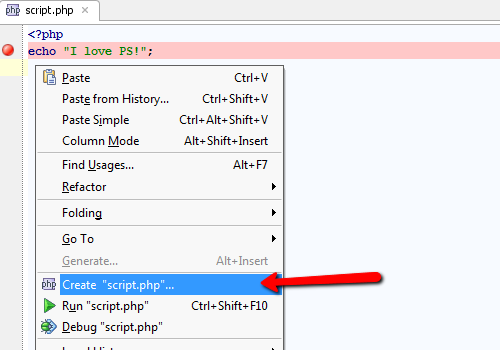
'Create script.php' context menu item
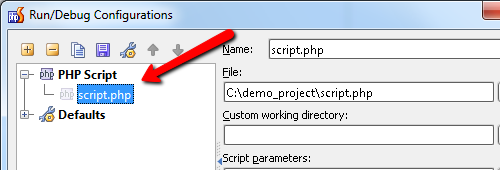
Specify the custom working directory, the script parameters or enable the ‘Break at the first line’ debug mode (all these settings are optional), and click ‘OK’.
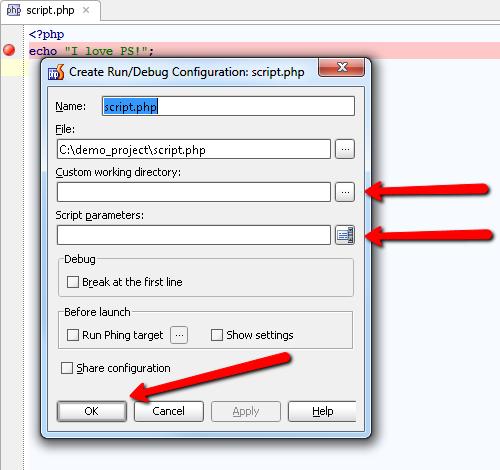
'PHP Script' run configuration settings editor
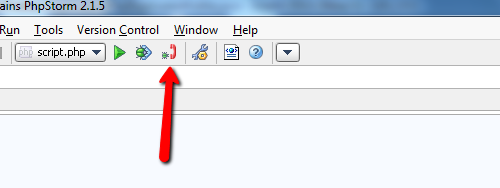
The new run configuration is saved. To start debugging, click the ‘Debug’ button on the toolbar.

'Debug' action on toolbar
If you don’t need any additional settings, just choose the ‘Debug’ item (by default, the working directory is the parent directory of the script).
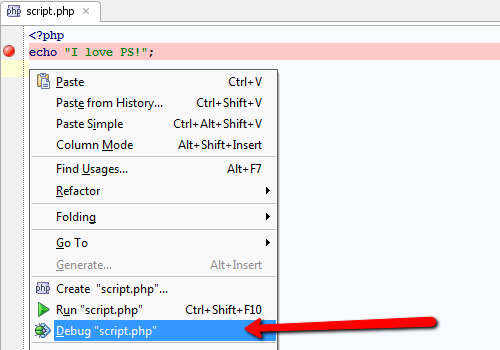
Debug 'Create script.php' context menu item
As soon as the script execution stops at the breakpoint, open the ‘Debugger’ tab in the ‘Debug’ tool window. Examine the values of variables in the current frame or add a new expression to the list of watches, if necessary.
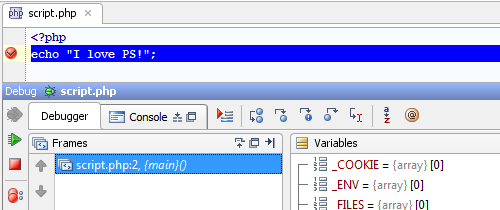
'Debugger' tab
The results of the script execution are displayed in the ‘Console’ tab of the в ‘Debug’ tool window.
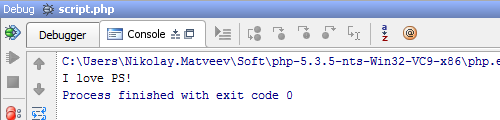
'Console' tab
To customize an existing run configuration or create a new one manually, choose ‘Edit Configurations’ from the run configurations pop-up menu.
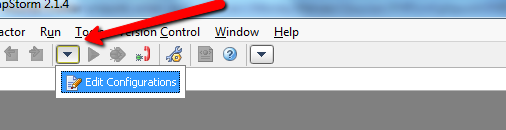
'Edit Configurations' menu item
Add a new ‘PHP Script’ run configuration.
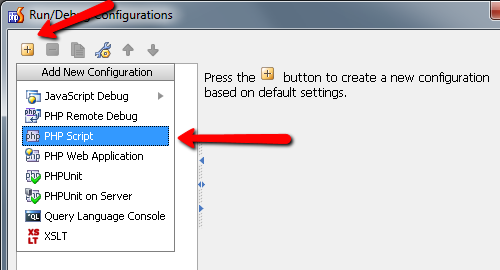
'PHP Script' item in 'Add New Confiuguration' popup menu
Or edit the existing one.
Debug using ‘listen debug connections’ button
Many of you have been fond of debugging scripts on the server using the ‘Start Listen PHP Debug Connections’ button.
'Start Listen PHP Debug connections' button
Unfortunately, PhpStorm 2.1 does not support this mode for debugging CLI scripts and displays the following warning:
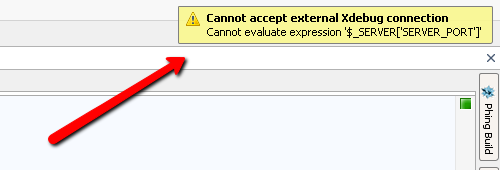
'Cannot accept external Xdebug connection' warning notification
The problem has been solved in PhpStorm 3.0. So if you are keen on experimenting you can start using this CLI scripts debugging mode right now. We are happy to inform you that PhpStorm 3.0 EAP has been launched.
Troubleshooting
You may happen to get the following error message after script execution finishes: ‘Debug connection with Xdebug was not established’. This means that PhpStorm has not received an incoming connection from the debugger and the debug session has not been established. Most likely, the PHP interpreter is not configured correctly, for example, no debug extension is installed at all.

'Debug connection with Xdebug was not established' error notification
Develop with pleasure!
