Code Coverage for JavaScript Unit Testing

Measuring JavaScript code coverage naturally complements unit testing. It provides a clear picture of which parts of your code remain untested, and helps you focus additional tests on the uncovered code.
From now on, users of JsTestDriver can measure code coverage visually, right in the editor.
To illustrate this, we have created a sample project for you. Please download percentage-sample.zip , extract it and open the project in your IDE.
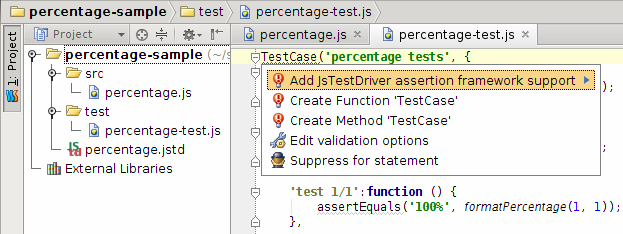
When you open percentage-test.js for the first time, you will see error highlighting on the TestCase method call expression. Position the caret on the error-highlighted code, press Alt+Enter/Option+Enter and choose “Add JsTestDriver assertion framework support” from the list of available intention actions.
A global JavaScript library named “JsTestDriver Assertion Framework” will be created and associated with a project. To view it, open the Settings dialog (File | Settings or IntelliJ IDEA | Preferences) and select JavaScript Libraries.
Before you can run any of your tests, you need to start the test server and capture at least one slave browser. The server does not have to reside on the machine where the test runner is located; similarly, the browsers themselves may be located on different machines.
Starting JsTestDriver server locally
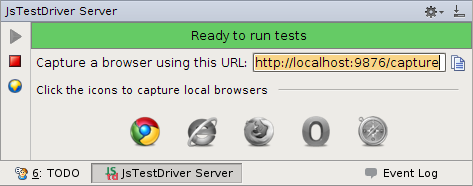
To launch the JsTestDriver server, look for the tool window at the bottom of the screen.
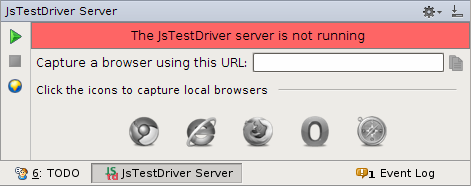
Click the green arrow to the left of the address bar to start a local server. The status bar turns yellow to let you know the server is running, but has no slave browsers.
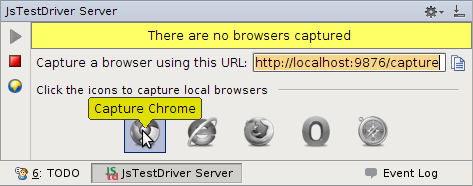
Click the browser icon you want to capture. Alternatively, you can copy the capture URL and paste it in a browser. The status bar turns green, and the corresponding browser icon lights up. Now you’re ready to run tests.
Running tests with code coverage
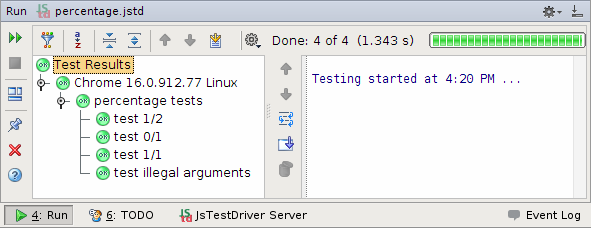
To run tests, right-click percentage.jstd and choose Run ‘percentage.jstd’ with Coverage. Tests will be run against the local JsTestDriver server and you will get a tree diagram.
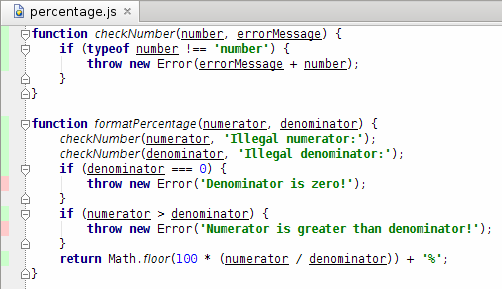
It also shows which lines were exercised by your unittests, and which weren’t, in two places. First, in your source files, it adds a green bar (exercised) or red bar (omitted) to the left of the source lines:
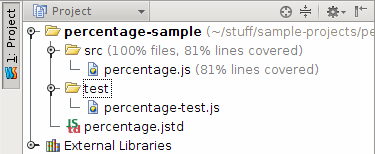
You can also see test coverage statistics by file and by directory in your Project View:
Excluding files from code coverage
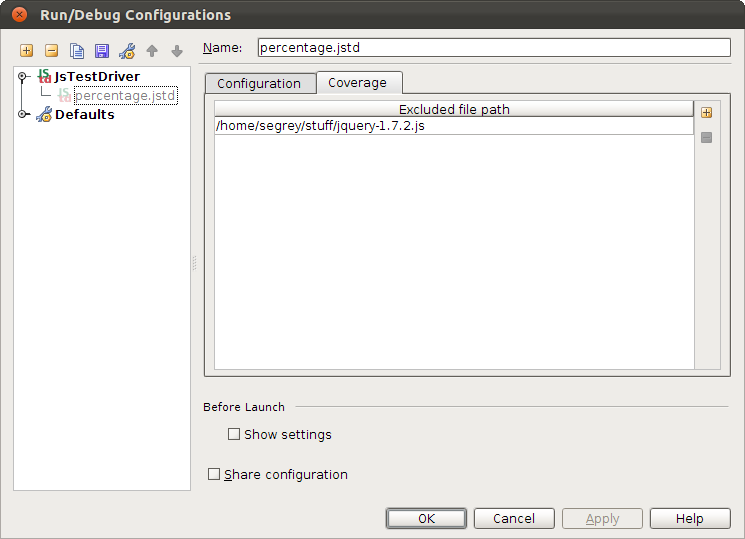
If you use a JavaScript library in your code (e.g. jQuery), you don’t need to measure code coverage for library code. To exclude a JavaScript file from the coverage, open JsTestDriver Run Configuration you intend to run, select the Coverage tab, and add the file to the excluded file paths.
Download WebStorm for your platform from this WebStorm EAP page.
We’d appeciate to hear responses from you in our issue tracker ;).
Note: Users of PhpStorm, as well as other JetBrains IDE – IntelliJ IDEA, PyCharm, RubyMine, and AppCode – should install it from the plugin repository by following these instructions.
Test with pleasure!