Running and Debugging Node.js Application

Check out a newer blog post on debugging Node.js apps.
Let’s continue our series of posts and tutorials on Node.js development in WebStorm.
Our first post covered the basic WebStorm configuration for working with Node.js projects. Now let’s move on to running and debugging Node.js apps both locally and remotely.
Running Node.js app locally
WebStorm allows you to run Node.js application locally on your machine: you should create a Node.js Run/Debug configuration for the file you need to execute and click Run.
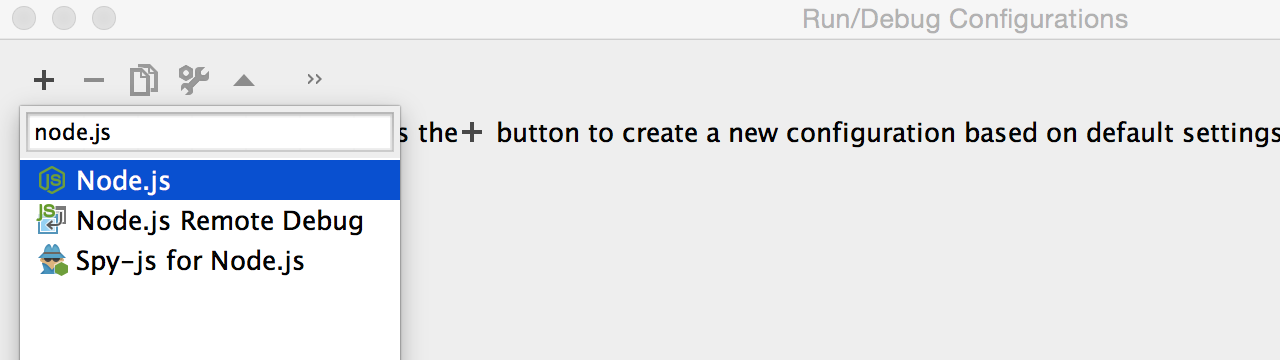
To create a new Run/Debug configuration, click Edit configurations in the top right corner of the IDE window, or in the main menu Run.
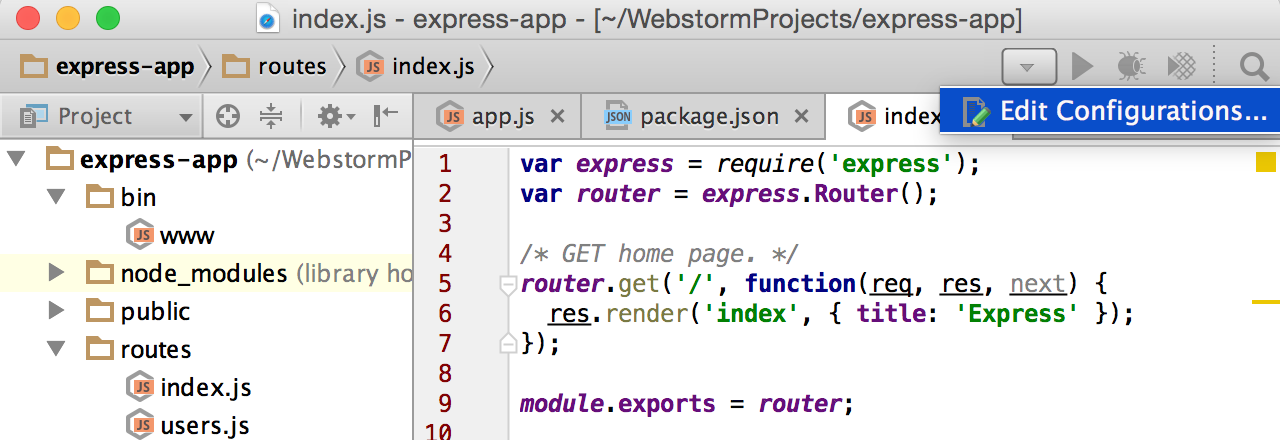
Click Add new configuration and seleсt Node.js type.
In this new Run/Debug configuration, specify the path to the JavaScript file that needs to be executed. For example, for a simple Express web app it should be a file that configures and starts the web server.
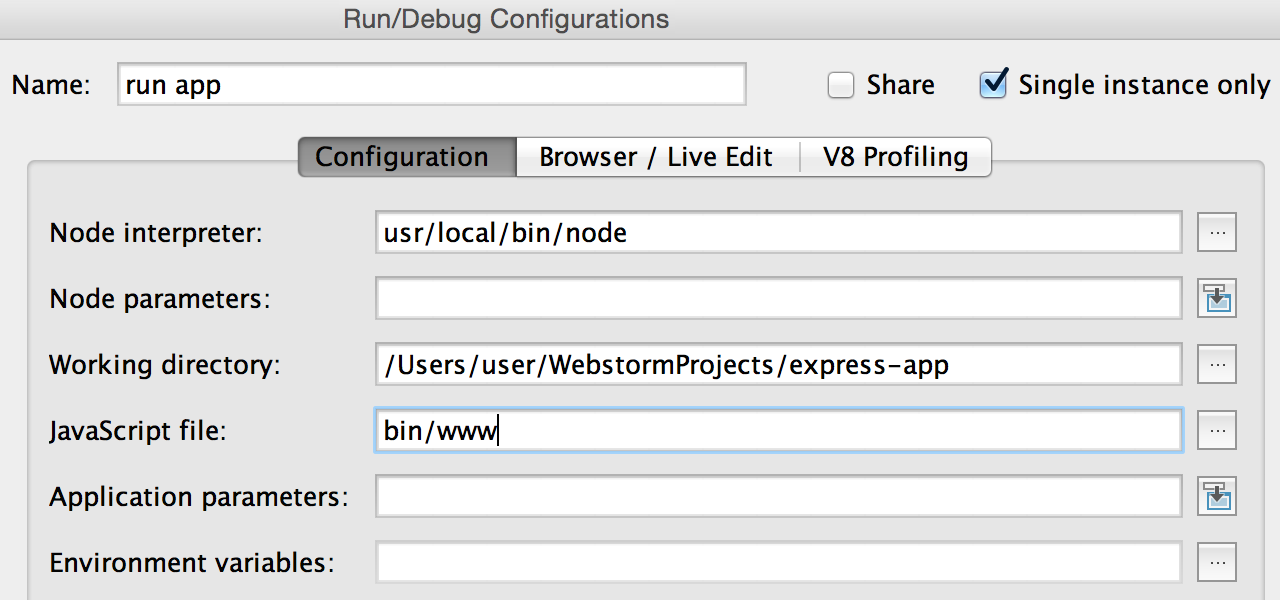
You can also add any parameters you need to pass to node (Node parameters input) or to your application (Application parameters input) on the start.
Update: Starting with Express 4.0 file www in bin folder needs to be executed to start the app. When creating a new Express web application in WebStorm, the required Run/Debug configuration will be created automatically.
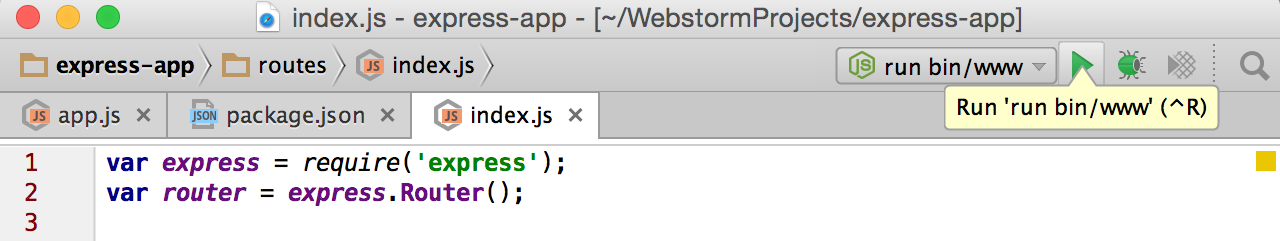
Select this new configuration and click Run. The Run tool window with console will appear showing the app execution log.
Debugging Node.js app locally
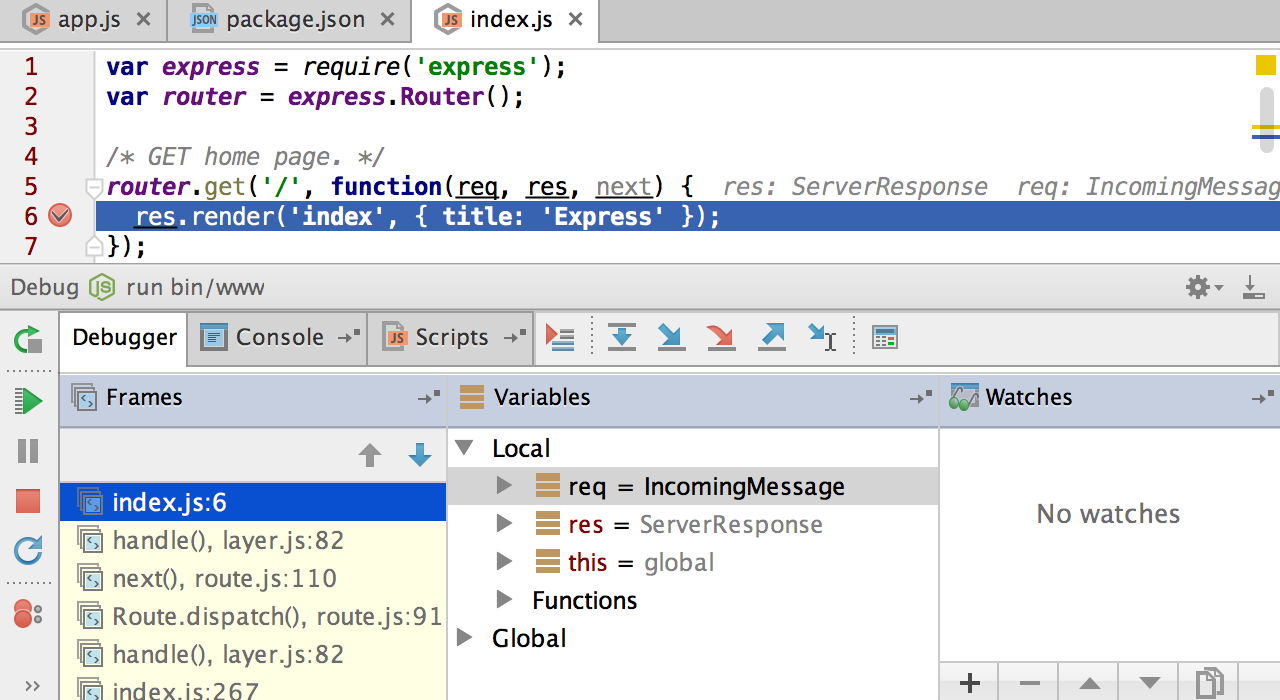
The same configuration can be used to debug your Node.js code. The built-in Node.js debugger allows you to step through the breakpoints, change values on the fly, evaluate expressions, and set watches.
Click the Debug button for the created Run/Debug configuration in the top right-hand corner of the IDE, from the Run menu or with the shortcut
(Shift+F9 on Windows or Linux, Ctrl+D on Mac). A tool window with variables view, frames and watchers for your debug session will appear:
Debugging Node.js app that runs remotely
With Remote Node.js Debug configuration you can debug Node.js apps that are running remotely. You’ll be able to restart the debug session without restarting the app itself.
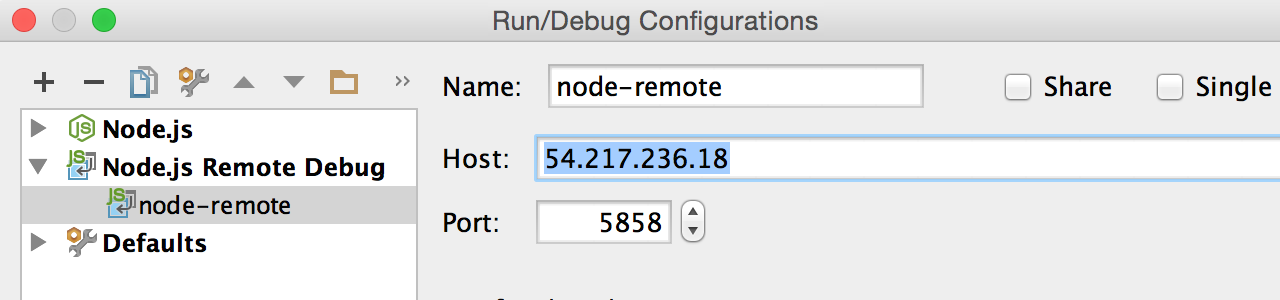
Select Remote Node.js Debug type when creating a new debug configuration, then specify the host you need to connect to and the port.
Now that the debug configuration is ready, select it from the drop-down list of configurations on the right and click Debug.
You’ll see the Debug tool window when the breakpoint is reached. You’ll be able to use full-featured debugger in the same way as if you were debugging your code locally.
Please note that for remote debug your app should be running with --debug= or --debug-brk= parameter.
Have a look at the previous post on Node.js development in our blog: “Getting started with Node.js in WebStorm”.
Develop with pleasure!
-JetBrains WebStorm Team