Debugging React Apps Created With Create React App in WebStorm

Note: This post was updated in June, 2021.
The create-react-app package can help us bootstrap a new React app with a ready-to-use development environment that uses Webpack, Babel, ESLint, and other tools. In this post, you’ll learn how to start the process of debugging a React application that is running on the localhost.
- Generate an application with create-react-app
- Set breakpoints in your code
- Run the application in development mode
- Launch a debugging session
- Examine the suspended application
- Known limitations
If you have never used the JavaScript debugger in WebStorm before, we recommend watching this video first to learn how to get started. The same principles you learn there can be applied to our other IDEs, including IntelliJ IDEA, PhpStorm, and PyCharm.
Generate an application with create-react-app
With WebStorm, you don’t have to download create-react-app in advance – during the project generation stage, the IDE can download and run it using npx.
Select File | New Project from the main menu, then, in the New Project dialog, select React as the project type, and specify the application name (blog_react) and a parent folder for it (WS).

When you click Create, WebStorm downloads and runs create-react-app, which generates an app with a React-specific structure, and downloads all the required dependencies.
Learn more about Creating a new React application.
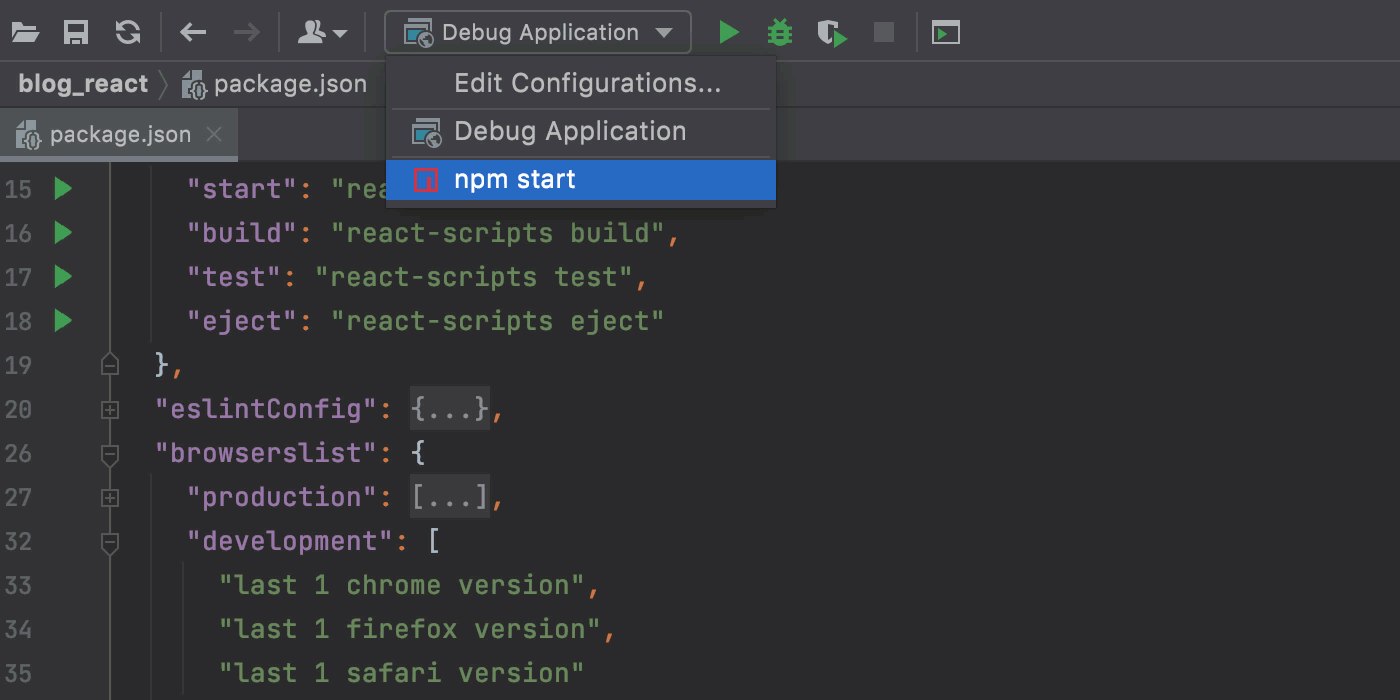
You do not need to define any run/debug configurations yourself, as WebStorm has already created two default ones for you:
- npm start, to launch your app in development mode.
- Debug Application, to debug your app.
Set breakpoints in your code
WebStorm recognizes line breakpoints, exception breakpoints, and conditional breakpoints. To set a line breakpoint, click the gutter next to the executable line of code where you want the application to suspend. To remove a breakpoint, just click on it.

Run the application in development mode
You can do this in several ways:
- Open the built-in terminal and type npm run start.
- Double-click the start task in the npm tool window.

- Open your package.json file, click on the Run Script gutter icon next to the start script, and select Run ‘npm start’ from the list.

- Select the npm start run/debug configuration from the list on the toolbar and click on the Run button next to the list.
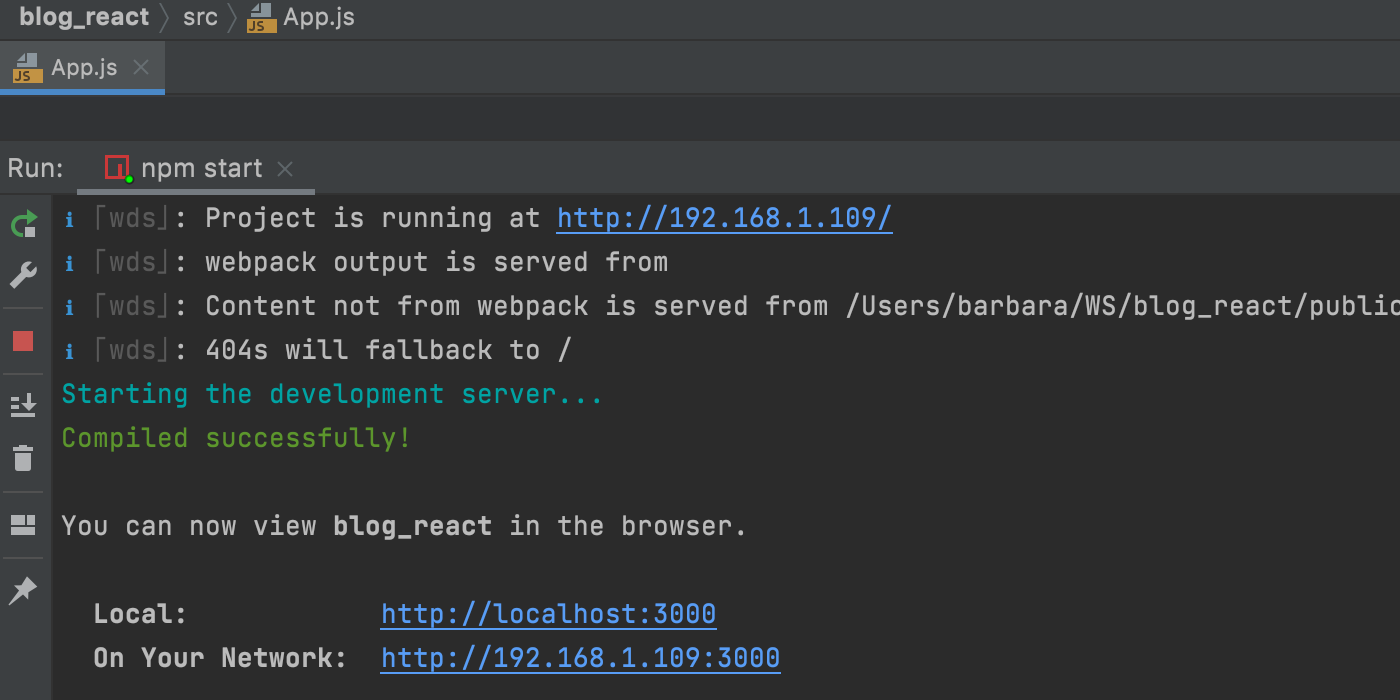
No matter which method you use, WebStorm launches the predefined npm start run/debug configuration. When the app is compiled and the Webpack dev server is ready, the Run tool window shows that the app is running in the browser at http://localhost:3000/.
Note that when the dev server is running, the app will automatically reload if you change any of the source files.
Launch a debugging session
You can now start debugging your app right from the Run tool window! Just hold Ctrl+Shift / ⌘⇧ and click the URL address where the application is running. WebStorm launches the auto generated Debug Application run/debug configuration, the browser opens at http://localhost:3000/, and the Debug tool window appears showing you the call stack and variables.

Of course, you can also select the Debug Application run/debug configuration from the list on the toolbar and click the Debug button next to the list of configurations in the top right-hand corner of the IDE.
Examine the suspended application
Once a breakpoint is hit, WebStorm opens the Debug tool window, where you can explore the call stack and variables, step through the code, set watchers, evaluate variables, and do all the other things that you can normally do when debugging. You can consult the Examine suspended program and Step through the program docs to learn more about this process.

Known limitations
- The breakpoints that are put in the code and executed on page load might not be hit when you open an app under a debug session for the first time. This is because the IDE needs to get the source maps from the browsers to be able to stop on a breakpoint you’ve placed in the original source, and that only happens after the page has been fully loaded at least once. As a workaround, you can reload the page in the browser.
- Webpack in create-react-app generates source maps of the type cheap-module-source-map. This kind of source map doesn’t guarantee the most precise debugging experience. We recommend that you use devtool: ‘source-map’. To make changes to the app’s Webpack configuration, ‘eject’ the app (refer to the create-react-app manual to learn more).
If you have any problems debugging your application, please contact our support team. Please share information about your IDE version, the breakpoint locations and, if possible, your project.
More on using React in WebStorm:
- Working with ReactJS in WebStorm: coding assistance
- Working with ReactJS in WebStorm: linting, refactoring, and compiling
- Developing mobile apps with React Native
The WebStorm team