WebStorm Team
WebStorm 2018.2 EAP, 182.2949: JavaScript coverage
The fourth WebStorm 2018.2 Early Access build is now available!
Toolbox App is the easiest way to get EAP builds. You can also get notifications right in the IDE when a new EAP build is available: simply go to Preferences | Appearance & Behavior | System Settings | Updates and select “Automatically check updates for Early Access Program”.
If you’re not yet familiar with our Early Access Programs, or if you want to find out what features were added in WebStorm 2018.2 EAP, check out this page.
Here are some of the highlights of WebStorm 2018.2 EAP #4 (182.2949.6).
JavaScript Code Coverage
You can now find unused JavaScript (or TypeScript) code in your client-side app thanks to the new Code Coverage feature.
Run your app in the browser and then see the report in WebStorm showing how much code in every file and folder was used.
The great thing is that the coverage will be shown for your source files and not for the compiled code that was actually run in the browser (as long as the source maps are available).
Here’s how it works:
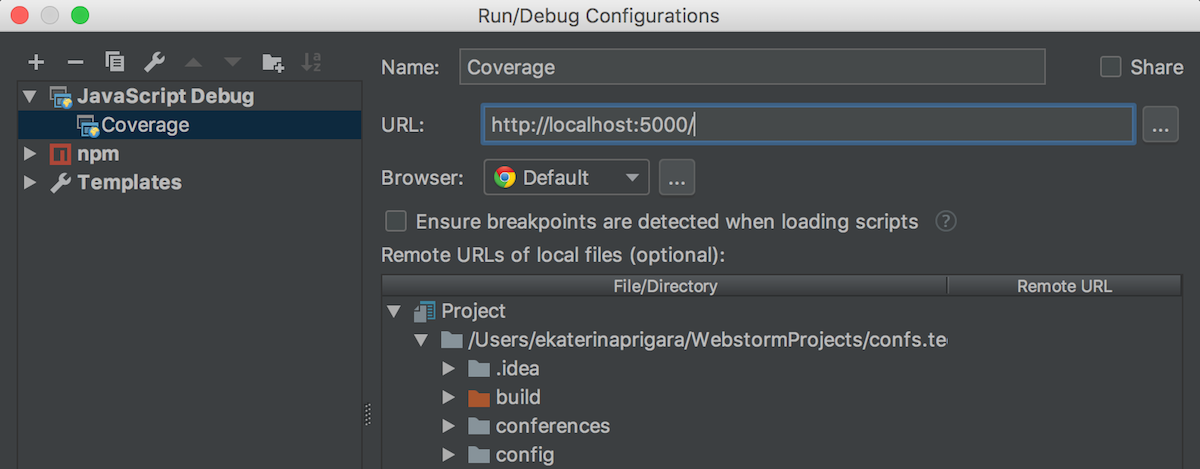
- Create a new JavaScript debug configuration by selecting Run – Edit configurations…
- Specify the URL your app is running on and save the configuration.

- Now click Run with Coverage.

- Once your app opens in Chrome, wait till the page is loaded if you want to know what code was executed during the page load, and then stop the configuration in the IDE. If you want to see the coverage report for some specific features of your app, use these features in the browser and then stop the configuration.
The coverage report will now open in the Coverage tool window: look at the Project view for info about the coverage of files and folders. Meanwhile, if you look at the left gutter in the editor, you will see green and red markers next to some lines. Green means that the line was executed, and red means it was not. And if you click on the market, you’ll see how many times this particular block of code was executed.

In the example above, we see that the togglePast method is marked with red because we haven’t clicked the link that shows the past events.
Update: The coverage report now also includes CSS files, but only in the project that doesn’t use webpack. Unfortunately, the coverage for the Sass, SCSS and Less files is not supported right now.
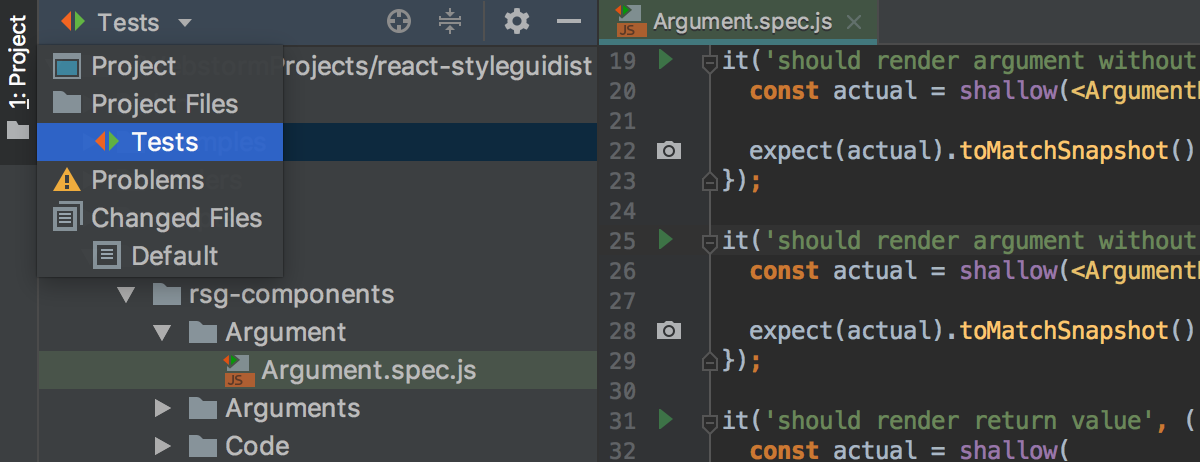
Test files in the Tests scope
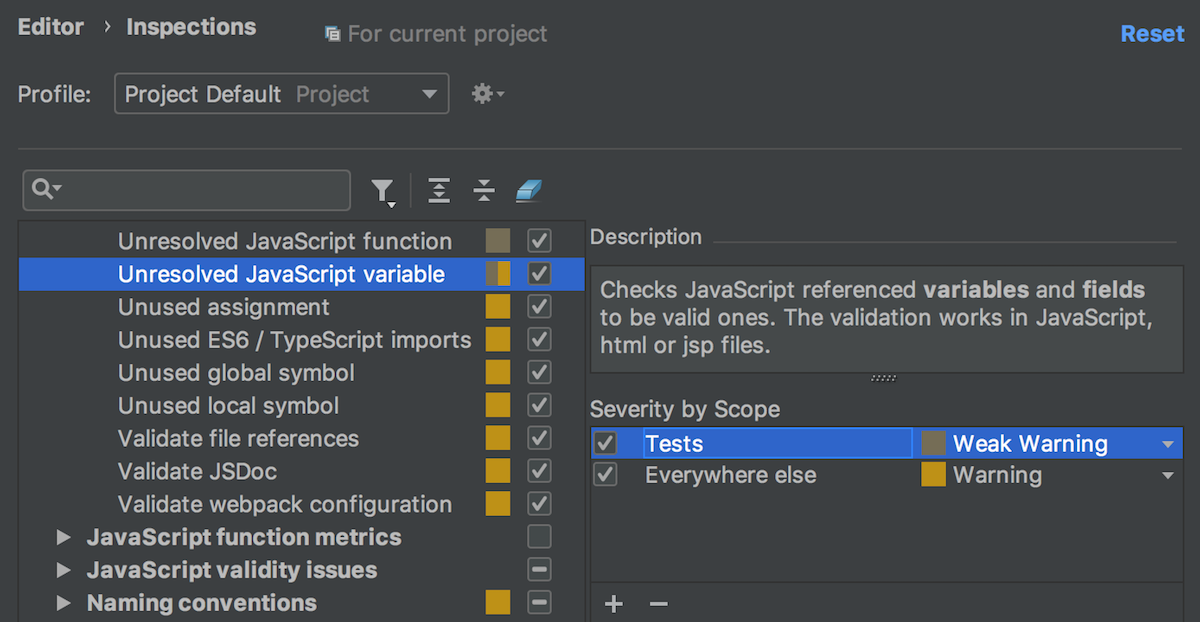
Now, test files whose names follow common patterns like *.test.js or *.spec.js are now automatically added to the default Tests scope. You can select this scope in the Project view to see the test files available in the project. Or you can use it to configure the use and severity of inspections.


