WebStorm 2019.1: smart intentions for JavaScript, improvements in Angular support, updated CSS and HTML docs, and new debug console
⭐️WebStorm 2019.1 is now available!⭐️
WebStorm 2019.1 brings with it new smart intentions for JavaScript and TypeScript, improved support for Angular, updated documentation for CSS and HTML, a more powerful debug console, and much more!
Explore the top new features and download WebStorm 2019.1 on our website.
In this blog post we would like to share with you the detailed release notes for this WebStorm update. They are compiled from the EAP blog posts that we’ve been publishing here for the past several months.
Here are the features and improvements grouped by the WebStorm subsystems:
- JavaScript and TypeScript support: intentions for destructuring; convert function with Promise to async function; convert properties in constructor to class fields; inspections for switch statements; add or remove export; extended error messages in TypeScript.
- Style sheets support: updated docs for CSS and browser compatibility check; extract CSS variable; camel case support for CSS Modules; support for Less 3.0 features.
- HTML support: improved HTML documentation.
- Development with Angular: new inspections for Angular projects; easier navigation in Angular projects.
- Development with React: improved completion for merged props; Extract Method refactoring for custom React Hooks.
- Development with Vue.js: better support for Vue projects with TypeScript.
- Node.js and npm: completion for npm scripts; version range tooltip for dependencies; run and debug Node.js app when using Docker Compose; simple Node.js project template.
- Linters integrations: improved support for ESLint and TSLint in complex projects; support for TSLint as TypeScript plugin.
- Debugging: new debugger console.
- Testing: highlighting for failed line in test; testing with Cucumber and TypeScript.
- IDE improvements: Recent Locations popup; save project as a template; soft-wraps for selected file types.
- Version Control: cherry-pick a file from a commit from the VCS log; incoming and outgoing commits.
JavaScript and TypeScript support
Destructuring in JavaScript and TypeScript
With destructuring, you can unpack values from arrays and objects into variables. This feature has a very concise syntax that is often used when you need to pass data in your app.
If you’re not yet familiar with destructuring, we recommend reading the great overview in the book Exploring ES6.
To help you start using destructuring in your code, WebStorm 2019.1 adds a set of new refactorings and intentions that can introduce destructuring to your code. Let’s see how they can be used when working with objects and arrays.
If you have a piece of code in which you are getting multiple values out of an array or an object, you can now simplify it by using the new Replace with object or array destructuring intention (Alt-Enter):
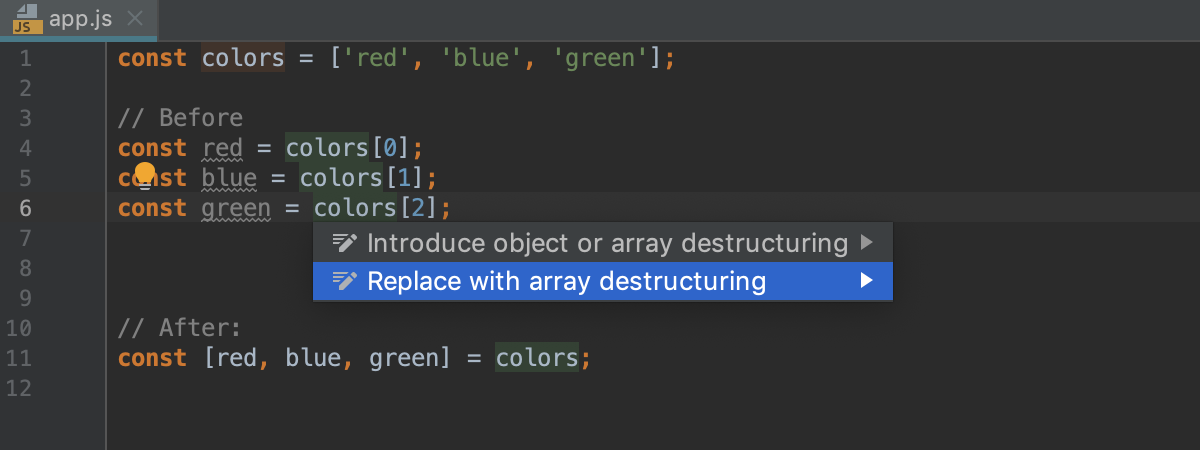
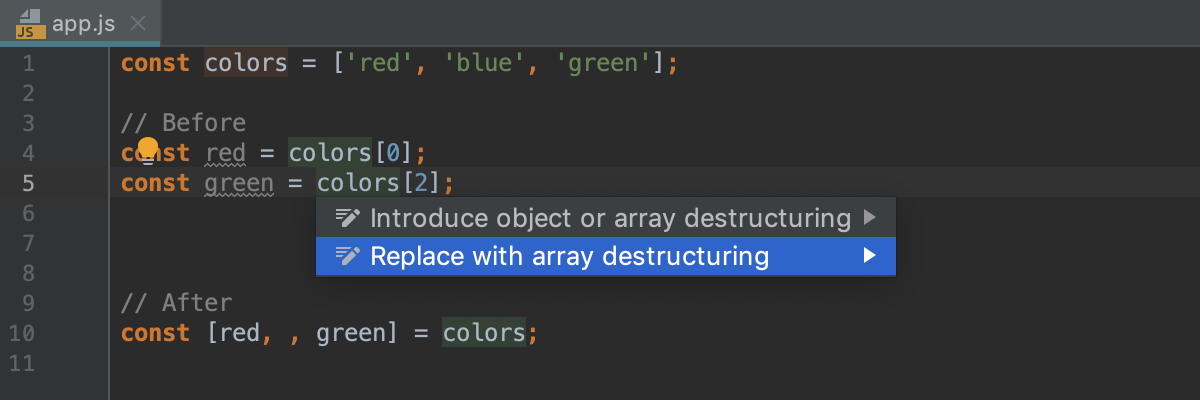
If not all values from the array or object are used, the resulting destructuring will skip the elements:
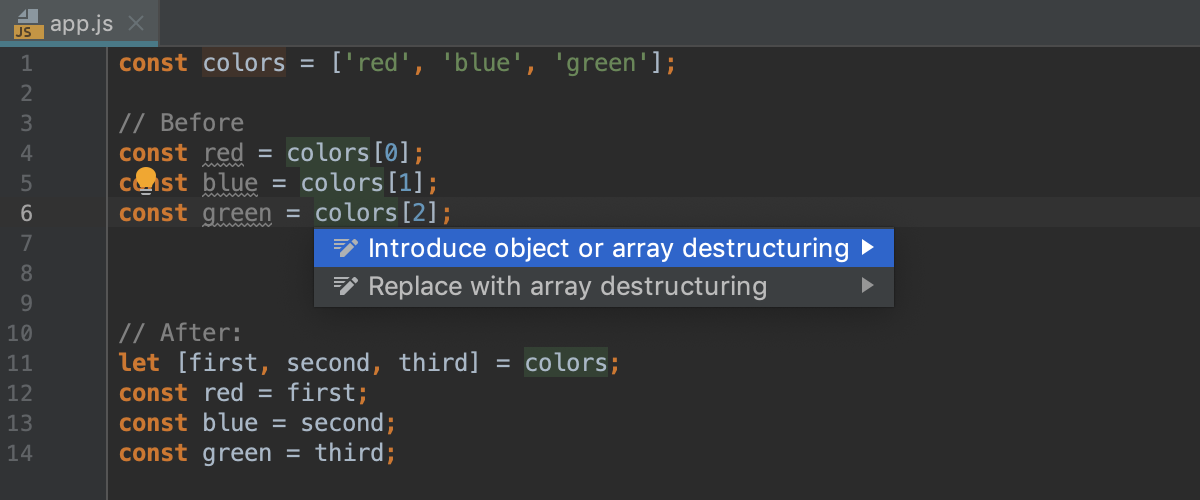
If you want to keep the original assignments, you can use the Introduce object or array destructuring intention (Alt-Enter), or go with the Extract object or array destructuring refactoring:
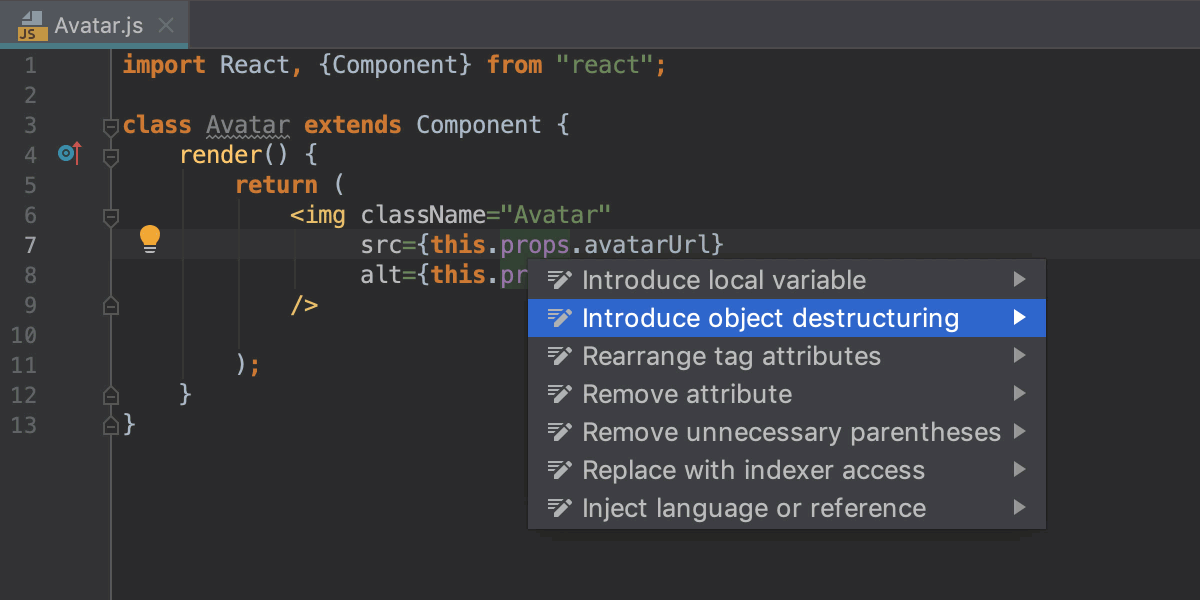
This intention can be very handy when working with React class components:
Some other IDE actions now also default to destructuring. For example, the Insert ‘require()’ quick-fix that works in Node.js apps with CommonJS modules now uses destructuring:

There’s also a new Convert parameters to object action (Alt-Enter) that generates a destructuring parameter for a function:

Convert Promise to async/await
With this new intention in the IDE, you can automatically change a function that returns a promise with .then() and .catch() calls to an async function that uses the async/await syntax – not only in TypeScript files, but also in JavaScript and Flow.
Simply press Alt-Enter on the name of the function and select Convert to async function. Voila!

WebStorm will introduce a new variable and replace Promise.catch with the try-catch block:
// Before:
function getProcessedData(url) {
    return downloadData(url)
        .then(v => {
            return processDataInWorker(v);
        })
        .catch(e => {
            alert("Please try again later");
        });
}
// After
async function getProcessedData(url) {
    try {
        let v = await downloadData(url);
        return processDataInWorker(v);
    } catch (e) {
        alert("Please try again later");
    }
}
In this example, WebStorm knows that `fetch` returns a promise and suggests converting the download function to async:
// Before:
function download() {
    return fetch('https://jetbrains.com').then( result => result.ok)
}
// After:
async function download() {
    let result = await fetch('https://jetbrains.com');
    return await result.ok;
}
Convert properties in constructor to class fields
With this handy new intention (Alt-Enter), you can replace properties defined in a constructor with class fields:
// Before:
class Point {
    constructor() {
        this.x = 0;
        this.y = 0;
    }
}
// After:
class Point {
    x = 0;
    y = 0;
    constructor() {
    }
}

New inspections for switch statements
WebStorm 2018.2 added an intention which generated cases for ‘switch’. But what if you edited your code and are now missing a new case inside the switch statement? Or there’s a missing default? Or what if some branches are unreachable? The IDE can now help with that too. We’ve added a bunch of improvements which may be truly beneficial to handling switch statements in JavaScript and TypeScript.
There’s now code completion inside switch that suggests cases based on the available data about the parameter (when it is a TypeScript enum or when its type is specified in JSDoc as a list of string values).

The new inspection will check that all the cases are covered and if any are missing, the intention to create them can be used.

If there’s an empty switch statement, the IDE will suggest that you remove it. You can unwrap a switch that only has a default clause.
The IDE will now warn you about any unreachable branches and provide a quick fix to remove them.
Another new inspection will help you avoid the situation when a variable is declared in one case and then used in another.

The last new inspection will warn you if the type of switch parameter is not strictly enumerable and there is no default clause.

Note that this one is set to the “Don’t show, quick fix only” severity level by default, i.e., it provides the quick fix on Alt-Enter, but it is not highlighted in the editor. To change the severity, navigate to Preferences | Editor | Inspections | JavaScript | General | ‘switch’ statement with no ‘default’ branch.
Add or remove export
With this new intention (Alt-Enter), you can quickly add export or export default for a class, variable, or function – and save a couple of seconds typing it. The Remove export action, as you may have already guessed, removes the export statement – but first it makes sure that the symbol is not used in some other files.

Extended error messages in TypeScript
Starting with TypeScript 3, some of the error messages have additional information with links to the related code that can help you to understand the cause of the problem. WebStorm now shows this extended info in its error tooltips, so you can click on the link to jump to the code.

Adding missing library to tsconfig.json
With TypeScript, you need to explicitly list standard libraries in the tsconfig.json file that TypeScript will include in the compilation, e.g. DOM, ES2015.Promise, etc. WebStorm can help you with that. Press Alt-Enter on the symbol defined in the unlisted library, and use a quick-fix to add the required libraries to tsconfig.json.

TypeScript 3.3 and 3.4
We have updated the bundled version of TypeScript to 3.3.
To get ready for the TypeScript 3.4 release, we’ve supported the new syntax features planned for this release.
Style sheets support
Updated docs for CSS and browser compatibility check
We’ve updated our documentation for CSS properties and pseudo-elements. Press F1 to see the brief description of the property and its values, as well as information about the supported browsers.
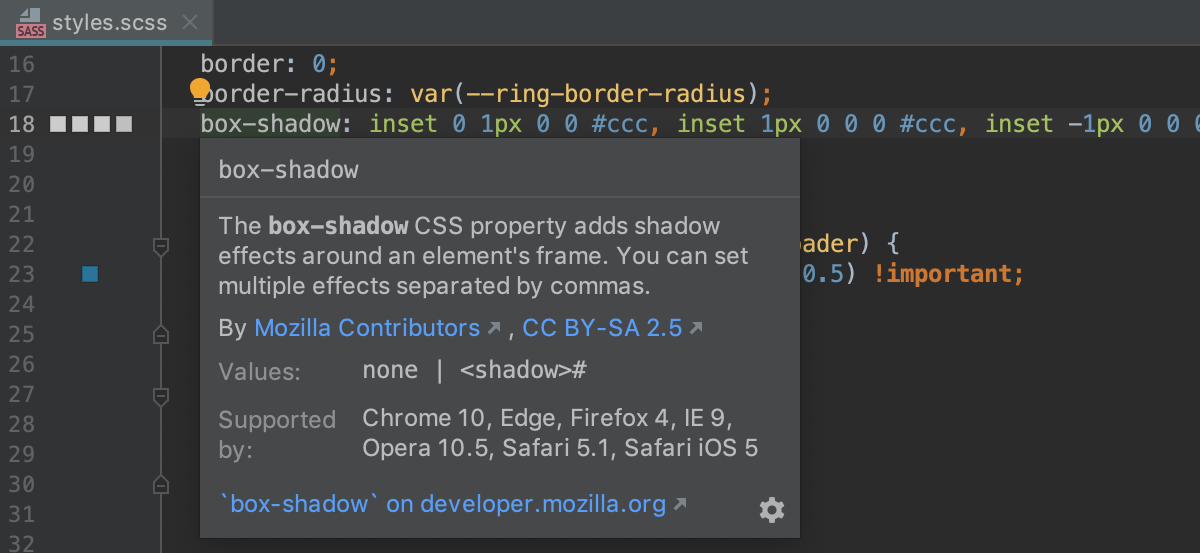
The description and browser compatibility data is loaded from MDN. You can quickly open the full article in the browser to see more details and examples – click the link at the bottom on the documentation popup, or press Shift-F1.
If you’re offline and the IDE can’t access developer.mozilla.org, WebStorm will show the property description from the bundled schemas that it uses for completion and validation. It might be different from the one available on MDN, but still useful.
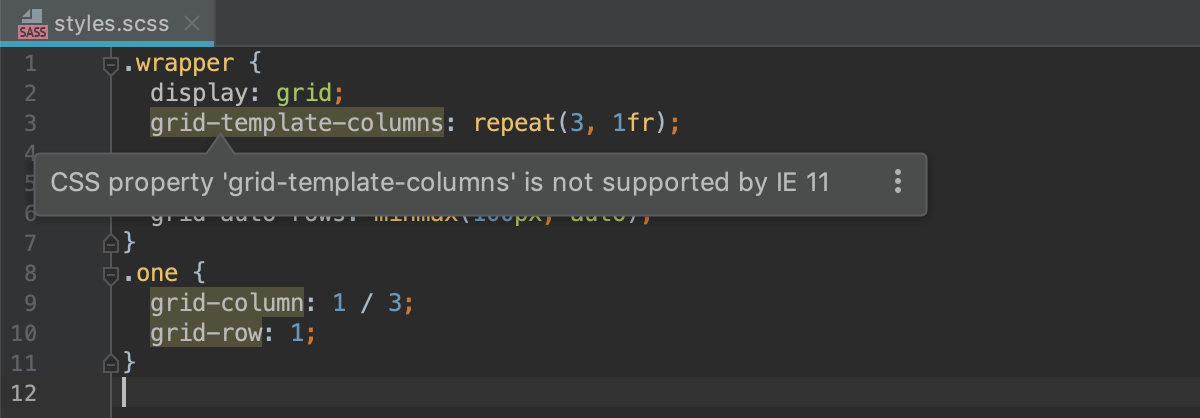
Now, when WebStorm knows what browsers support a specific CSS property (thanks to MDN Browser Compatibility Data), you can use a new compatibility inspection. Go to Preferences/Settings | Editor | Inspections – CSS and select “Browser compatibility”, then select the minimum browser versions you want to target. You will see a warning in the editor if a property is not supported in the target browser.
Extract CSS variable
With the new Extract CSS variable refactoring, it is now so much easier to introduce variables using the var(--var-name) syntax in your .css files.
Select the value you want to declare as a variable and press Alt-Cmd-V on macOS or Ctrl-Alt-V on Windows and Linux. Or, select Extract Variable in the Refactor menu. Then type the name and decide if you want to replace just one or all usages of this value in the current file.
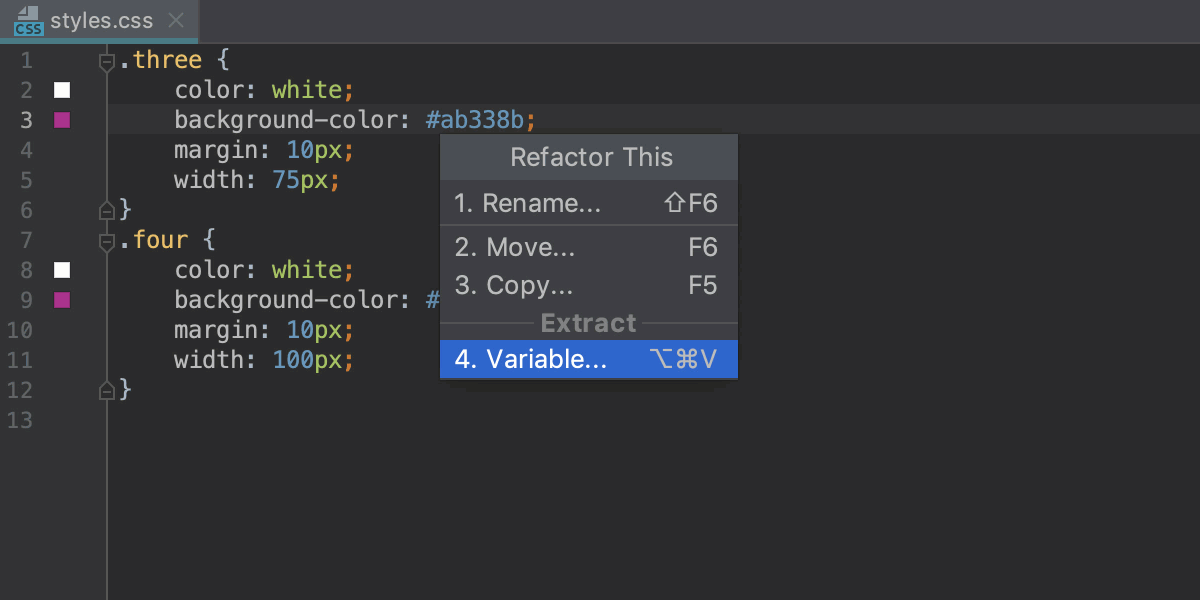
By the way, the color preview on the editor gutter now works for all usages of CSS variables.
Camel case support for CSS Modules
If you’re using CSS Modules in your project, code completion for classes in the JavaScript file will now suggest camel-cased versions of class names with dashes:

Support for Less 3.0 features
In Less files, we’ve added support for the Less 3.0 feature, properties as variables.
After typing $ as a value, you will now see suggestions for the property names used in this scope that can be used as variables:

WebStorm now also supports the if syntax in Less.
HTML support
Updated HTML documentation
We updated the HTML documentation to make it much more informative and useful. The quick documentation for a tag (Ctrl+Q on Windows and Linux or F1 on macOS) shows its short description from MDN including its compatibility with the most popular browsers: Chrome (+Android), Safari (+iOS), Firefox, IE, and Edge. (Note that if there’s no available information or if a tag is available in all browsers, then no browser info is shown.)

The docs for the attributes also show the MDN data:

If you want more information about the tag and examples of how it is used, then it is easy to consult the full MDN reference – press Shift+F1 or click the link and it will open in the browser.
Improvements in Pug
We’ve fixed a bunch of issues related to the use of JavaScript in Pug (ex-Jade) files: arrow functions are supported inside of Pug’s script tag and template strings are now also properly supported.

Development with Angular
New inspections for Angular projects
For Angular applications, we’ve added 17 new inspections that will help you detect Angular-specific errors in your app as you edit code. These inspections are going to replace the integration with the Angular language server that the IDE was running side by side with the TypeScript service. Our goal is to provide a better editing experience when working with both TypeScript and Angular template files, with more checks and quick-fixes available for them.
Here are a couple of examples:
The new inspection suggests to add a component to a module:

This inspection warns you that both template and templateUrl properties are used and suggests removing one:
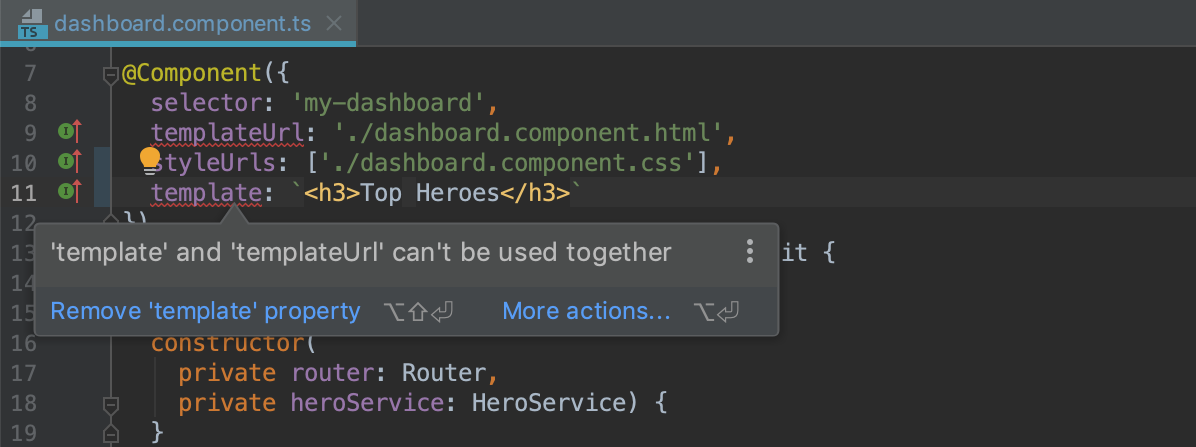
Here the inspection warns you about the incorrect use of structural directives:

To see the full list of inspections and configure them, go to Preferences/Settings | Editor | Inspections – Angular.
Easier navigation in Angular projects
We know that when working on Angular projects you always have to jump between the different component files such as TypeScript, template, and style files. There are many ways to do this: you can use the Navigation bar, or the Project view, or Go to File, or the Angular CLI QuickSwitch plugin…
We’ve decided to add one more – using the Related Symbol… popup. When you’re in one of the Angular component files, press Ctrl-Cmd-Up on macOS or Ctrl+Alt+Home on Windows and Linux to see the list of other related files. Then you can use the arrow keys to select the file you need and then press Enter to open it.

In the popup, you can also use the numbers associated with each file type: 1. The TypeScript file with the component class; 2. Template; 3. Tests; and 4. Styles. So Ctrl-Cmd-Up / Ctrl+Alt+Home and then 1 will take you to the TypeScript component file.
In the TypeScript file, the Related Symbol popup will also list all the symbols that were imported into this file (hence, the name).
Development with React
Improved completion for props
WebStorm now provides better code completion for React props merged using with the spread operator.
Extract Method now works for custom React Hooks
React Hooks have recently landed in the stable React version. One of the features that was immediately suggested to us was a refactoring for creating a custom React hook – and the Extract Method refactoring is perfect for this task!
We’ve implemented a couple of improvements, namely, allowed Extract Method to work with local functions and use destructuring for the return values.

So here’s how it works:
- Select the code you want to extract.
- Use Refactor this… (Ctrl-T on macOS or Ctrl+Shift+Alt+T on Windows and Linux) or Extract Method (Alt-Cmd-M / Ctrl+Alt+M).
- Select the scope where the extracted function should be defined.
- Name it.
Development with Vue.js
Better support for Vue projects with TypeScript
We have good news for all our Vue and TypeScript fans! WebStorm now uses the TypeScript language service together with its own TypeScript support, for any TypeScript code in .vue files. This means that you’ll now get more accurate type checking and type info, and you will be able to use the quick-fixes provided by the service. All the TypeScript errors in the current file will be listed in the TypeScript tool window at the bottom of the IDE window.
Node.js and npm
Completion for npm scripts
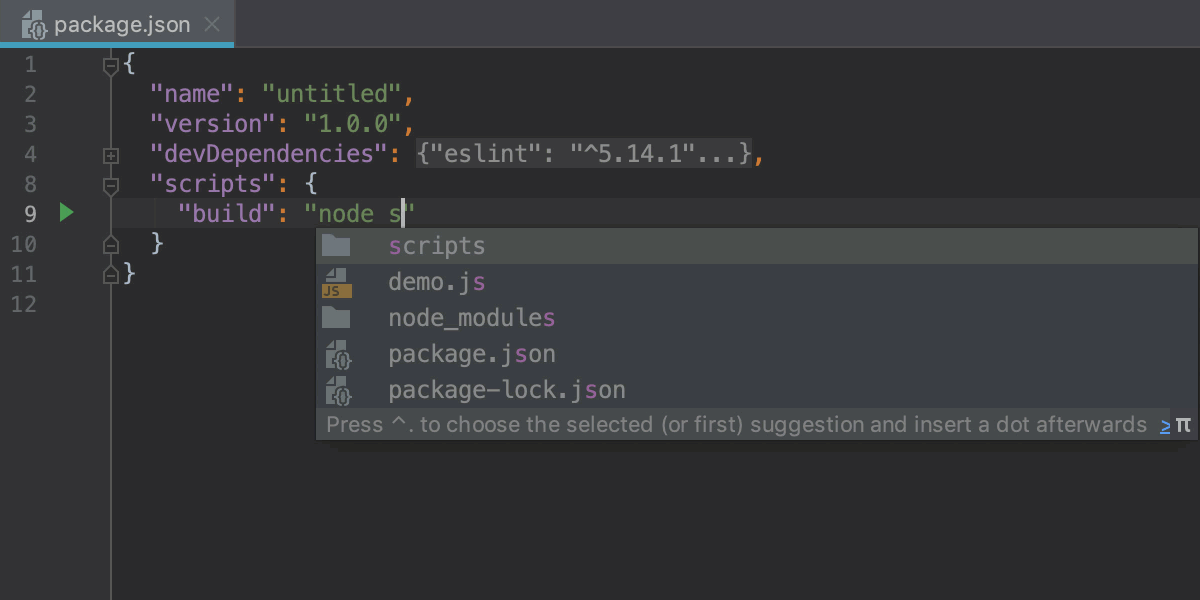
When adding new scripts to the package.json file, WebStorm now provides suggestions for available commands. You can see a list of commands provided by the installed packages (from the node_modules/.bin folder):

After typing node, the IDE will offer completion for folders and files that you can run. And after typing npm run, you’ll see a list of tasks defined in the current file. Cmd/Ctrl-click on the task name will take you to its definition in the same file:
Version range tooltip for dependencies
Another improvement related to the package.json file is a new tooltip that shows what range of versions could be installed when running npm install or yarn install. Press Cmd/Ctrl and hover over the version to see the information.

Run and debug Node.js app when using Docker Compose
If you’re using Docker for testing your Node.js application, you can now use the configuration described in the Docker Compose file to easily run and debug the app from the IDE.
Please note that the described steps only work if you use node or npm in the command field of your Docker Compose file to run your app, e.g. command: node ./src/app.js
- Create a new Node.js run/debug configuration using the Edit Configurations… action in the Run menu.
- Click the … icon next to the Node.js interpreter field, then click + and select Add Remote…
-
In the dialog that opens, select Docker Compose. If you haven’t used Docker in WebStorm before, you need to configure the Docker connection – click the New… icon and select the connection option according to your OS as described in this doc.

- Set the path to the Docker Compose file and select the service you want to run.
- In the Node.js run/debug configuration, leave the JavaScript file field blank if you want WebStorm to use the command specified in your Docker Compose file. If you want to override it, you can use the fields in the configuration (JavaScript file, node, and app parameters…).
- Save the configuration.
Now you can use this configuration to run or debug your app – the IDE will deploy the app to the Docker container using the docker-compose up command and, if running in the debug mode, pass the debug flag to Node.js and attach to the debug process.
If you don’t use Docker Compose or want to have a closer look at the Docker support for Node.js in WebStorm, check out the blog post “Quick tour of WebStorm and Docker”.
Simple Node.js project template
To make it easier to start a simple Node.js app, we’ve added a new template called “Node.js”. You can choose this when you click Create New Project on the IDE Welcome screen.
This project generator runs the npm init command that adds a package.json file and enables code completion for Node.js core APIs.
Linters integrations
Improved support for ESLint and TSLint in complex projects
We have completely redesigned our integration with ESLint and TSLint to improve the way it works in monorepos (including projects managed by lerna and yarn workspaces) and projects with multiple linter configurations.
Before, WebStorm could run only one linter’s service per project. So if you had different linter versions with different configs in different parts of your project, still only one ESLint or TSLint process would run, resulting in some configs being ignored or some plugins working incorrectly.
Now, the IDE will start a separate process for every package.json that lists a linter (ESLint or TSLint) as a dependency, and it will process everything below it as if it were invoked with .bin/eslint **/*.js (in case of ESLint).
This behavior is on by default for all new projects.
To switch to the new mode in the existing projects, go to Preferences/Settings | Languages and Frameworks | JavaScript | Code Quality Tools | ESLint or TypeScript | TSLint and select Automatic ESLint/TSLint configuration.
If you need to run a globally installed linter, pass additional options to it, or add a custom rules directory, you configure all these additional options if you select Manual configuration.
Support for TSLint as TypeScript plugin
If you’re using TypeScript in your .vue files and want to lint the code inside the script tag using TSLint, you can now use the typescript-tslint-plugin plugin for TypeScript. With this, TSLint checks become part of the TypeScript language service, and you will be able to see all the TSLint errors next to the TypeScript errors in the IDE tool window and, of course, in the editor.
You can fix and suppress TSLint errors and warnings using the intentions available on Alt-Enter.
To start using it, first, install the plugin with npm install typescript-tslint-plugin and then enable it in the project’s tsconfig.json file:
{
  "compilerOptions": {
    "plugins": [
      { "name": "typescript-tslint-plugin" }
    ]
  }
}
By the way, you may also want to use typescript-tslint-plugin if you have enabled the TSLint rules that require type information (like “deprecation” or “prefer-readonly”) – that way these types of errors will be highlighted in the editor as you type.
Debugging
New debugger console
We have completely re-implemented the debugger console in the JavaScript and Node.js debug tool windows. This console shows you stack traces and everything that was logged in your code (e.g. using console.log()). You can use this interactive console to evaluate arbitrary JavaScript statements – just start typing them in the input at the bottom of the console panel.
Here are some of the new features and improvements that we’ve implemented. You can debug this demo file in WebStorm 2019.1 EAP to see all these features in action.
-
The objects are now nicely displayed using a tree view.

- Stack traces are now collapsed by default.
- Warnings (
console.warn()), errors (console.error()), and info (console.info()) messages now have different icons and background colors to make them easier to notice. -
You can filter out any type of log messages using the filter icon on the left side of the console panel.

-
You can now see the log messages styled using CSS and the
%cmarker.

- The log messages grouped together using
console.group()andconsole.groupEnd()are now displayed as a tree. -
If you’re using
console.groupCollapsed(), the output will be collapsed by default.

Testing
Highlighting for failed line in test
If you’ve run tests in WebStorm and some of them have failed, now you can see where the problem has occurred – right in the editor. The IDE will use the information from the stack trace and highlight the failed code. On hover, you’ll see the error message from the test runner. And you can immediately start debugging the test.
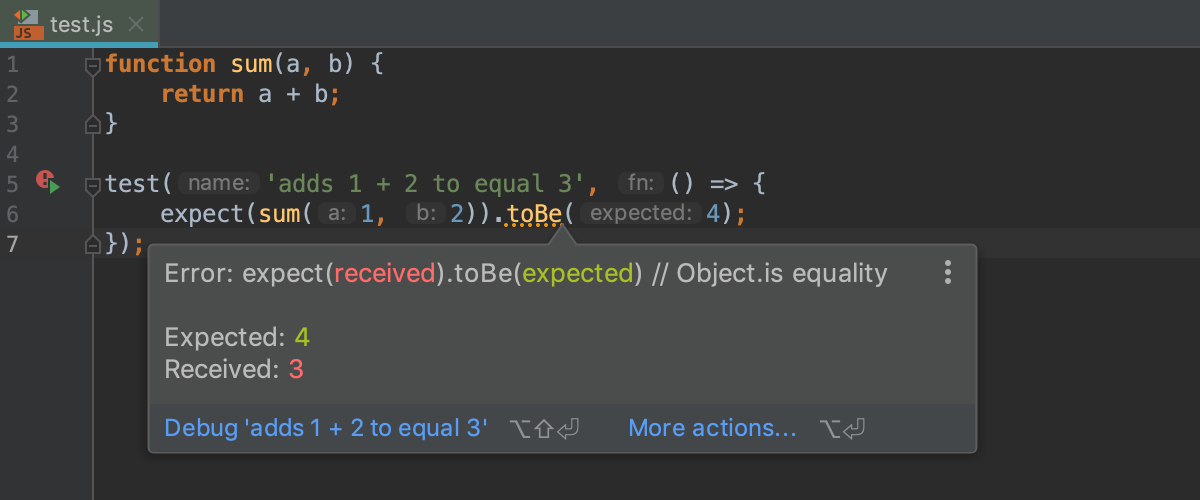
This works with Jest, Karma, Mocha, and Protractor.
Testing with Cucumber and TypeScript
If you’re using Cucumber and TypeScript, you will notice some major improvements in WebStorm 2019.1. First, you can now jump from the steps in the .feature file to their definitions in the TypeScript file. Second, you can generate missing definitions using a quick fix (Alt-Enter on the highlighted step).

Please note that at the moment WebStorm only supports step definitions that are written using regular expressions.
To run such tests in the IDE, use a Cucumber.js run/debug configuration and add Compile TypeScript as a Before launch task (if you don’t have any other build step set up for compiling TS): this way, the IDE will run a TypeScript compiler with the selected tsconfig.json file before running Cucumber.


If you want to debug these tests, don’t forget to enable source maps ("sourceMap": true) in your tsconfig.json file.
IDE improvements
New UI themes
You can now use the new colorful UI themes in WebStorm that are available as plugins. Choose between the Dark Purple, Gray, and Cyan Light themes, or create your own.

Recent Locations
WebStorm 2019.1 adds a new way to navigate around the project – the Recent Locations popup. It can be opened with Cmd-Shift-E on macOS or Ctrl+Shift+E on Windows and Linux.

It shows you the list of files and lines of code in them that you have recently opened in the editor (when navigating to the definition or usage, using the Go to action, or simply opening the file from the project view).
When the popup is open, start typing to filter the results and find the code you need (the search works for the code and file names). Of course, you can also just use the up and down arrows to select the required location.

If you want to only see the code fragments that have been changed, select the “Show only changed” checkbox.
Save project as a template
Do you have a project that you want to use as a template for other new projects? Now with the new action Save as a Template in the Tools menu you can create custom project templates.
To use the template, click Create New Project on the IDE Welcome Screen and simply select the template from the list.

All project settings in the .idea folder will be saved in the template. So if you want your new project to have some predefined run/debug configurations, check the Share checkbox in the configuration before you save the template.
Soft-wraps for selected file types
You can now enable soft-wraps in the editor for specific file types. To do that, open Preferences/Settings | Editor | General and specify the file types in the “Soft-wrap files” field:

With the soft wrapping on, the IDE will display long lines wrapped in the editor without actually adding line breaks.
Drag to add multiple cursors
If you want to add cursors at the same position on multiple lines, you now need to press Alt-Shift (instead of Alt), then press the mouse key and drag the cursor up or down. You can change the key combination in Preferences / Settings | Keymap: search for the Add rectangular selection action.
Version Control
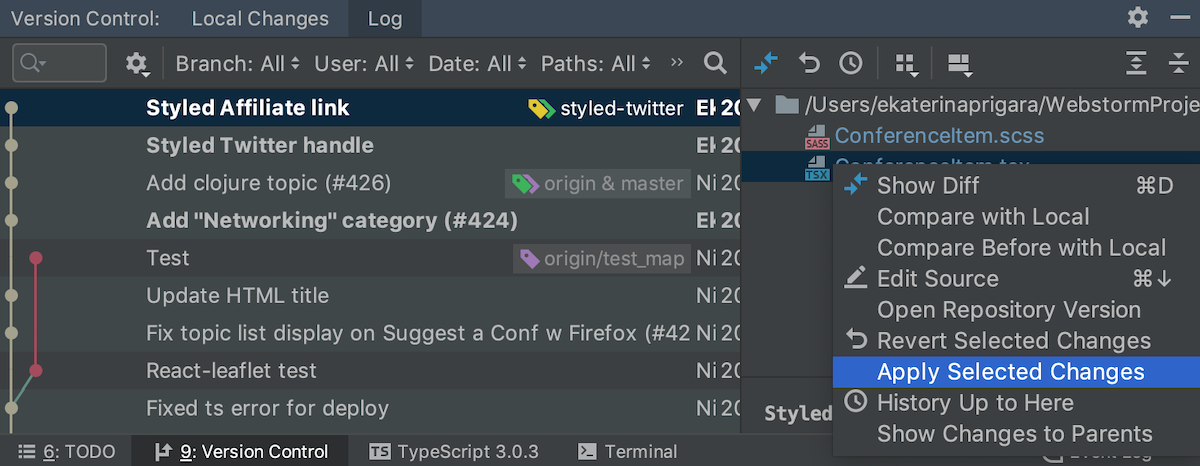
Cherry-pick a file from a commit from the VCS log
Now you can cherry-pick select files from a commit, right from the context menu in the VCS log:
Incoming and outgoing commits
The IDE now indicates if the incoming and outgoing commits are available for individual branches in the Branches popup. To see this info, open Preferences/Settings | Version Control | Git and enable the new option, Mark Branches that have incoming/outgoing commits in the Branches popup.
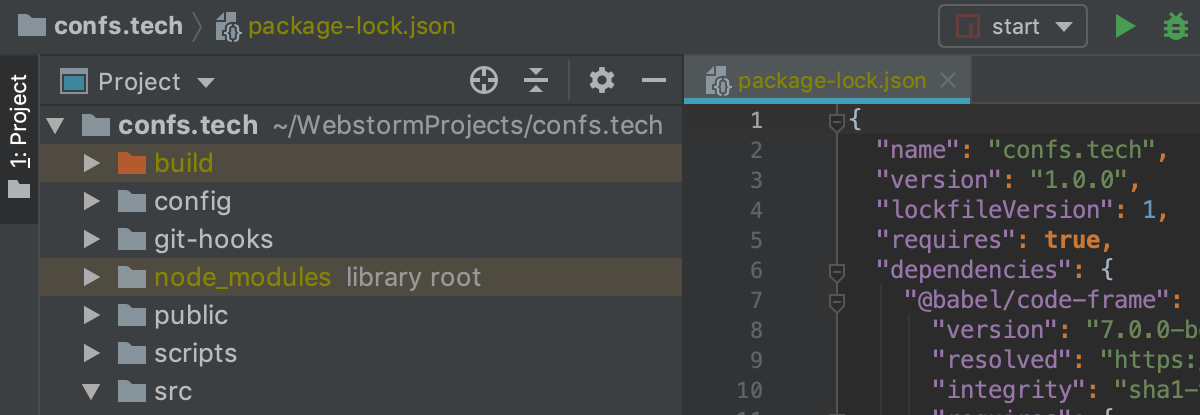
File status for ignored files and folders
In the Project view, the ignored files and folders now use olive-green so that it’s easier to distinguish them from other files. You can modify the color in Preferences/Settings | Version Control | File Status Color.
Your WebStorm Team


