WebStorm Fundamentals: Understanding the UI

The list of learning resources for WebStorm continues to grow! In addition to the recently launched learning plugin and the WebStorm Guide, we’re actively working on a series of videos that will help you understand the fundamentals of WebStorm. We’re happy to share the first video from this series! In this video, we take a look at the key UI elements of WebStorm and explain how they can help you handle specific tasks.
Below you’ll find the same information that is in the video. We’ve added it here for those of you who prefer reading instead of watching videos and to give you links to additional information.
Note: To make this video as up to date as possible, we used WebStorm 2020.2 EAP to record it. Version 2020.1 has neither the Inspections widget nor Problems tool window.
The editor is almost always the first thing you’ll notice when you open WebStorm. This is where you’ll be working with your code.
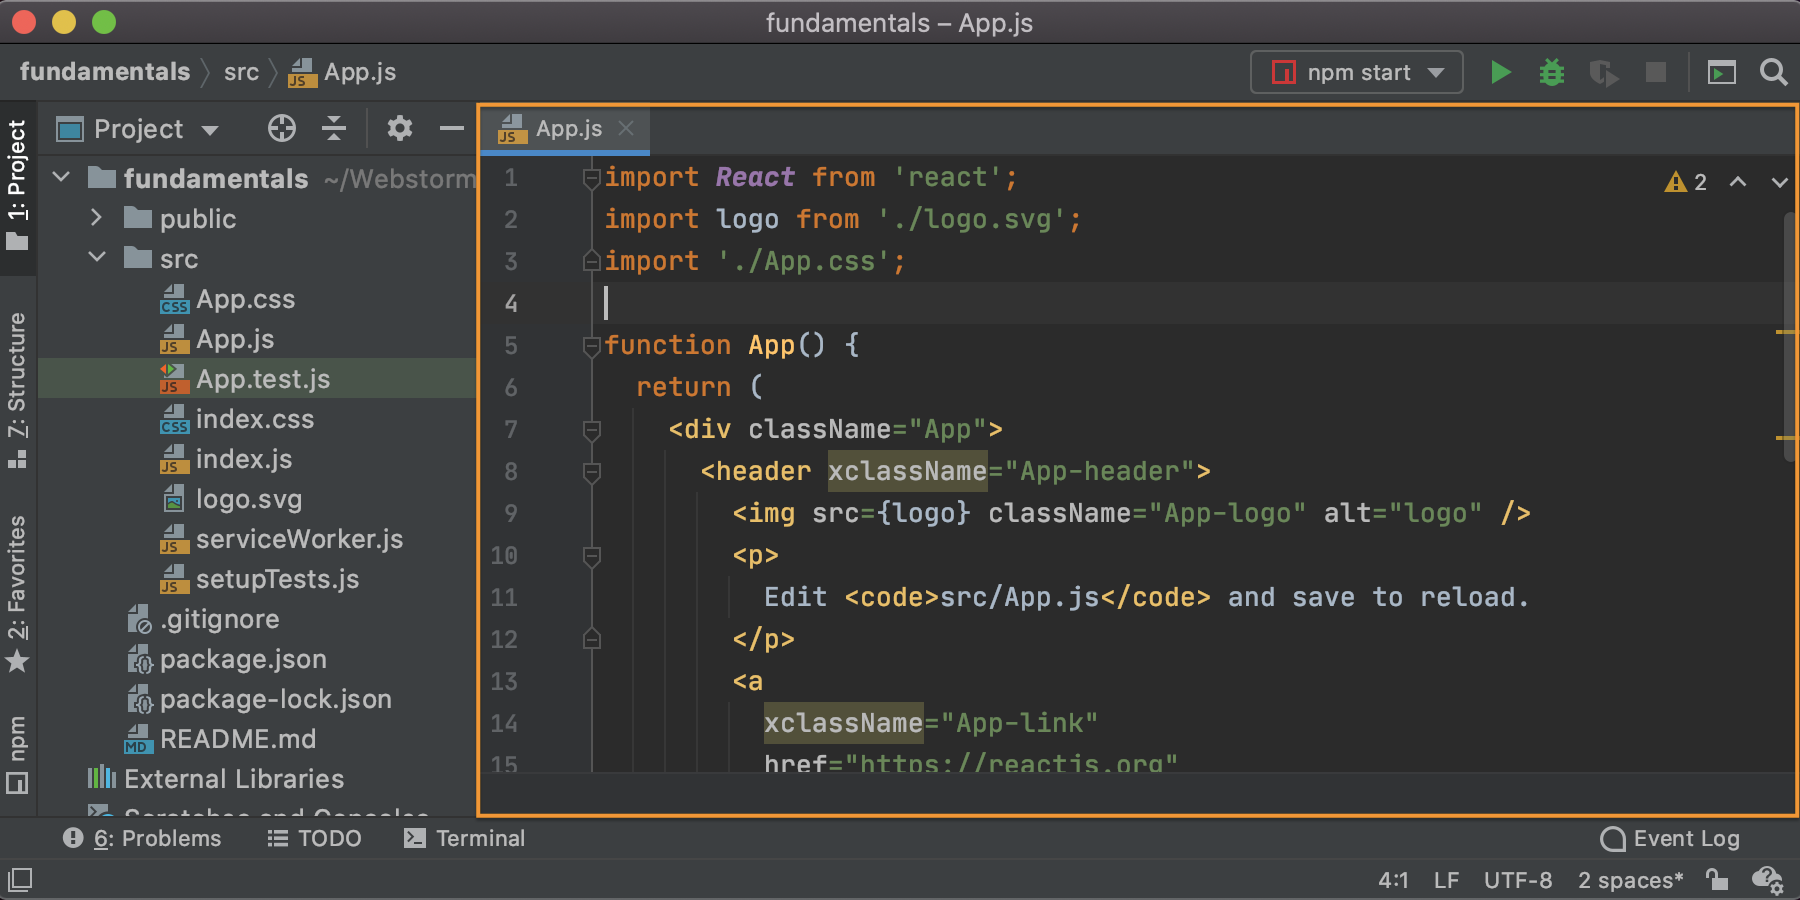
On the right-hand side of it, you can see the Inspections widget, which you can use to view all the issues found with the code in the current file and to navigate between them (using arrows or F2). If there are no code issues in the current file, you’ll get a green checkmark in the top right-hand corner of the editor.

On the left-hand side of the editor, you can find the gutter. It shows the line numbers and lets you perform several actions. For example, you can add or remove breakpoints by clicking the gutter.

By right-clicking anywhere in the editor pane, you can invoke the context menu, which shows the list of actions available in the current context. Simply select the action you want to use. For some of them, you’ll get popups that will let you click through to perform an action.

At the bottom of the editor pane, you can also see breadcrumbs. They show the symbols on the path to the current cursor location, leaving out symbols that are siblings. You can use these to navigate quickly through the source code.
Tool windows are another major part of the UI. All of them serve a specific purpose and have their own custom UI. For example, the Project tool window shows the structure of your project, while the Terminal tool window lets you work with the built-in terminal emulator.
At the very bottom of the IDE, you can find the status bar. It’s a small yet very handy piece of the UI. First of all, the quick access button on it lets you quickly switch between the tool windows and can be used to hide and unhide the tool window bar.

On the right side of the status bar, there are widgets that indicate the overall project and IDE status and provide access to various other settings like Git branches.
At the top, you can also find the Navigation bar, which can serve as a quick alternative to the Project tool window.
You can also use the buttons that are to the right of the navigation bar to quickly perform some common actions, like running or debugging an app, updating a project or making a commit, running a search, and so on.
![]()
Right above the Navigation bar, you’ll find the main menu. It has various actions and controls, including the Preferences/Settings and Help sections.

That’s it for today. Please let us know if you find this series of tutorials helpful and share your feedback with us in the comments below.
The WebStorm team
Subscribe to WebStorm Blog updates