On Writer's Side
Intelligent tools for writers and new ways to write better
From Numbers to Clarity: Using Math to Simplify Data-Heavy Product Documentation


In today’s world, data platforms are crucial for any organization. These platforms make data storage assets available and provide the necessary tools to work with data effectively. In this blog post, we’ll explore the inner workings of JetBrains’ data kitchen and the role that documentation plays in it.
What is the Product Analytics Platform at JetBrains
The JetBrains Product Analytics Platform is an internal statistics system that collects, stores, and displays anonymous feature usage data from users who have data sharing enabled. This data is gathered from various JetBrains products, plugins, and services, both internal and external. With the help of the platform, we are able to provide JetBrains teams with data storage and interactive self-service analytics through a web interface.
Similar well-known, publicly available products include Mixpanel, Amplitude, and Google Analytics, whose documentation we study closely both for reference purposes and to help us improve the platform.

The primary audience for JetBrains’ Analytics Platform is internal product and marketing managers, analysts, designers, researchers, developers, support, and QA specialists.
The Analytics Platform helps product managers better understand users’ environments and the value that new features bring to users. Marketing managers can spot technology trends among specific user segments. Designers can check which important UI elements aren’t discoverable or informative enough. Support and QA engineers can estimate the number of users affected by some critical problem. In a basic sense, the Analytics Platform is ultimately helpful for any professionals who build products at JetBrains. We serve a diverse audience who rely on data to support their decisions on product-related business questions.
Some of our stakeholders have to understand whether they need a particular metric or request a new one, while others help implement and maintain data collection for those metrics. Both audiences often ask very specific questions and seek to understand every detail of data sources and metric calculations. As such, documentation efforts are at the heart of our work.
Why include formulas in documentation?
Including math formulas in data product documentation is crucial for trust, clarity, and quick understanding. Just as a whiteboard in a math classroom simplifies learning, formulas in our documentation serve a similar purpose, converting metric calculations and data transformations into understandable terms.
Increase trust
The most important reason to include formulas in documentation is to increase trust. While interpreting the data, users need to understand how calculations are made before they can trust the results. Full transparency on how data is processed and metrics are calculated is the key to overcoming skepticism and establishing confidence, which is a major challenge in the data field.
Explain complex concepts in simple terms
The internal workings of the Product Analytics Platform always involve large and complex SQL queries. Calculations may also occur in the data engineering code.
Formulas and diagrams are perfect additions to the documentation in these cases, making complex concepts more accessible. They help users follow how data is prepared and calculated and eliminate the need for deep dives into discussions, underlying SQL queries, ETL operations, and data visualization code.
Provide quick understanding
Formulas, like other visual aids, attract user attention, provide instant understanding, and help users retain the information better. A well-placed formula or diagram allows readers to grasp the essence of a metric in seconds without needing to read through the entire page of text. This immediate clarity is important for users who need to make fast, informed, data-based decisions.
Assess necessity: optional for common metrics, essential for lesser-known ones
There is one simple rule of thumb concerning formulas in documentation – they are optional for common metrics, yet essential for lesser-known ones.
For some popular well-known metrics – like usages, conversion, retention, DAU, and MAU – formulas are optional and can be included in the documentation only if some heuristic calculations are involved. However, including the full formula is critically important for less well-known metrics, such as APDEX.
Examples from the JetBrains Product Analytics Platform documentation
In this section, we’ll provide selected examples of formulas from our internal User Guide about product metrics. Typically, it consists of two main parts: how to create a report and how to analyze the results with examples, tips, and points to consider. In some cases, it also includes a section on metric calculation logic.
Often, our data analysts take an industry-standard metric, refine it with heuristics to match JetBrains’ business goals, and produce a more complicated calculation pipeline.
The challenge for technical writers is to conduct thorough research using the limited information available on the internet and continually refine details with the analysts and developers involved.
This task requires extensive questioning and review, often involving chasing multiple subject matter experts and gathering content from unstructured internal resources, such as tickets, users’ questions, Slack threads, and proof-of-concept research and prototypes. The final result is distilled into a page (or three) of documentation and a single formula.
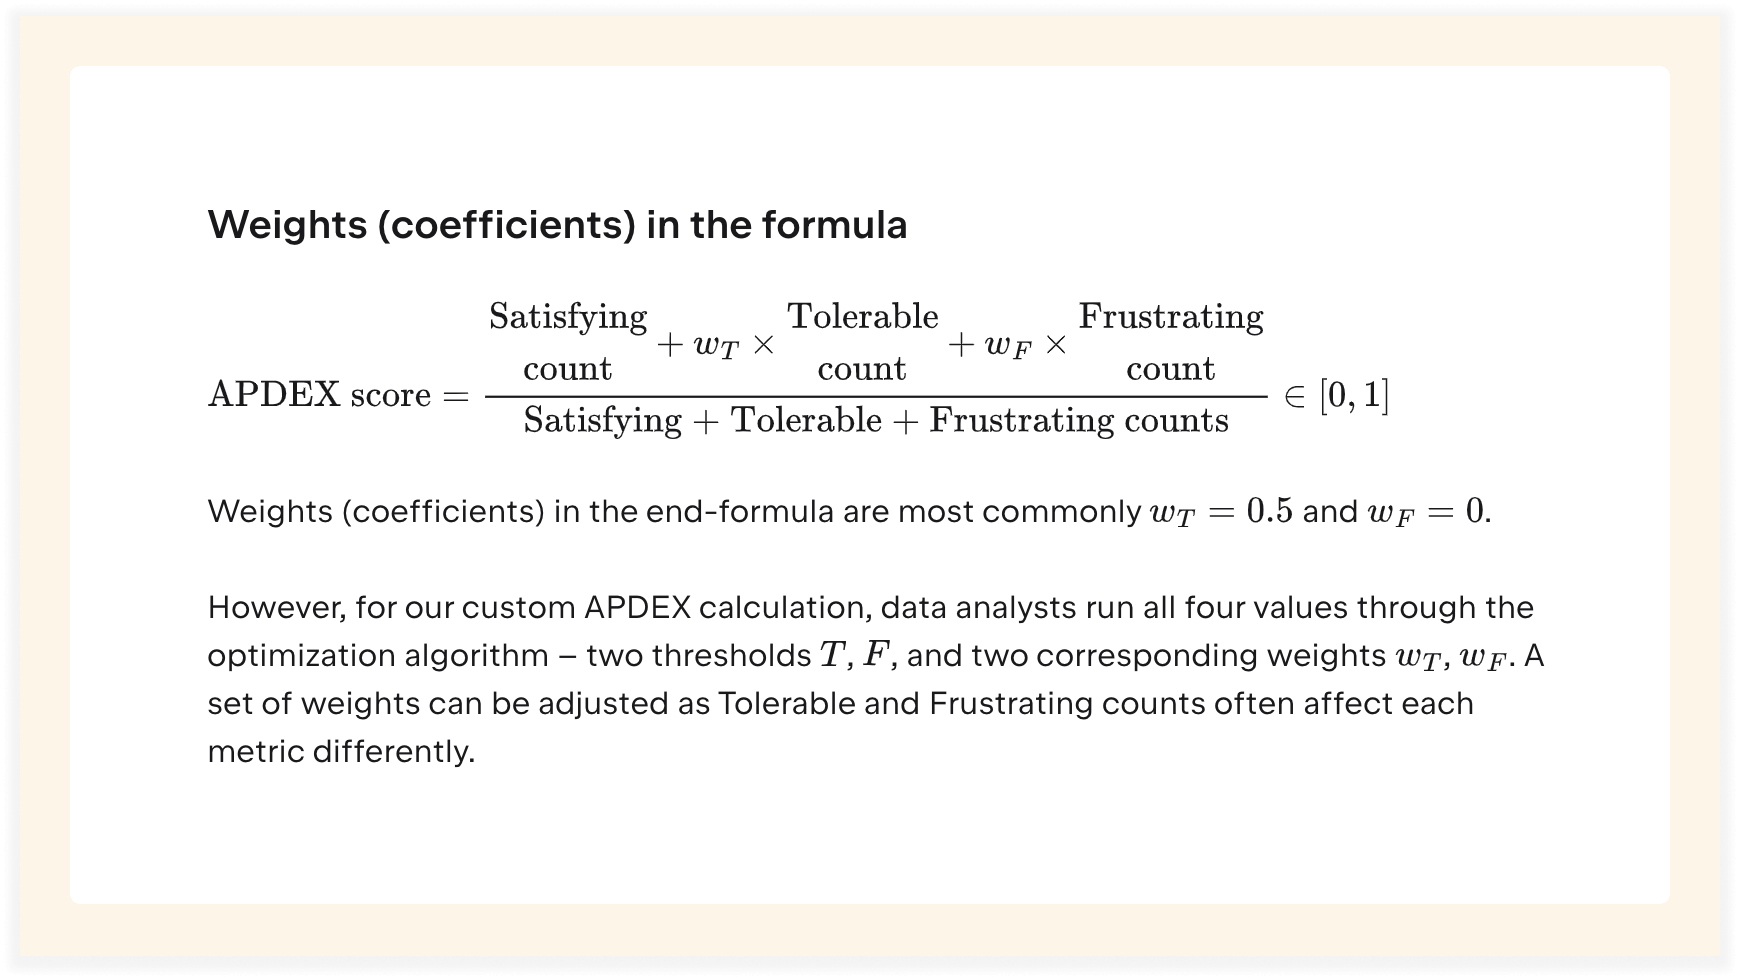
One such example is the APDEX metric – Application Performance Index. APDEX is a standard for measuring the performance of software applications, focusing on user satisfaction. Our data analysts created a custom approach to this metric. In documenting this metric, it’s essential to provide as much information as possible without overcomplicating the explanations. That’s where we can add the metric formula.
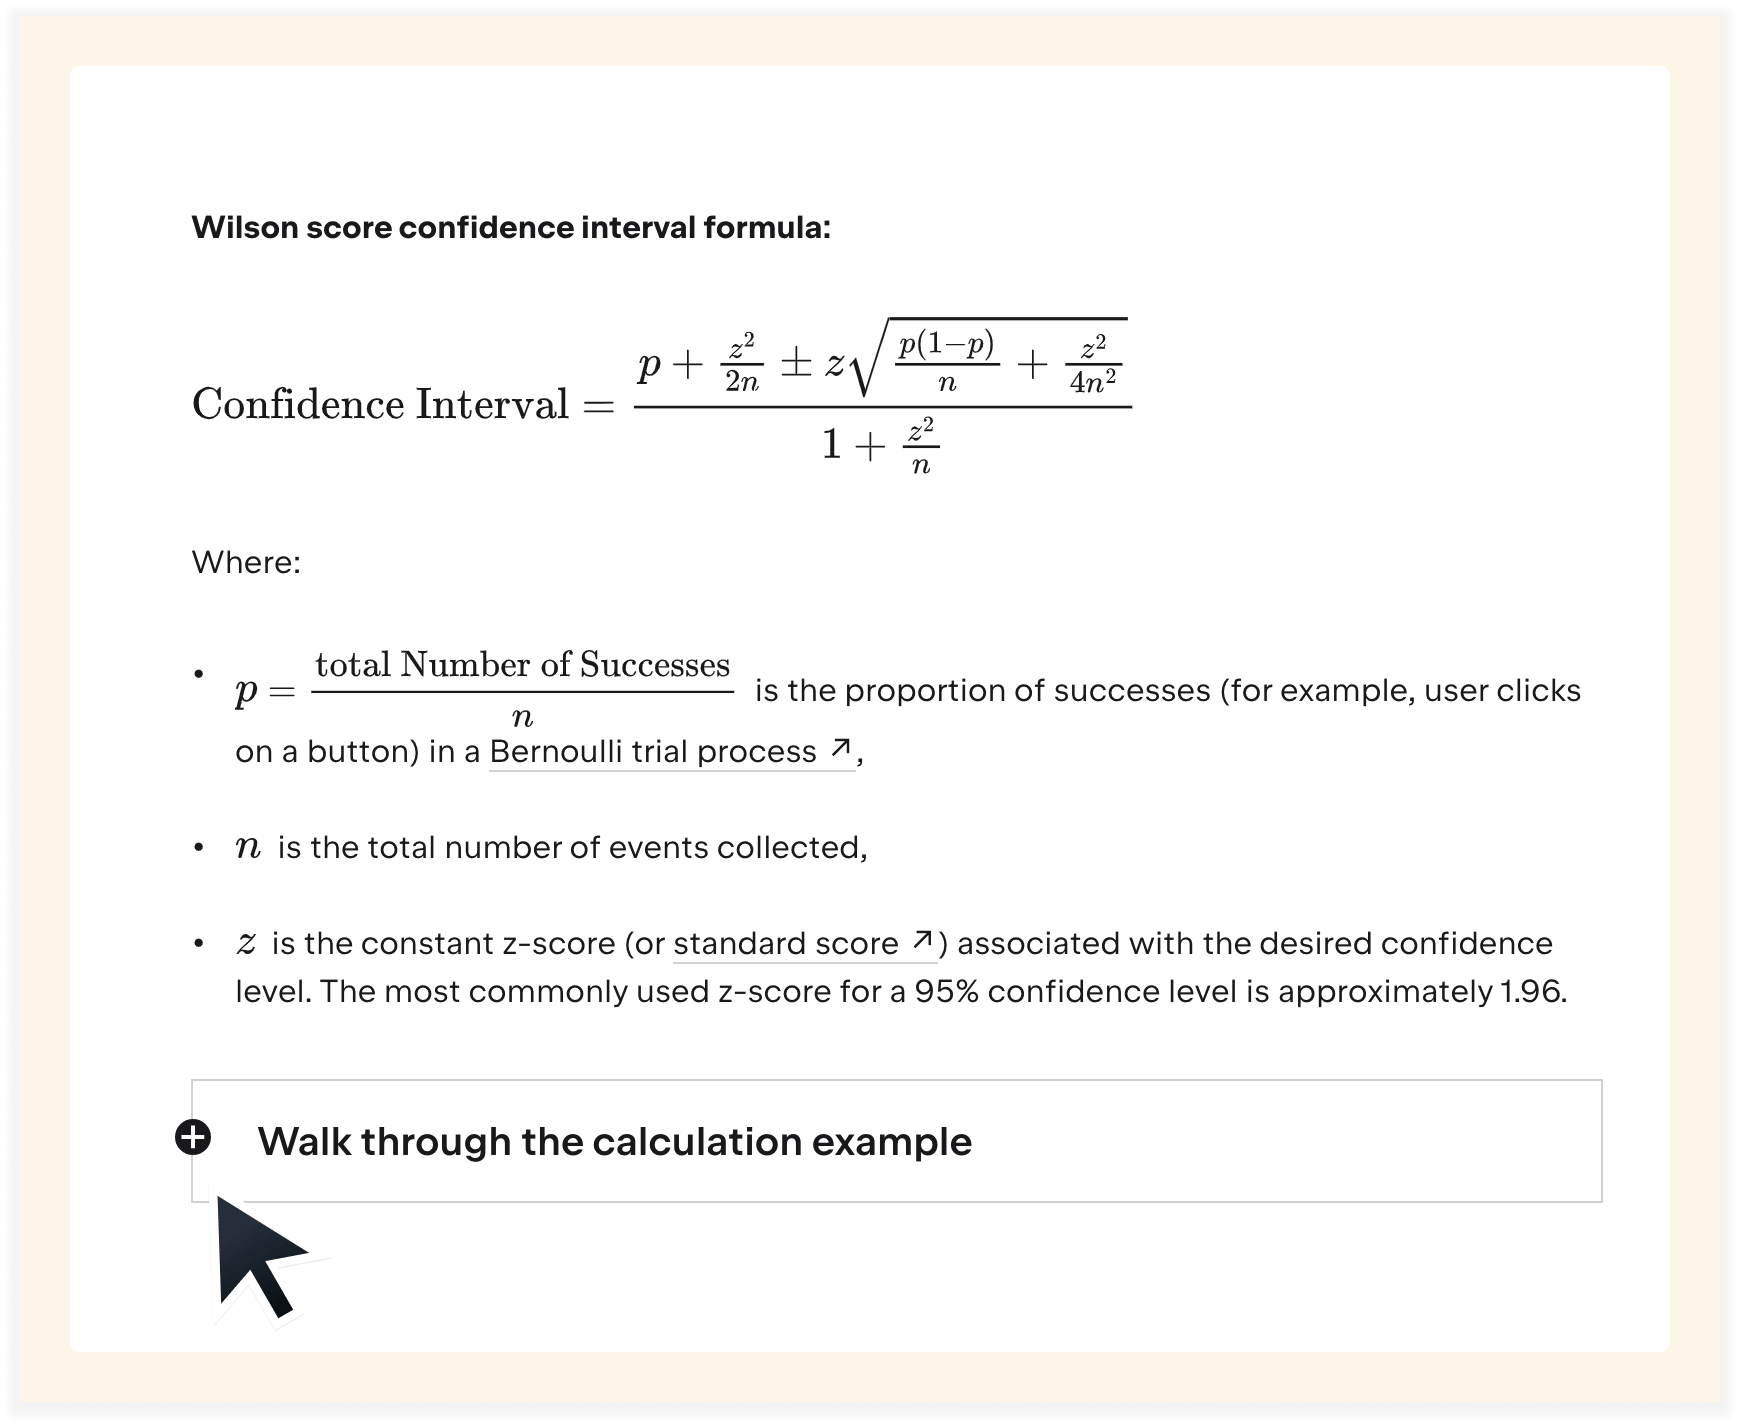
Another example from our documentation involves explaining statistical concepts, such as a confidence interval. We add confidence intervals to all of the metrics we calculate to help users understand and interpret the data accurately. Since some product features are used more frequently than others, understanding the difference in usage numbers is critical.
While information about confidence intervals is widely available on the internet, we needed to provide just the right amount of detail, specify the calculation model, and provide adapted examples that business people can comprehend. Additionally, we also walk users through these calculations to show how different sample sizes affect the confidence intervals.
Writerside – a tool for data-heavy product documentation
Our Product Analytics Platform team creates documentation with Writerside, a JetBrains in-house solution for authoring data-heavy docs. Block formulas have been supported in Writerside for a long time, using standard code block markup. Inline formulas are a recent addition following a large number of requests from users.
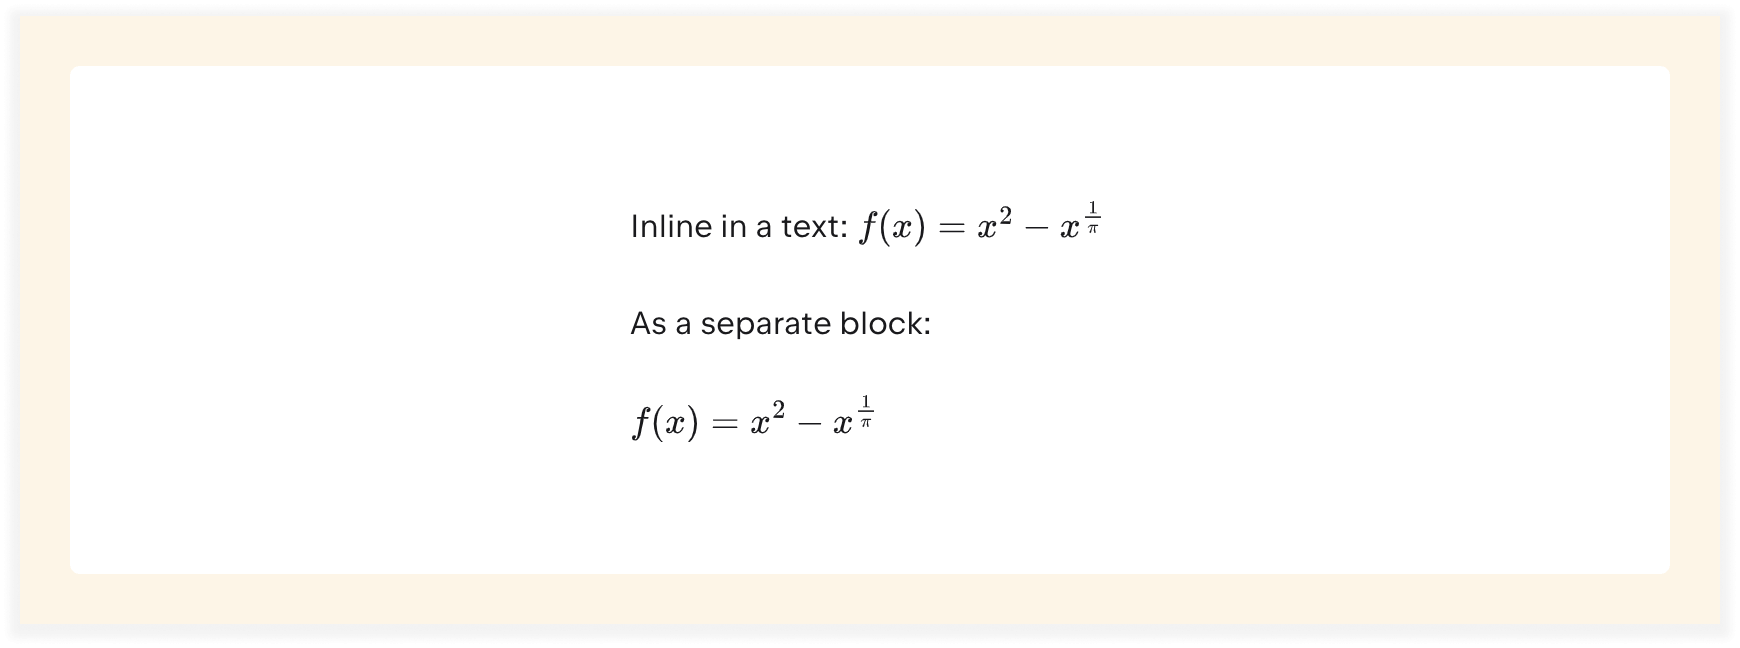
You can now add math formulas directly into your content without interrupting your flow. Use single dollar signs ($) around a formula for inline display or double dollar signs ($$) for a separate block display as required.
Here is an illustration of how you can use it in line: $f(x) = x^2 – x^\frac{1}{\pi}$, and here it is as a block element:
$$f(x) = x^2 – x^\frac{1}{\pi}$$
Which results in a view like this:
For those who stick to a semantic markup, we have introduced a dedicated <math> element for block formulas. This tag not only keeps the formula separate for emphasis and clarity but also enhances the semantic correctness of the documentation, making formulas easier to read than when a code block is used.
<math>
f(x) = x^2 – x^\frac{1}{\pi}
</math>
Writerside supports not only math expressions but also Mermaid, PlantUML, and D2 diagrams. You can check it out free of charge in the Early Access Program.
Conclusion
Including mathematical formulas in your documentation can improve trust and clarity, and facilitate quick understanding. Formulas and diagrams can bridge the gap between technical details and user comprehension, especially for complex and lesser-known metrics or calculations.
Formulas help break down difficult concepts, making them more accessible to a diverse audience – some may prefer reading detailed explanations, while others might find diagrams and formulas more helpful. Additionally, they help users who need to make quick decisions.
How do you incorporate mathematical formulas into your documentation? We’d love to see your tips and tricks in the comments below!