Simultaneous debugging sessions in PhpStorm
When building web applications with multiple tiers, we can have a situation in which frontend PHP code calls into backend PHP code. It’s easy to use remote debugging on the frontend, but what if we wanted to debug both sides at the same time?
By default, PhpStorm accepts only one debugger connection at a time. There are several reasons for this, for example when making extensive use of AJAX a lot of incoming debugger connections may be created making debugging virtually impossible.
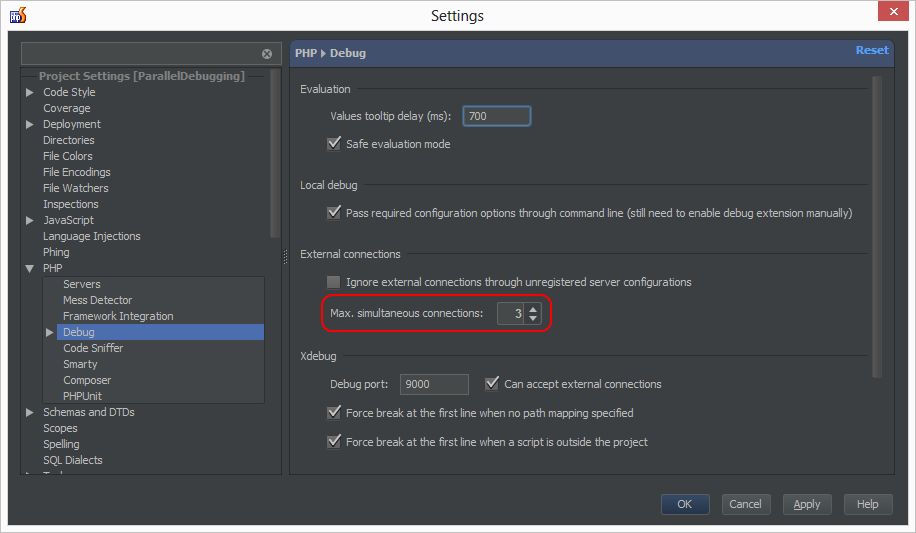
On a per-project basis, we can enable support for having more than one debugger connection. Through the File | Settings menu and then PHP | Debug, we can beef up the maximum number of simultaneous connections from 1 to a larger number.
Note that for debugging to work, we must configure PHP and enable the PHP Debug Connections listener in PhpStorm. More on this can be found in our new tutorials space.
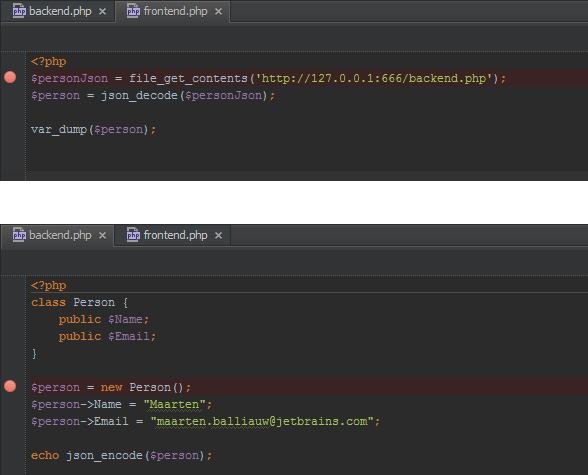
Let’s put this to the test. As an example, I’ve created two simple files where frontend.php makes a call to backend.php.
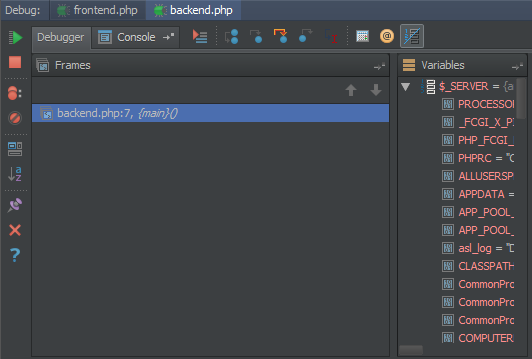
After placing a breakpoint in both files, we can run our code on our local webserver and call into frontend.php from a browser. When stepping through the code, PhpStorm will open a new debug session for backend.php once it gets called by the frontend code.
As always, we appreciate your feedback in the comments below or in our forums!
Develop with pleasure!
– JetBrains Web IDE Team

