Spy-js 2.0: New Level of JavaScript Tracing
It has been almost 7 months since we released WebStorm 8. The recently rolled out WebStorm 9 brings a lot of new things on top of that, so today I’m going to tell you more about some new exciting features I have been working on in spy-js, and will share some tips and tricks on how to use them.
Spy-js powered Autocompletion and Magnifier
Last fall, in a spy-js presentation I mentioned a few possible distant-future features. Well, the future is here and today those feature come true. Please welcome spy-js-driven code completion and magnifier!
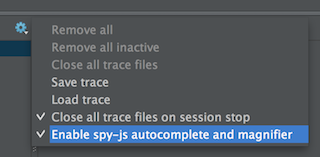 Before using these new features, make sure to select “Enable spy-js autocomplete and magnifier” in the Events toolbar menu. By doing so, you will allow spy-js to perform some additional ‘dark magic’ during its code instrumentation phase, to make possible what you’re about to see.
These new features are available for the browser and node.js, so I will use a sample MEAN stack application to demonstrate both of them in action.
Spy-js powered Autocompletion
First, let’s launch the application with spy-js and access it from Chrome or any other browser of your choice. If you haven’t tried this before, please read this blog post for more details. Now let’s jump straight into some source file with executed code and start editing one of its functions.
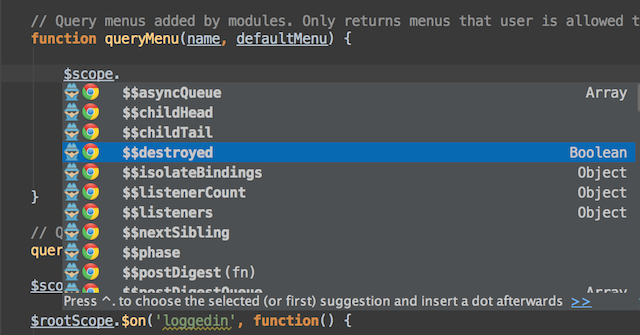
Because the spy-js-traced application is running in Chrome, we can see completion suggestions from spy-js with Chrome icon as we modify the application. If a different browser is used, its icon would be displayed instead. If you’re are working with more than one browser at the same time, spy-js will cleverly combine completion suggestions from all of the browsers that have the traced page opened.
If we jump to some executed server side node.js code and start editing it, we’ll get spy-js powered completion assistance as well:
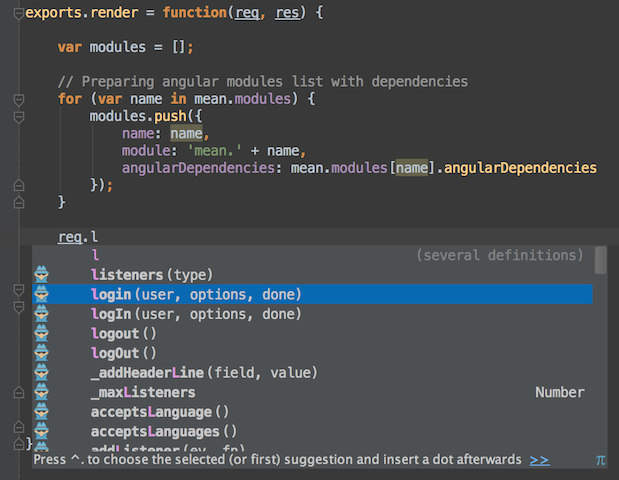
If you don’t notice anything special on the screenshots above, you might say: Meh, I already had completion in WebStorm, so what’s the deal here? Well, completion assistance in all of the JavaScript editors, including WebStorm default completion data provider, is enabled by JavaScript code static analysis data. Spy-js completion is different as it uses runtime data to complement WebStorm standard completion and to provide very precise suggestions that reflect the reality of the executed code.
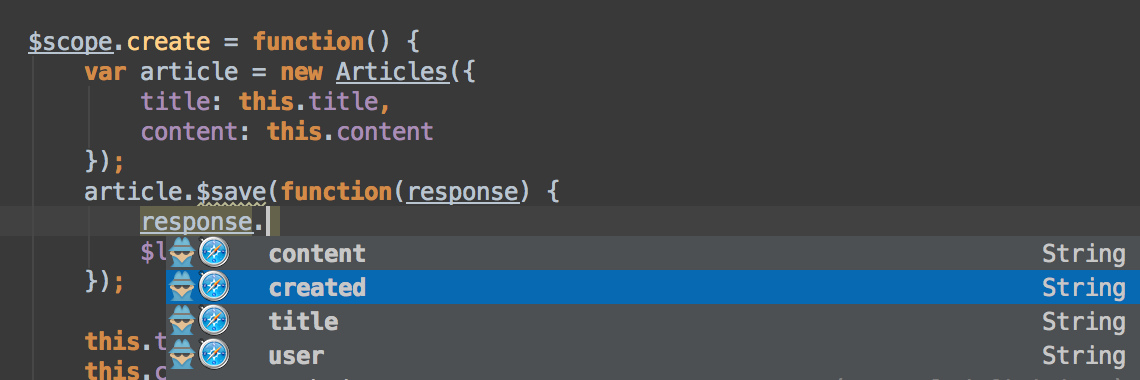
Due to the dynamic nature of JavaScript, static analysis cannot reach many corners of your codebase. Spy-js comes to rescue in these cases, as it doesn’t have to guess what to suggest for an autocompletion list—it knows it exactly. Even when you’re dealing with dynamic data, like JSON that you’ve received from your server or read from disk.
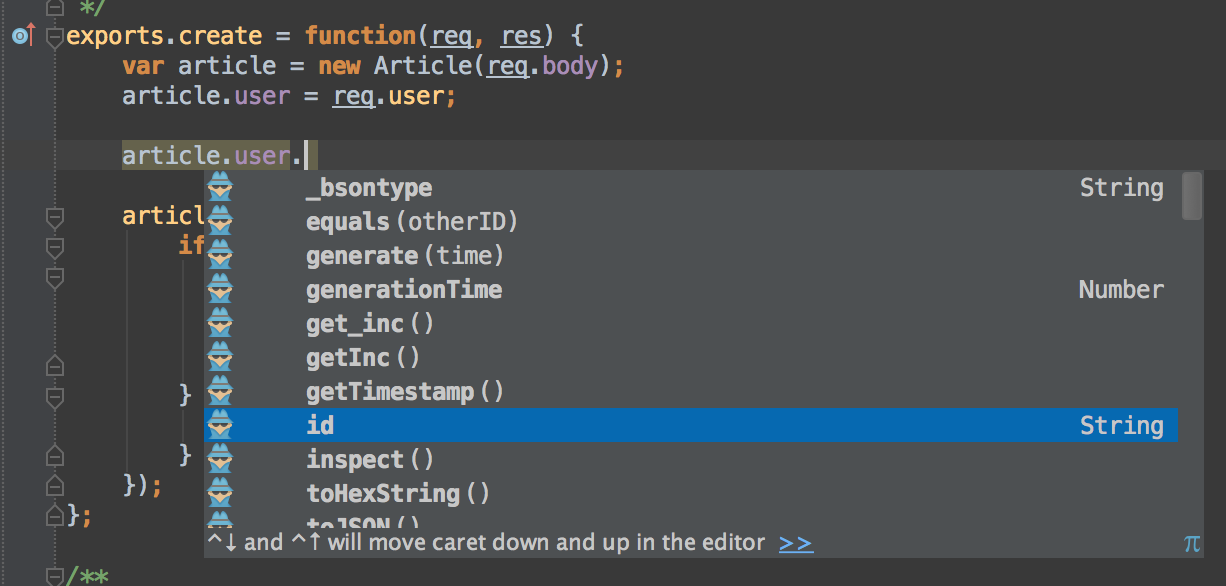
Being powered by runtime data has its price. There are two major things you have to remember when working with spy-js completion assistance. First, the code where you’re expecting completion suggestions from spy-js has to be executed first. Second, when you change your code, some previously valid runtime data may become obsolete until you re-run your code. While spy-js does its best to retain the code changes and provide valid completion data for as long possible, it works best if you re-run your code periodically to keep the runtime data up-to-date.
Spy-js Magnifier
Imagine a typical scenario where you’d like to debug some code. You find a source file, find a function within it, find a line where you’d like to set a breakpoint, run your scenario, hit the breakpoint, and start inspecting object values that are available in the scope where you’ve stopped your code. Sounds familiar, doesn’t it?
Now, if you have worked with spy-js before, you know how it’s different from the debugging scenario. You execute your code and you have trace files, where apart from the executed path you could inspect recorded parameters and return values of executed functions. It works great when you’re analyzing the trace step by step, function by function.
What if you could get the best of both worlds and be able to just open your source code and quickly inspect any up-to-date object values? And not only for parameters and return values, but for any objects? And no object depth limitations? And without having to set and stop at breakpoints.? And both in browser and node.js code? Well, that’s exactly what spy-js magnifier allows you to do!
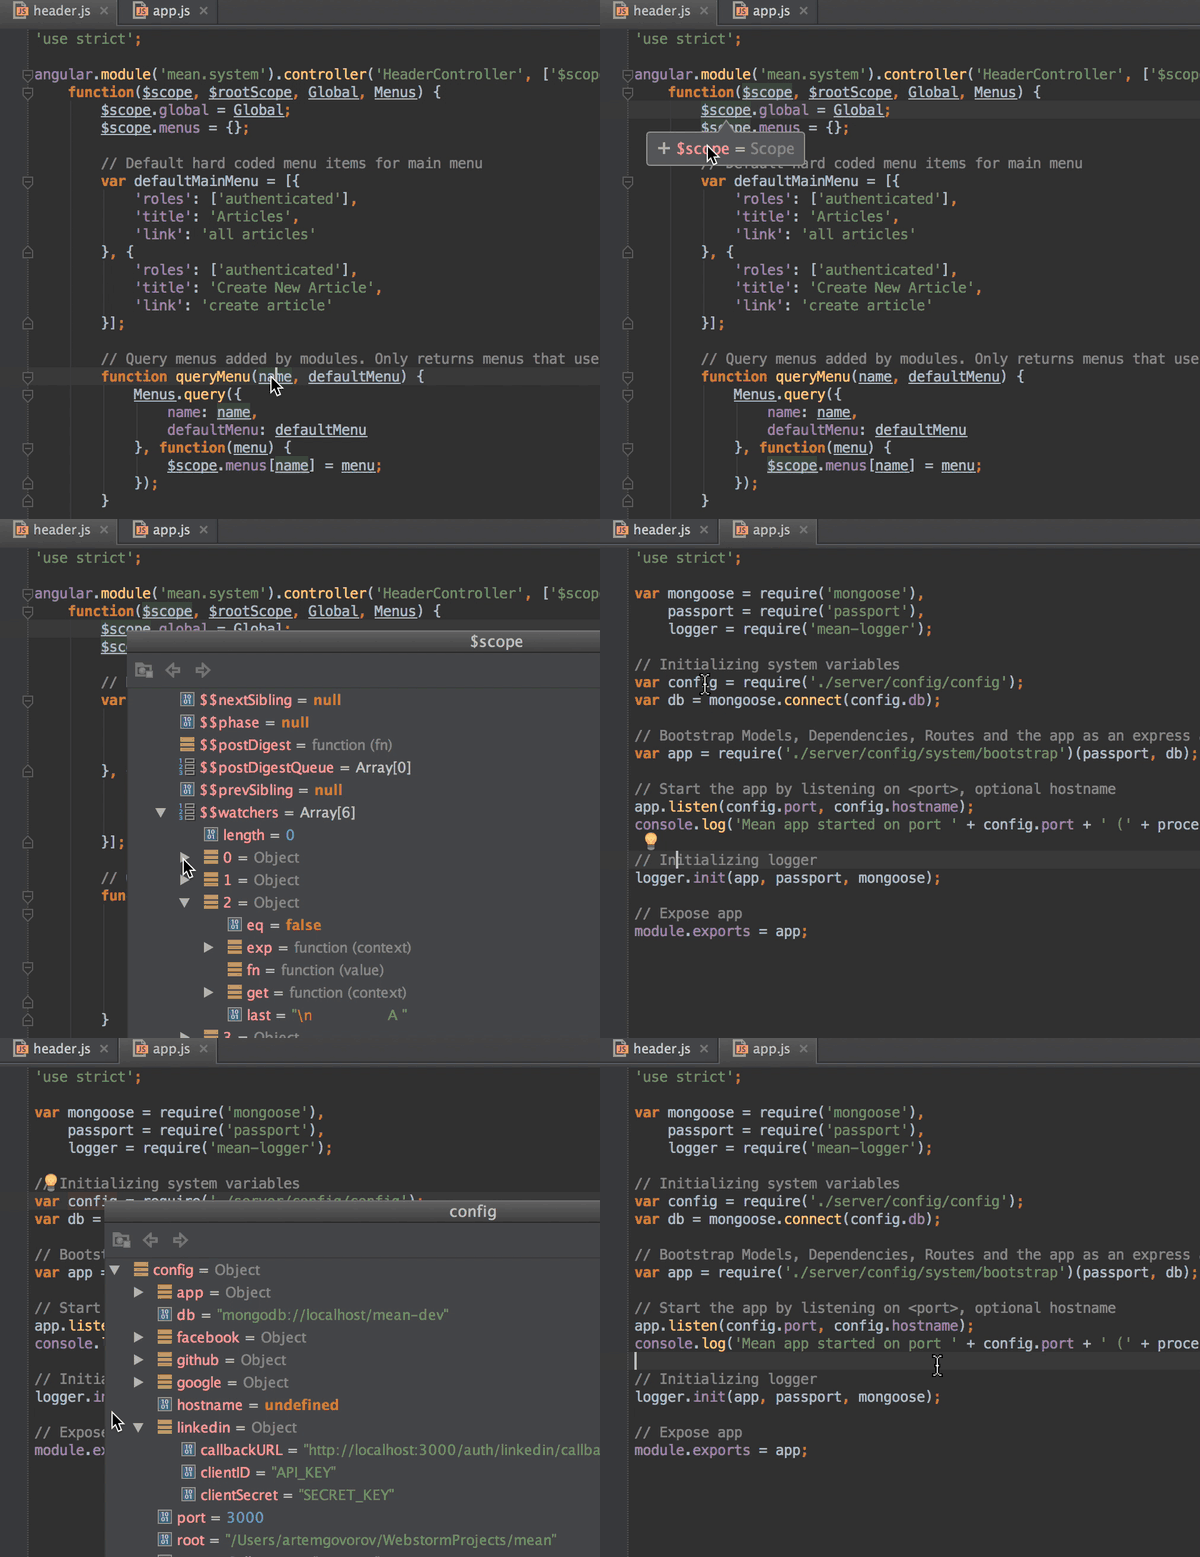
Just start spy-js Run Configuration and hover the mouse over any expression in any executed context/scope (or press Cmd-Alt-F8 on Mac or Ctrl+Alt+F8 on Windows or Linux) to get the latest value for the expression.
This feature should definitely spare you from a few console.log calls here and there and from setting breakpoints to just inspect some objects.
Node.js support
I’m very excited to mention node.js application tracing support. Please watch the video and read this blog post for more details.
https://www.youtube.com/watch?v=kzw8GmakYGY
Saving and Loading Traces
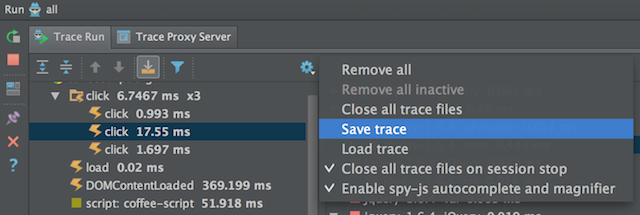
Imagine a scenario where you’re tracing some application to find out what’s going on inside it. Suddenly you find some suspicious call stack or an exception that you’d like to analyze later, maybe share with your teammate responsible for the code you’re tracing, or even attach the trace to the bug report in your issue tracker. To support this scenario, spy-js now allows you to save the running trace and load it later in the same or a different WebStorm instance. Simply use Save/Load trace menu items from the Events toolbar menu. Note that the feature is available both for browser and node.js traces.
ES6 support
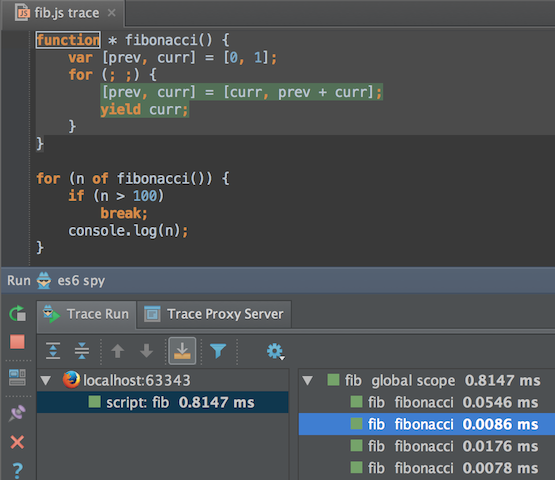
ES6 support is slowly but steadily coming to browsers and node.js. Whether you’re using some browser’s latest version or node.js 0.11.x with the –harmony flag, it’s now possible to trace code that is using new language features, such as generators or arrow functions. Spy-js fully supports the current version of the ES6 specification draft.
That’s it for this post. Thanks for reading and I hope you enjoy the new spy-js features. Please keep sharing your feedback here in comments, on Twitter and in YouTrack.


