Tracing, Debugging and Profiling Node.js with spy-js
This post is part of a series of posts covering features in WebStorm 9 EAP:
Spy-js, our “secret agent”, has done a great job at tracing, debugging and profiling front-end JavaScript code. With WebStorm 9 EAP, we’re expanding its job: there is no back-end Node.js code our 007 can’t infiltrate.
As a refresher, spy-js was introduced with WebStorm 8. It allows tracing our code without resorting to console.log, debugging it without breakpoints and profiling it without any specialized tools. When running our application with spy-js, it gathers intelligence which we can use to see exactly what was going on in our code, even if it’s no longer running.
Let’s pour a Vodka-Martini (shaken, not stirred) and see how we can use spy-js for tracing, debugging and profiling Node.js apps.
http://youtu.be/kzw8GmakYGY
Spy-js Run Configuration for Node.js
First things first: we will have to create a new Run Configuration of the Spy-js for Node.js type. The parameters we have to specify are very similar to a regular Node.js Run Configuration: the Node interpreter, the working directory, the path to the JavaScript file we want to execute and so on. Optionally, we can provide a spy-js configuration file and decide which TCP port it will use to do its work.
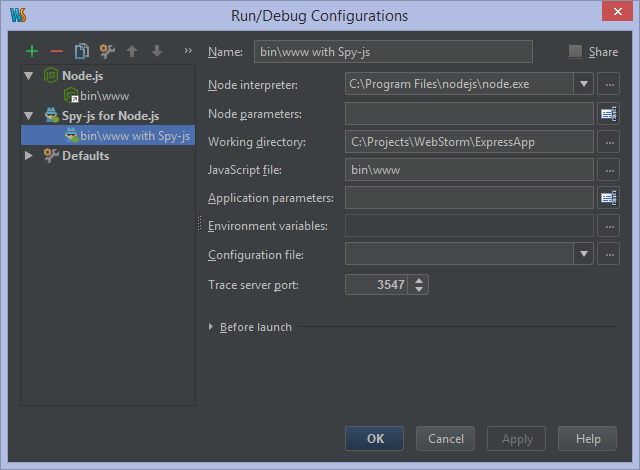
Once that’s done, we can launch our app using this newly created Run configuration. Pressing Shift+F10 (Ctrl+R on Mac OS X) will do the trick.
The Spy-js Tool Window
After launching our application, a new tool window will open in which we can see the various types of information spy-js collects. For my Express app here, we can see from the Events Pane that the app has started from a script, as well as the different events and executions that took place while running and using the application. Hovering any event will show some useful information, like the list of scripts that participated in the execution and the time it took to run.
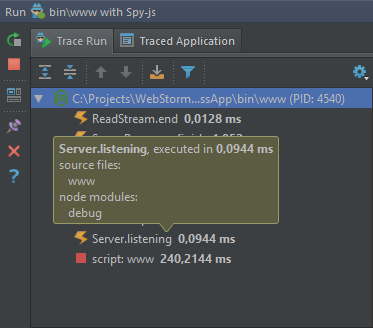
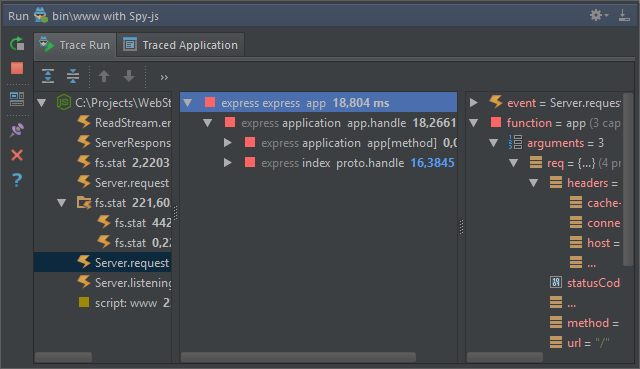
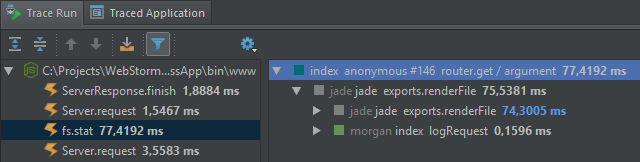
Selecting an event populates the Event Stack pane, showing the stack tree along with a short file and function name. For npm packages, the name of the module is displayed as well. We can also see the execution time of the function. Some nodes may have their execution time rendered in blue, meaning the function is responsible for more than 50% of the execution time of the expanded stack level. A perfect candidate to look into for performance optimization! Nodes rendered in red have had an unhandled exception occur.
The right-most pane shows more details about the selected stack tree node, for example the arguments passed into it.
We can use the context menu pretty much all the time for various actions, such as navigating to the package.json file, the source code for the highlighted function, and more interesting: the trace for the selected function. Press enter or use the Jump to Trace context menu of the selected node. Spy-js will show us the code with executed statements highlighted, and we can hover over variables to see their values, or over functions to see their return values. Note that we can also enable Autoscroll to Trace from the toolbar to automatically open the trace file when selecting a node.
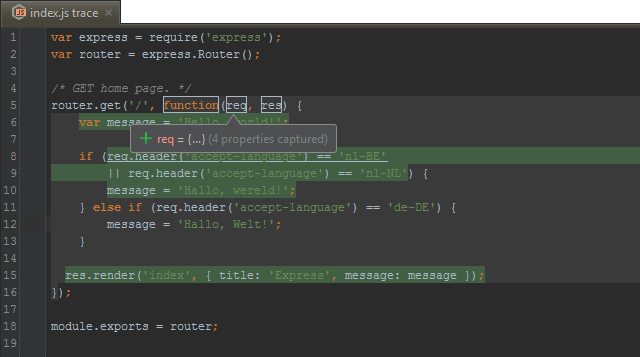
From the code above, we can see the code that was executed: the “else if” block was not touched since the first condition matched for this request.
Mute Files and Modules
When using spy-js for the first time, or with modules like Express, the information shown can be overwhelming. To give you an idea, here’s the stack trace for hitting the index route in my application:
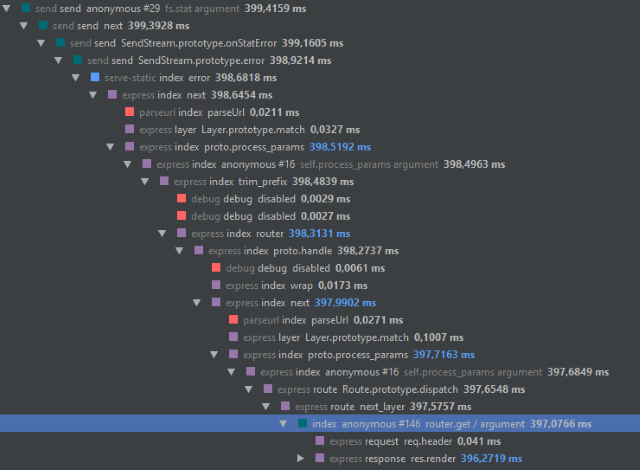
The function timings and trace of everything that happens in Express may not be of interest. By using the Mute this node module context menu on any of the Express functions, the tree will contain everything except the muted module on subsequent requests.
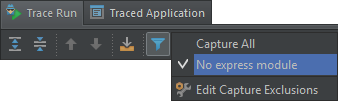
Using the Capture Events toolbar button, we can specify the events we want to capture or filter out. The Edit Capture Exclusions option opens a dialog in which we can filter events by event names or file name.
Spy-js with Child Processes
Whenever we want to run parallel processes in Node.js, we can go beyond its single-threaded nature and make use of the child_process module. Consider the following (pretty much useless) code that spawns several child processes.
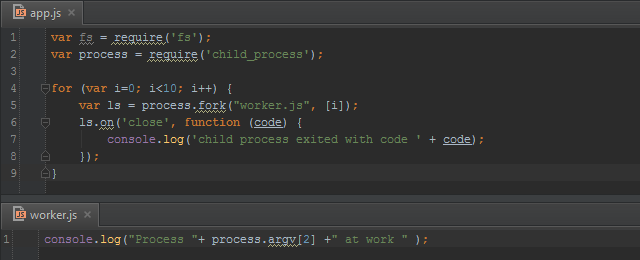
When running app.js with spy-js, the Events Pane will have a node for our main program, as well as for the child processes that have been launched. We can do exactly the same things with them as we did earlier: each process will have its events listed, and we can drill down into the stack traces, mute specific modules and so on.
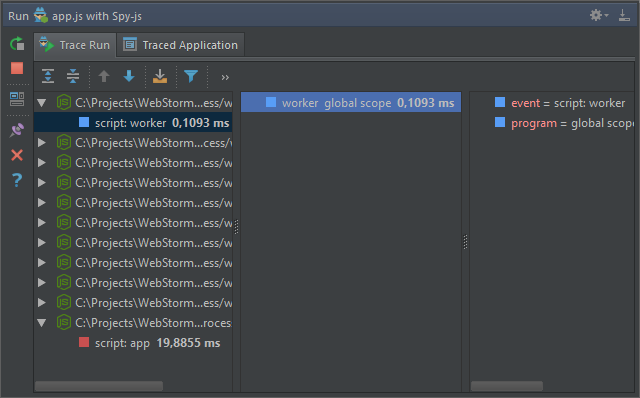
Child processes support is really handy when working with Node.js cluster: spy-js intercepts child process forking deep enough to trace applications that are using Node.js cluster extensively.
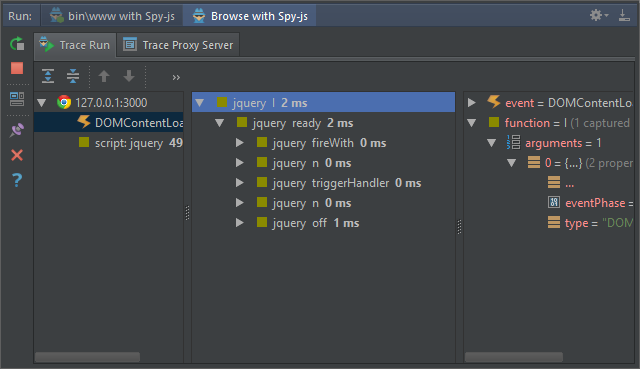
Simultaneously spying on the browser and the server
With spy-js for Node.js, we can now trace, debug and profile our server-side code. It’s worth mentioning that two spy-js sessions can be launched at the same time: one for the browser and one for Node.js. This gives us a nice end-to-end view of what’s happening in our application. The spy-js tool window will show both sessions in a different tab.
Download the latest WebStorm 9 EAP and go on a secret mission with spy-js. We would love to hear your thoughts in the comments below!
Develop with pleasure!
JetBrains WebStorm Team
WebStorm 9 EAP is Open! | JetBrains WebStorm Blog says:
August 13, 2014[…] To learn more, refer to Spy-js: WebStorm secret service and Tracing, debugging and profiling Node.js with spy-js. […]
Steve says:
August 14, 2014Will you be integrating spy-js profiling with something like the Karma test runner. Similar to dot trace?
Artem Govorov says:
August 15, 2014Spy-js will be able to trace tests launched by karma runner in the next EAP release.
Sergey says:
August 17, 2014Sick! Can’t wait to see that 🙂
capaj says:
September 24, 2014That will be. Can’t wait.
Live Edit Updates in WebStorm 9 — What’s New? | JetBrains WebStorm Blog says:
August 20, 2014[…] ← WebStorm 9 EAP is Open! Tracing, debugging and profiling Node.js with spy-js → […]
Sergey says:
September 4, 2014All this stuff is amazing, thank you very much! Do you think it is possible to make a ‘search for’ for events window, so that you can find where file ‘jquery.js’ or ‘somethingelse.js’ was used. Now you have to mouse over each event and when you have bunch of events it is sometimes tricky to find the one you’re interested in.
Artem Govorov says:
September 8, 2014I have been thinking of improving spy-js trace search, have created the feature request listing the ideas (including yours) on what the search should be able to do. Please feel free to vote/share more thoughts on the subject in the feature request comments.
Meteor Support in WebStorm 9 | JetBrains WebStorm Blog says:
September 9, 2014[…] Tracing, debugging and profiling Node.js with spy-js […]
WebStorm 9 EAP, 138.2406: spy-js code completion, CSS3 enhancements, Scratch files and… JSX | JetBrains WebStorm Blog says:
September 22, 2014[…] Tracing, debugging and profiling Node.js with spy-js […]
Alex Trz says:
September 29, 2014Is there any repository of the spy.js agent ?
Does it work for Node.js 0.10 and 0.11 ?
Thanks!
Ekaterina Prigara says:
September 29, 2014What do you mean by the spy-js agent? spy-js is not open source, it’s part of WebStorm IDE.
Sergey says:
September 30, 2014Is it just me or it is not possible to use files outside of the project as a main javascript file? WebStorm gives me a following error: ‘Javascript file path must be specified correctly’. http://clip2net.com/clip/m0/33855-clip-53kb.png?nocache=1
Ekaterina Prigara says:
October 1, 2014Sergey, that’s a intentional limitation. Could you please describe the use case a bit more detailed? Do you want to trace your app started using grunt serve, or do you want to trace the build tasks?
Sergey says:
October 1, 2014I wanted to see what was going on with my program and it was hard to tell what exactly was failing – my build tasks or grunt. Because grunt is a main entry point that is why I wanted to select it as js file to trace. Are there better ways of doing it? 🙂
Artem Govorov says:
October 1, 2014One way would be to create a local project file (say grunt-cli.js) with code like:
require('grunt').cli();
and invoke it.
Sergey says:
October 1, 2014I see, thank you Artem.
kodeninja says:
October 7, 2014Any chance this would be available in Intellij IDEA 13 as well?
Ekaterina Prigara says:
October 7, 2014It is available in IntelliJ IDEA 14. You can try IJ 14 public preview: https://www.jetbrains.com/idea/nextversion/
Dylan Cone says:
October 20, 2014I’m trying to use Spy-js for node in a node application using requirejs. The application runs perfectly using a standard node configuration in run/debug modes, however when I try to run it in a Spy-js configuration, an exception is being thrown stating the requirejs object that is handed back doesn’t have a config method. This may be a bug in requirejs, but I’m wondering if anyone has run into this before.
Thanks!
Dylan Cone says:
October 20, 2014It looks like r.js isn’t exporting the requirejs module on line 27899. I notice in the Spy-js trace that all the if/if-else branches are being evaluated and none of them are taken. Maybe the way Spy-js is being run is freaking out requirejs so that it doesn’t think that it’s running in a node environment?
Dylan Cone says:
October 21, 2014Sorry to be debugging on your blog, but it may have some value. If I force the branch to true on 27894 of r.js things work better. Requirejs exports properly and I can call config now. However the paths are screwed up. The base path is being configured to requirejs’s node_modules folder. Anyway, hope this helps you guys. Please keep me posted on this issue. Thanks!
Artem Govorov says:
October 21, 2014Thanks for the report and investigation. I have created an issue in YouTrack, will be fixing it shortly.
Spy-js 2.0: New level of JavaScript tracing | JetBrains WebStorm Blog says:
October 30, 2014[…] I’m very excited to mention node.js application tracing support. Please watch the video and read this blog post for more details. […]
[Webinar Recording] A Deep Dive into WebStorm 9′s New Features | JetBrains WebStorm Blog says:
October 31, 2014[…] 2.0: tracing Node.js app, code completion and […]
Lei Wang says:
November 11, 2014I have a node.js project. I can run app.js to get the server running.
I configured to run spy-js for nodes.
in the javascript file field, I give it ‘app.js’.
It ran, and the spy js consoles showed up, when I evoke from browser localhost:9300/getUsers, the result returns, but nothing was captured in the spy js Trace. Am I missing anything?
Thanks,
Ekaterina Prigara says:
November 12, 2014Spy-js for Node.js run configuration starts your node application and you don’t need to start Node.js run configuration. Do you see any other events in spy-js tool window when you start your spy-js session?
Bert Casier says:
April 27, 2016Is it possible to specify a remote node-interpreter for Spy-js for Node
I want to trace an application running on a vagrant instance
Dennis Ushakov says:
April 28, 2016No, that’s not possible now. Feel free to create a request in our tracker