Debugging with GoLand – Improvements in 2019.1
We kicked off this series with how the debugger can be launched and then went on to explain how you can interact with it and configure various breakpoint properties.
Today we are continuing on this series with a look at some of the new features available in the debugger which can bring some significant improvements to your quality of life, at least a less stressful time debugging.
Before we go on, please note that these features are available only from the 2019.1 release of the IDE.
We touched briefly on the support for controlling the execution flow in the debugger by using functionality such as Step Over an instruction, Step Into a function call, Step Out of a function call. But what happens when we want to step into a function call but there are multiple instructions on the same line?
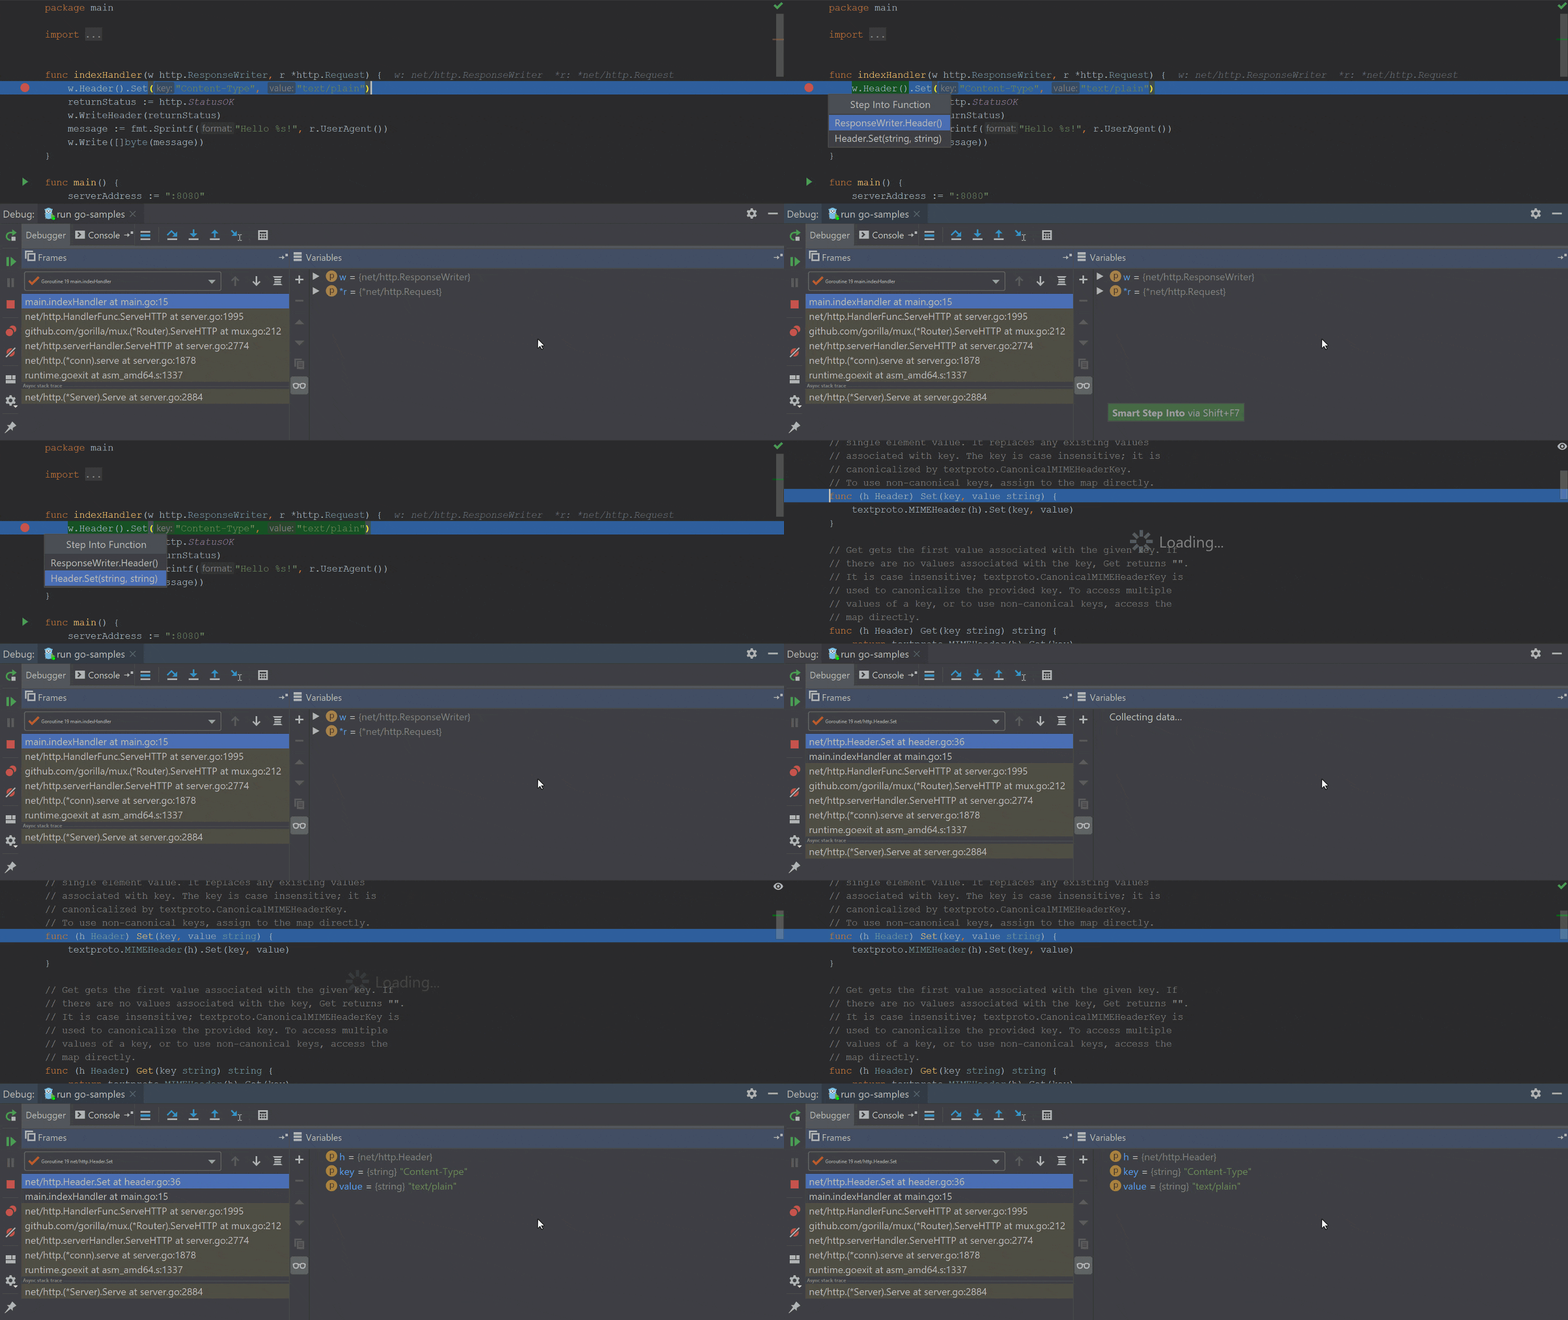
This is where Smart Step Into comes in. This feature allows us to choose which function call we want to step into, instead of having to jump into all of them. This can be useful if we want to avoid jumping into standard library functions, or functions provided by other packages or that we’ve previously analyzed and know don’t need to be inspected again. To invoke it, use the Shift + F7 shortcut or Run | Smart Step Into.
Let’s see it in action:
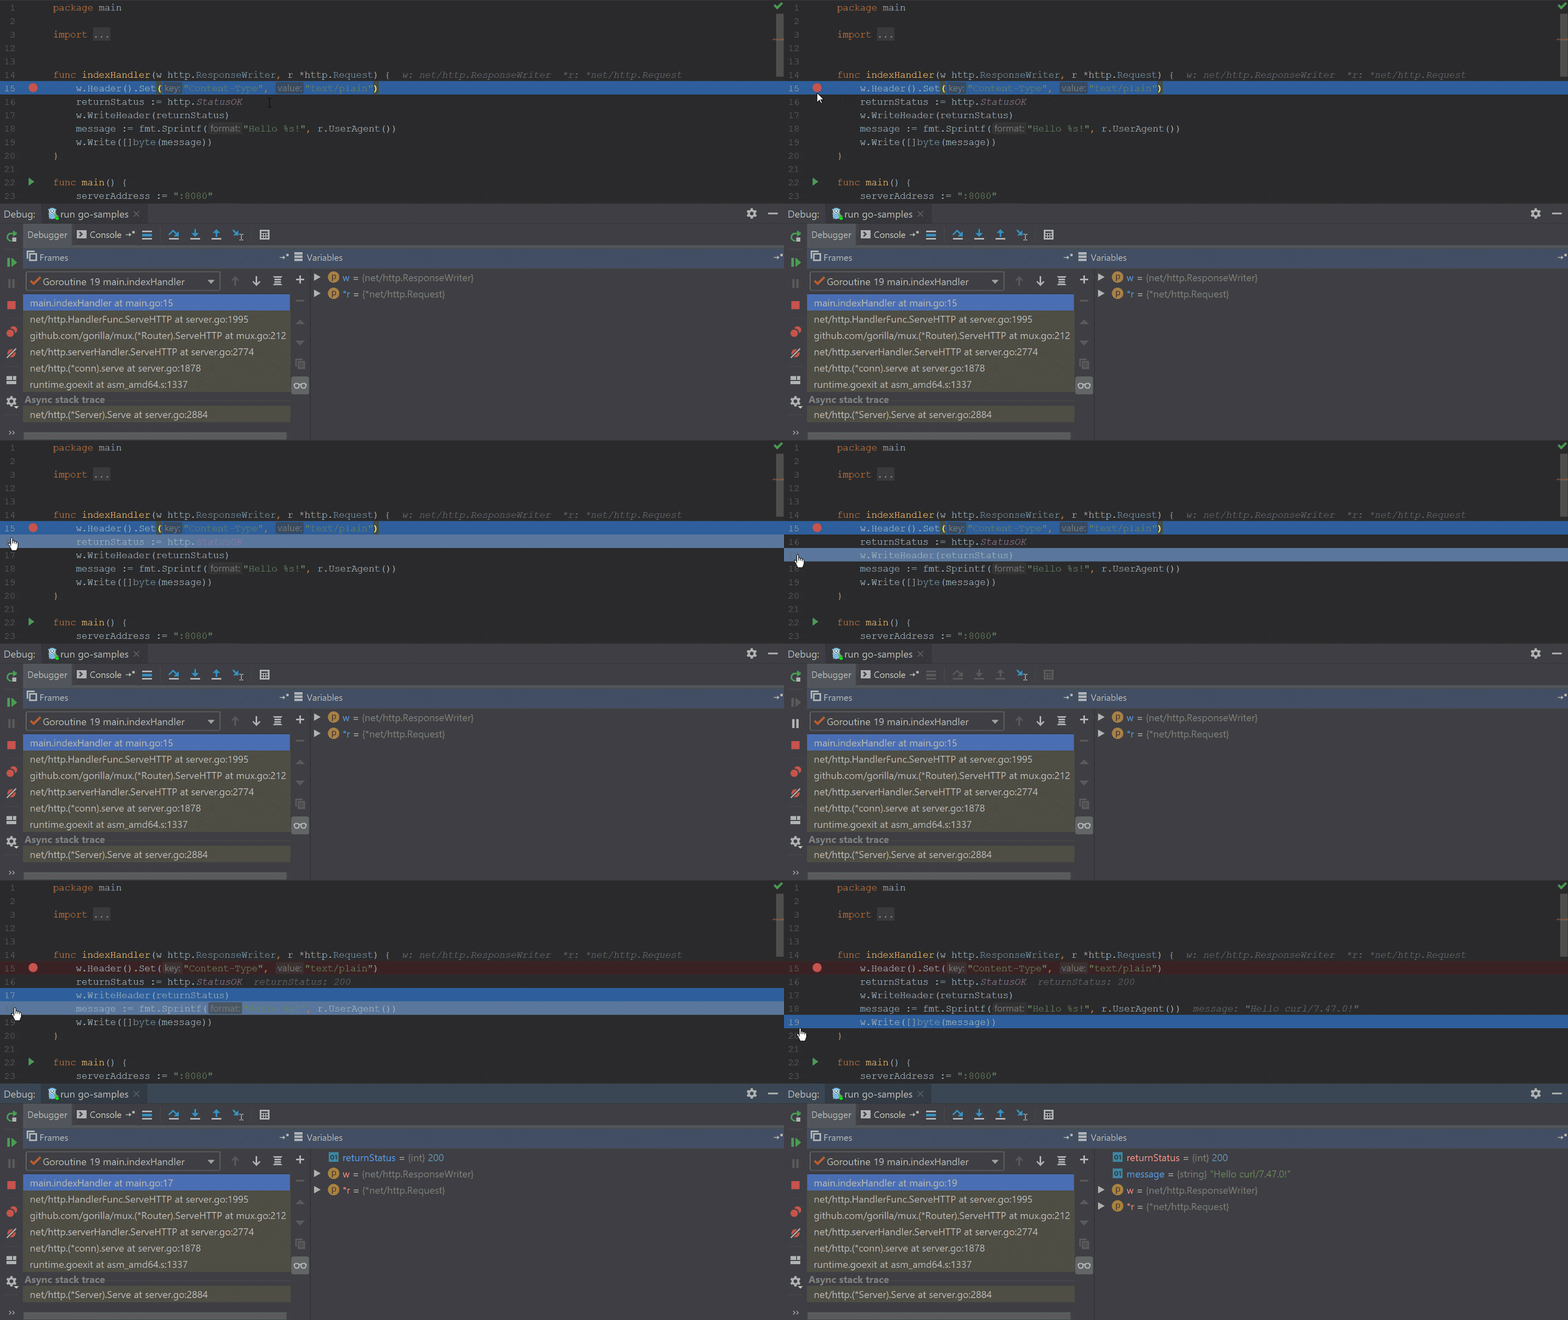
Similarly, there may be cases where we might want to skip over a few lines of code that we have previously analyzed. This can be done in two ways. Either you can use the Run to Cursor feature via keyboard shortcuts, or you can use your mouse cursor to perform this action. The way it works is that you can hover your mouse over a line number on the left side of the editor gutter, and when you are at the location you want to jump to, click on the line number, and the debugger will execute the code up to there.
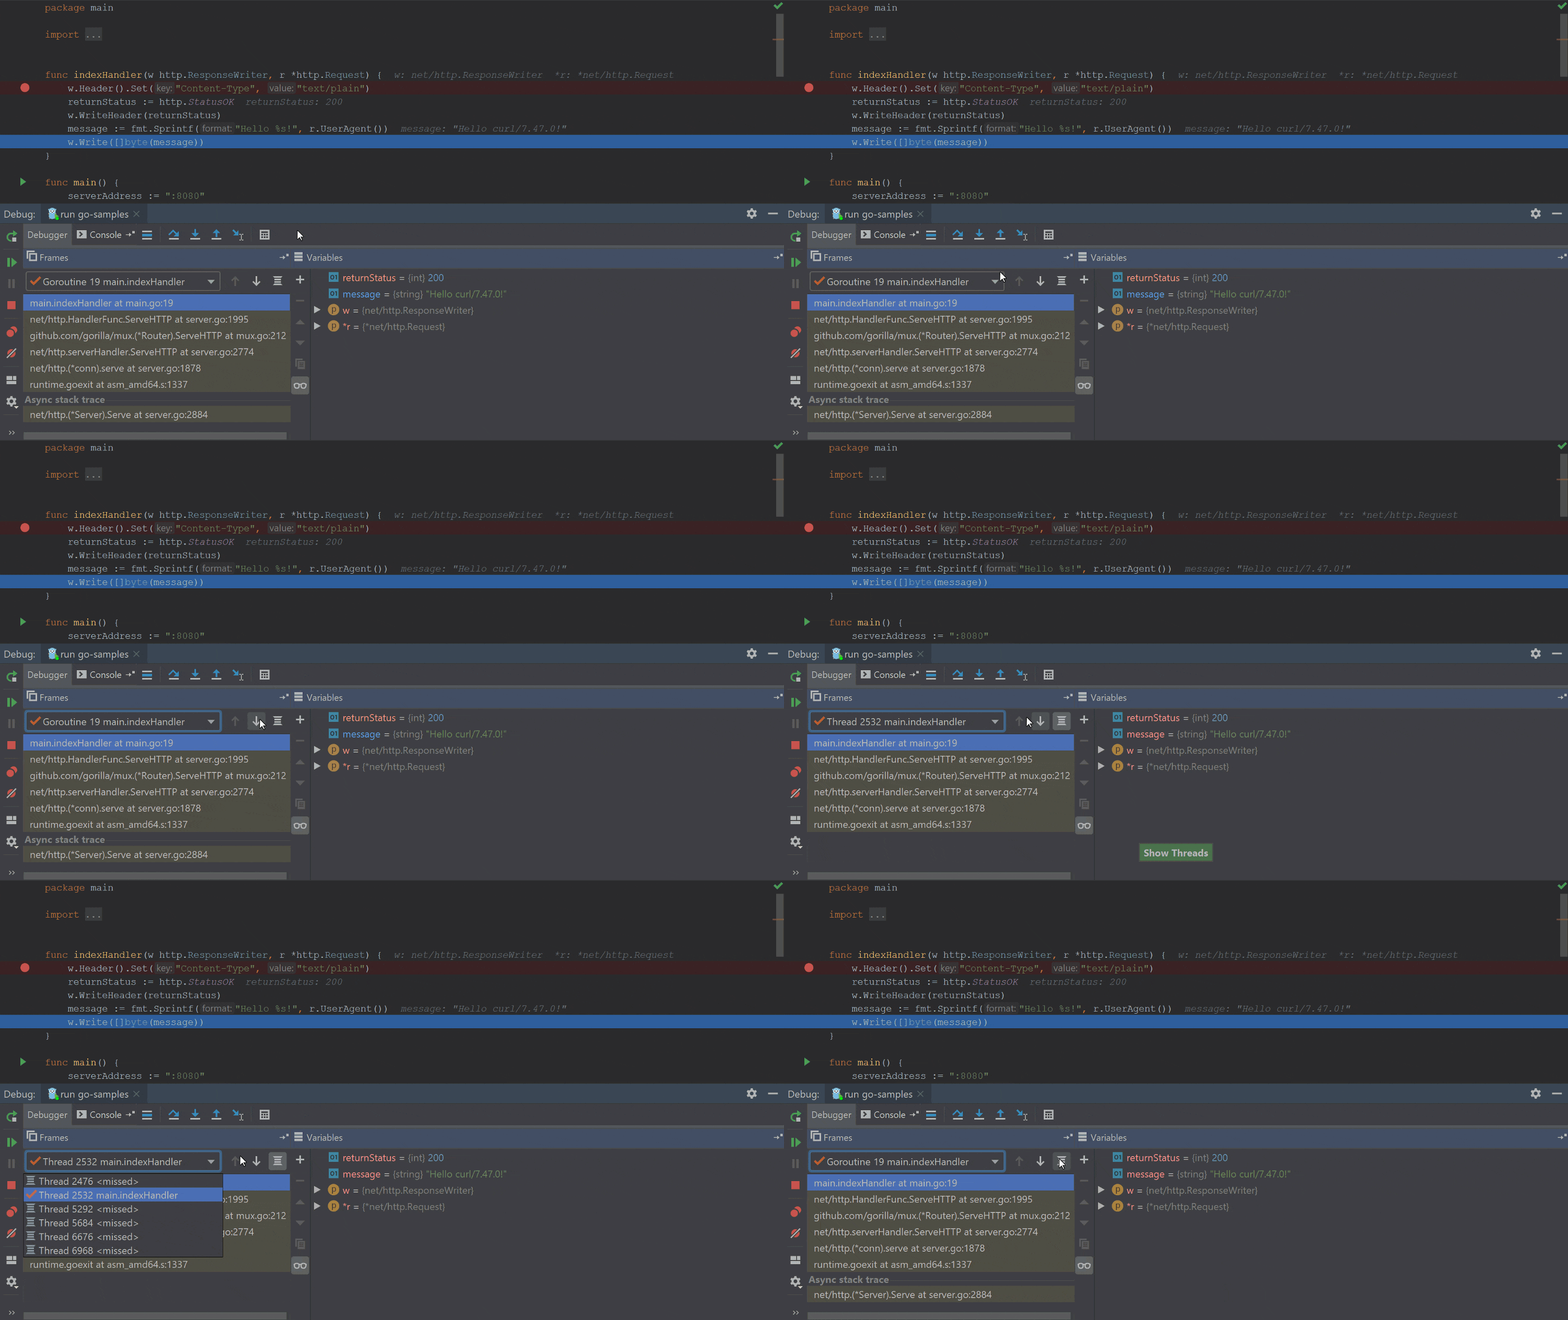
Besides controlling the execution flow in an application, a debugger also helps us to see what’s happening in the application memory by showing us the values of our various variables and constants, and how the application is being executed using either goroutine or threads.
We can toggle the view between goroutines and threads to get a better understanding of how many threads an application is using, or we can get more exact information about what’s running in the application using the goroutines view.
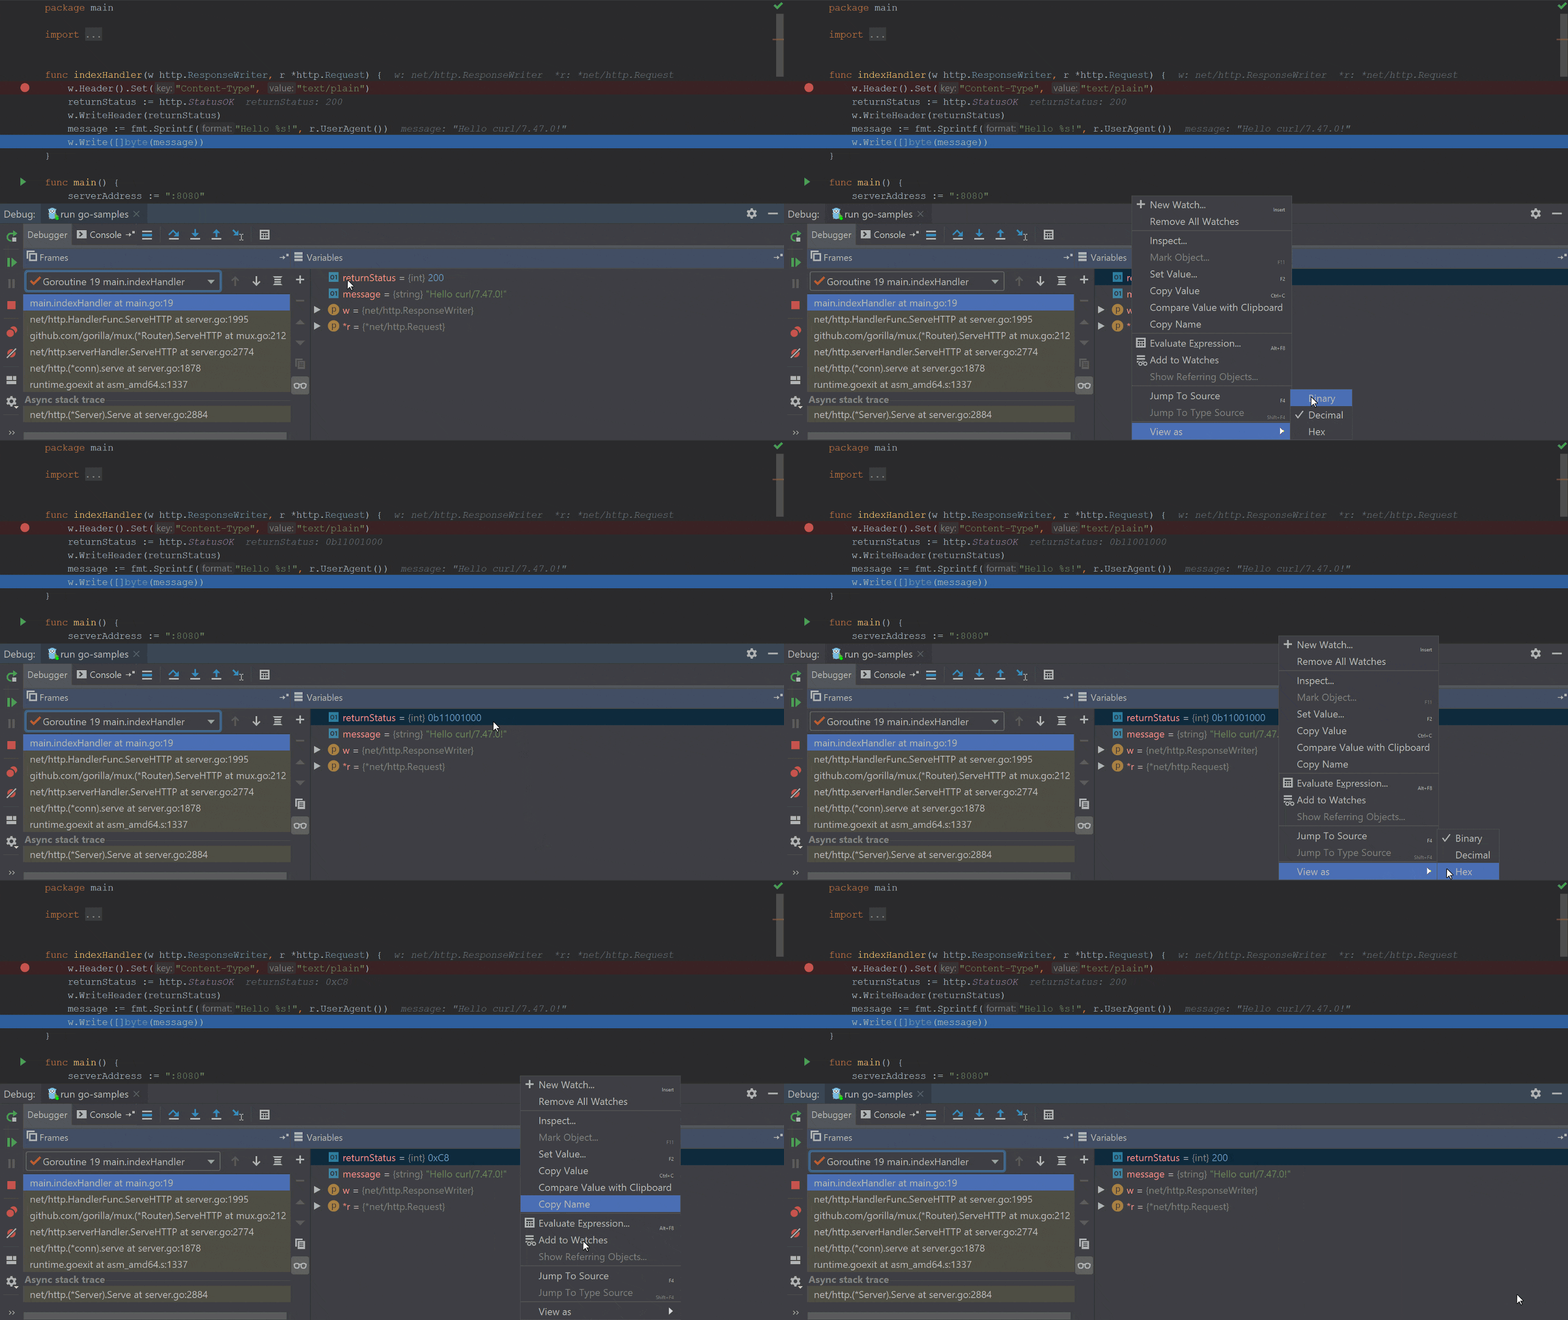
If our data is stored in a format which isn’t easy for us to understand, we can also toggle it so we can get binary, decimal, or hex representations of the int values.
That’s it for today. In the next blog post, we’ll dive into more advanced debugging techniques using core dumps and the powerful Mozilla RR reversible debugger.
As always, please let us know if you have any feedback for us in the comments section below, or using one of our channels such as Twitter, or our issue tracker.
