TeamCity
Powerful CI/CD for DevOps-centric teams
Monitor Your TeamCity Builds with Datadog CI Visibility
This article was originally written by Nicholas Thomson and Kassen Qian of Datadog and published on the Datadog blog.
As the complexity of modern software development lifecycles increases, it’s important to have a comprehensive monitoring solution for your continuous integration (CI) pipelines so that you can quickly pinpoint and triage issues, especially when you have a large number of pipelines running.
Datadog now offers deep, end-to-end visibility into your TeamCity builds with the new TeamCity integration for CI Pipeline Visibility, helping you identify bottlenecks in your CI system, track and address performance regressions, and proactively improve the efficiency of your CI system.
Making data-driven decisions to increase the performance and reliability of your pipelines will help you improve end-user experience by allowing your team to push code releases faster and with fewer errors.
In this post, we’ll show you how to:
- Integrate TeamCity with CI Visibility
- Investigate pipeline failures to fix erroneous builds
Integrate TeamCity with CI Visibility
To configure the TeamCity integration with Datadog CI Visibility, first download the Datadog CI plugin on the TeamCity server. Then, ensure that the last build of your build chains is a composite build. Build chains in TeamCity map to pipelines in Datadog, and individual builds map to pipeline executions.
Add the following parameters to your project:
- datadog.ci.api.key:
your Datadog API key - datadog.ci.site: datadoghq.com
- datadog.ci.enabled: true
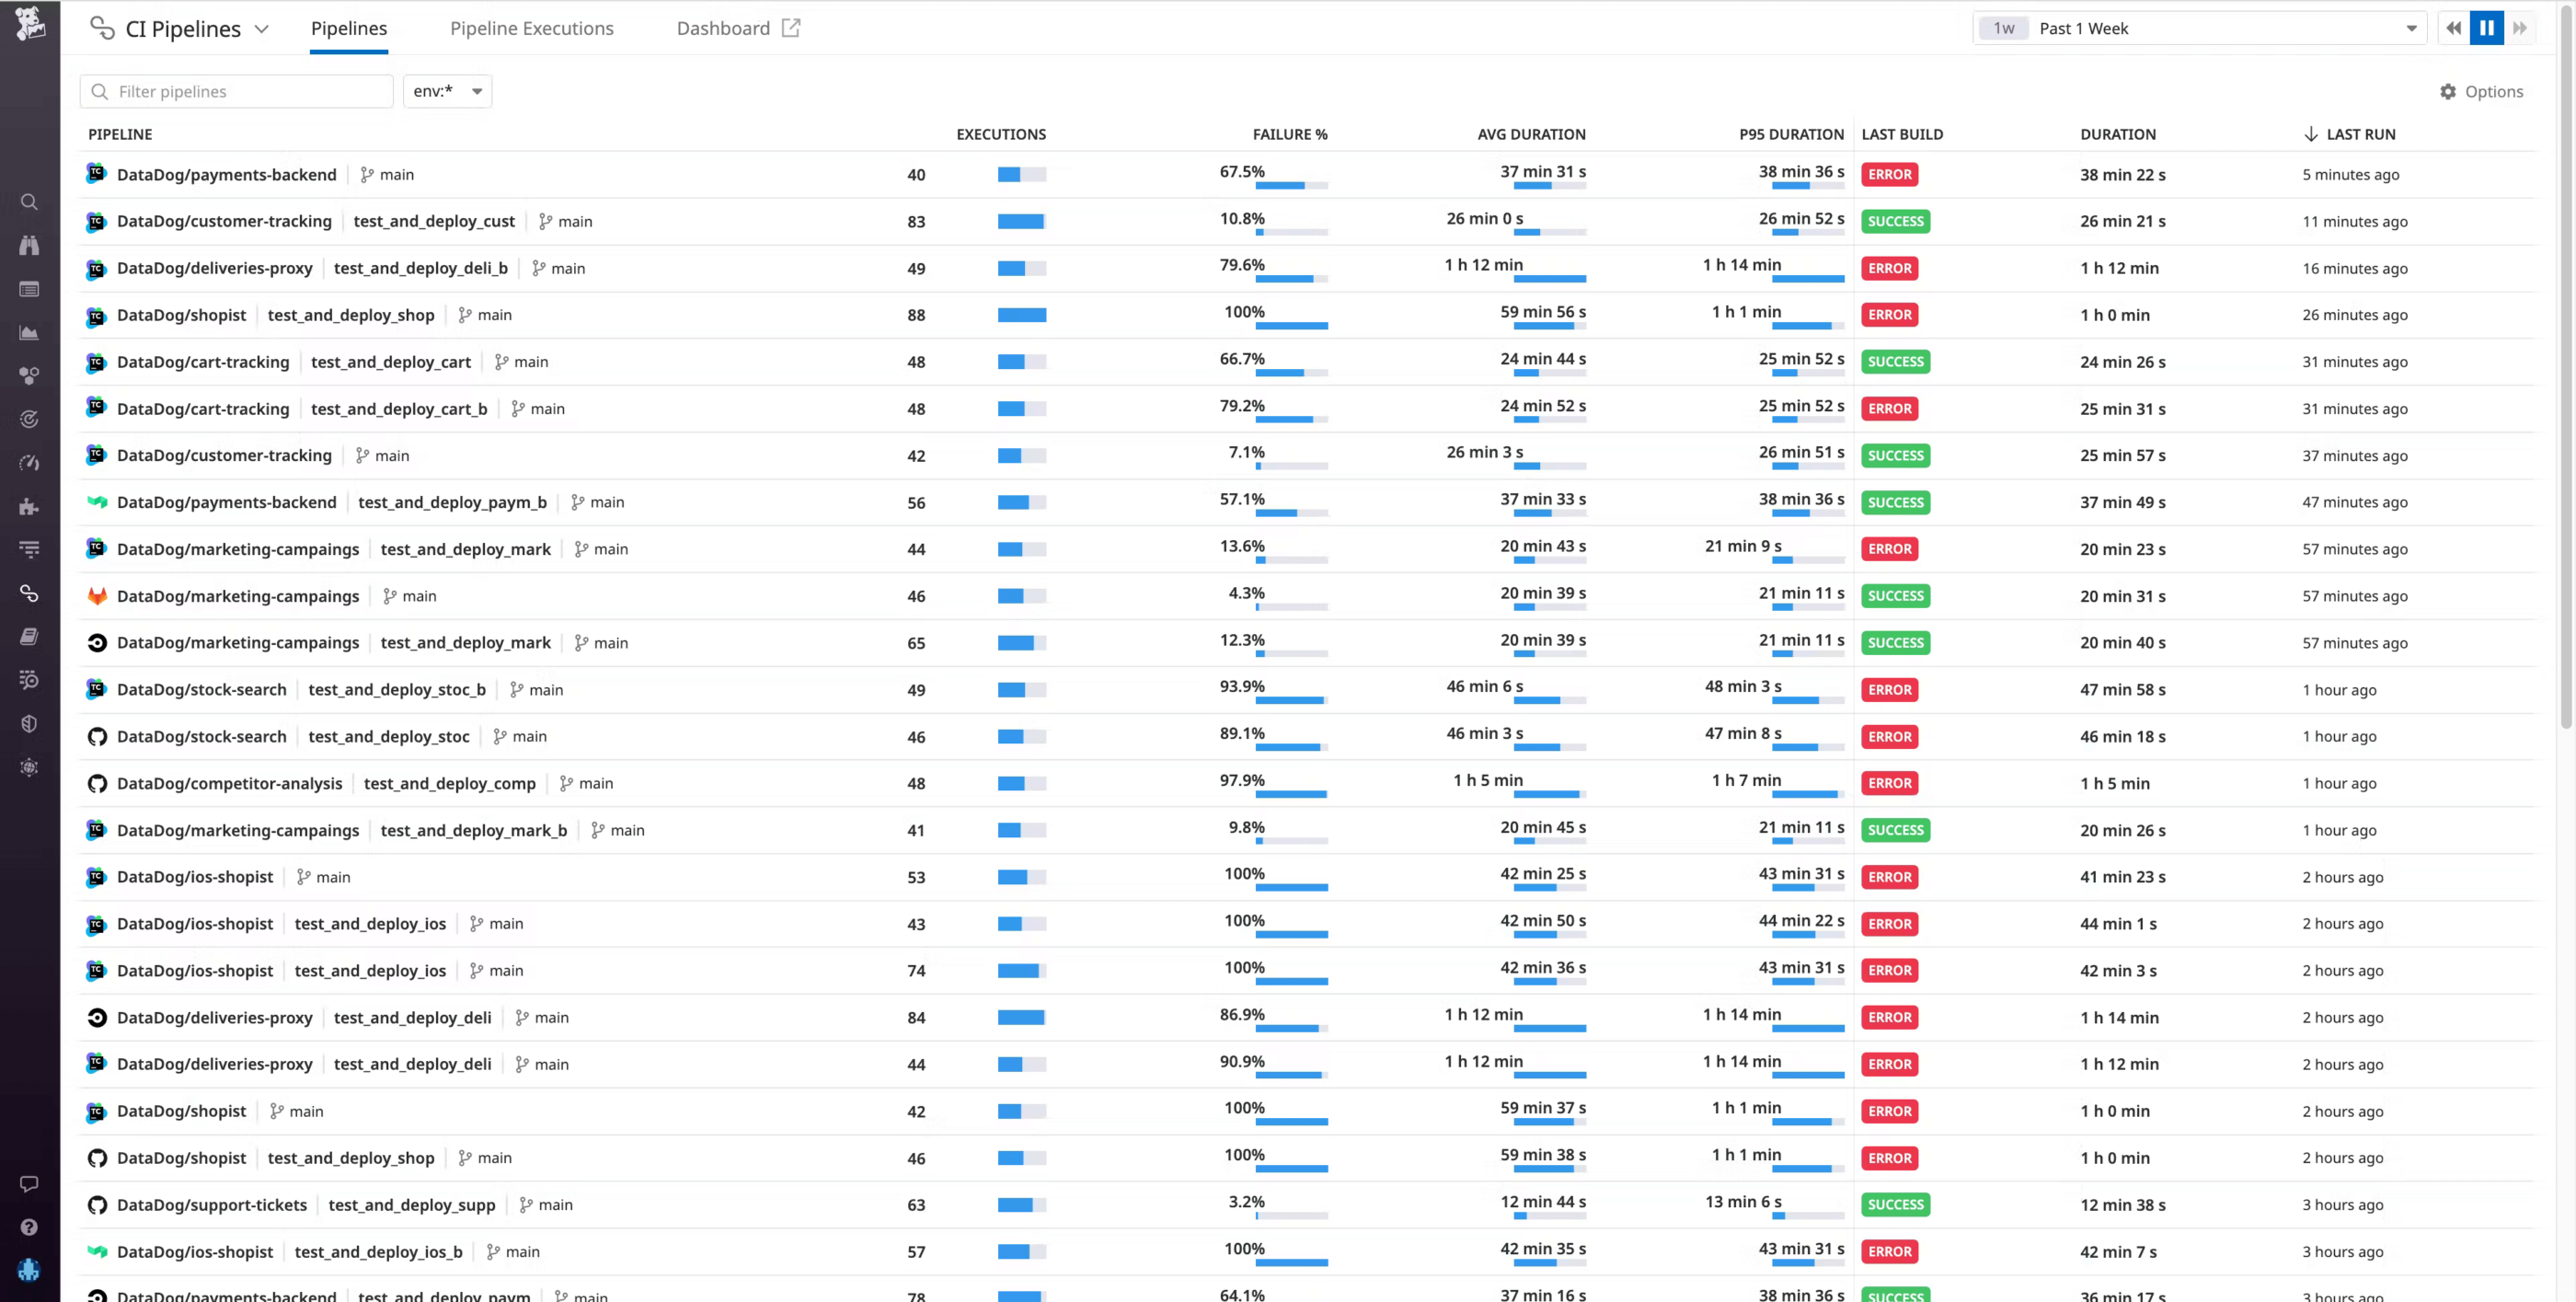
Once you’ve enabled the integration, data from your TeamCity pipelines will automatically flow into Datadog. If you navigate to the Pipelines page, you can see TeamCity pipelines alongside any other providers you may have instrumented with CI Visibility.
Investigate pipeline failures to fix erroneous builds
After you enable the TeamCity integration in CI Visibility, you can use the Pipeline overview page to get a high-level view of the health and performance of your TeamCity build chains, with key metrics such as executions, failure rate, build duration, and more.
Say you’re an engineer at an e-commerce company where one of the checkout services for your primary application is undergoing a major revamp under a tight deadline. After pushing new code, you notice that your builds are extremely slow—much slower than normal. You can go to the Pipelines page in CI Visibility to confirm if your particular pipeline is experiencing high build durations. Then, you can click on the build chain from the Pipeline overview page to investigate the pipeline in more detail.
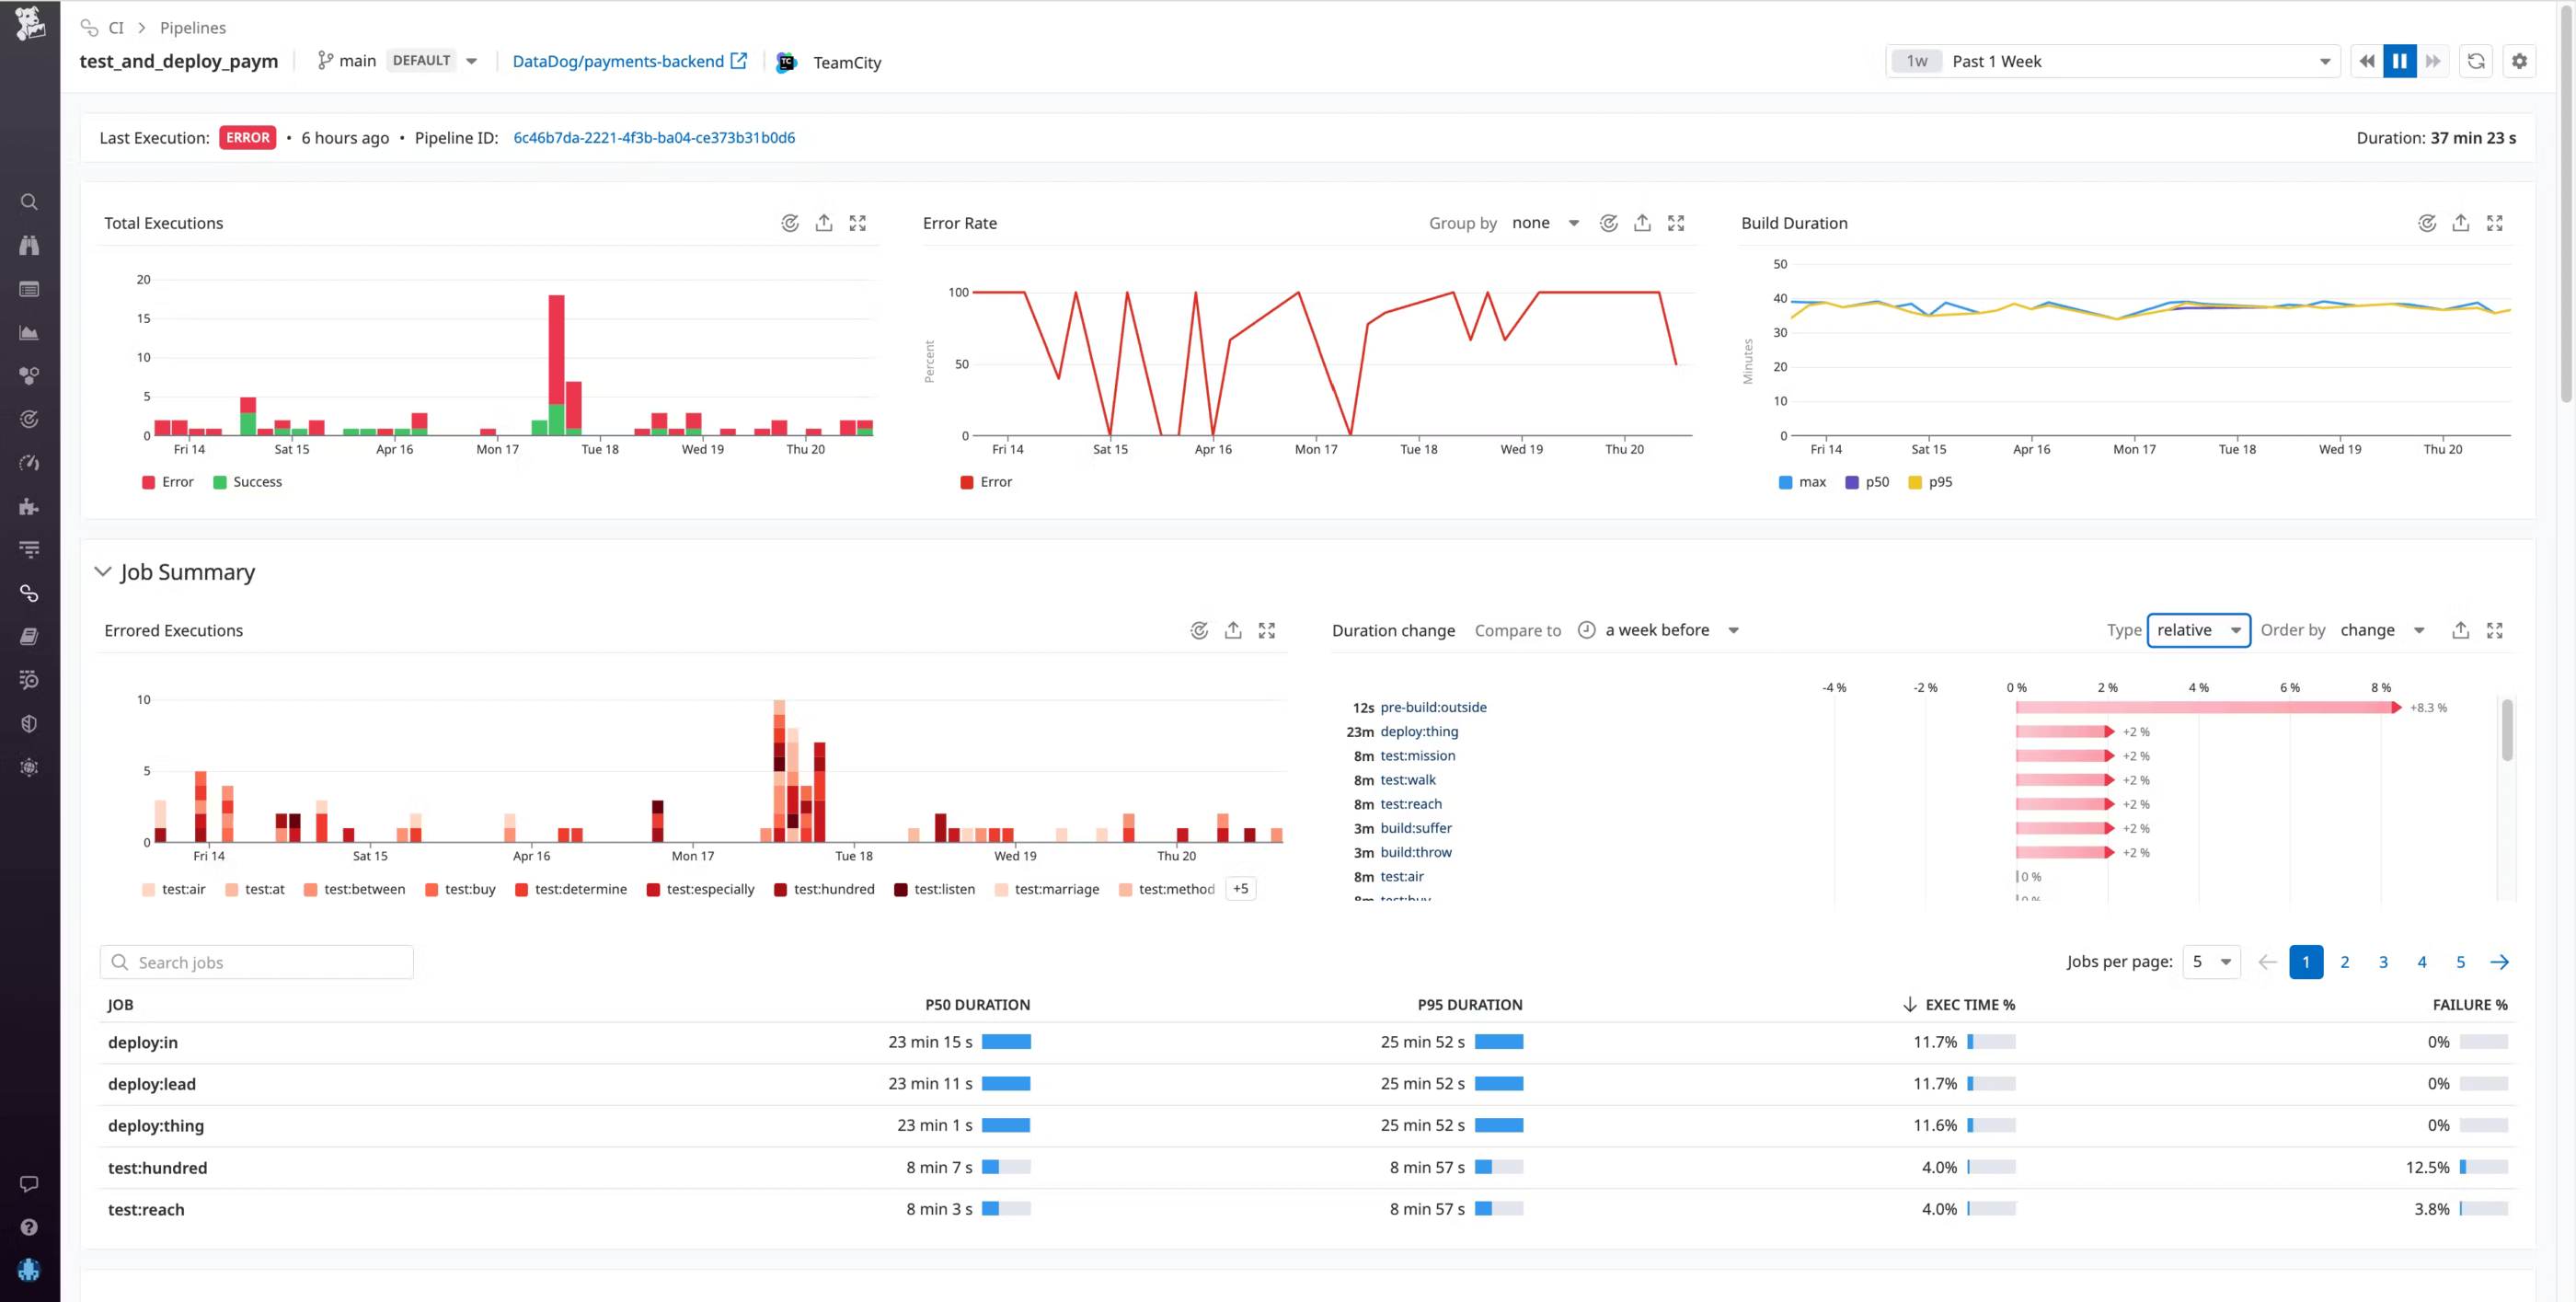
At the top of this Pipeline Detail view, you can see the status of the last build, with a link to the build chain in TeamCity. Below that are timeseries widgets illustrating the total number of builds, the error rate, build duration, and other key metrics that can help you determine when the build chain began to experience errors. In this case, you see the error rate spiking repeatedly over the past several days.
The Job Summary gives you more granular information about your build chain, such as which specific jobs in this pipeline failed the most, which ones took the longest, and which jobs have experienced performance regressions compared to the previous week. Information like this can help you identify the areas in your CI system where optimization will result in the greatest performance gains.
To investigate further, you can scroll down to see the individual builds for this pipeline. If you click on an execution, you can see a flame graph view that visually breaks down the pipeline execution into the individual jobs that ran sequentially and in parallel.
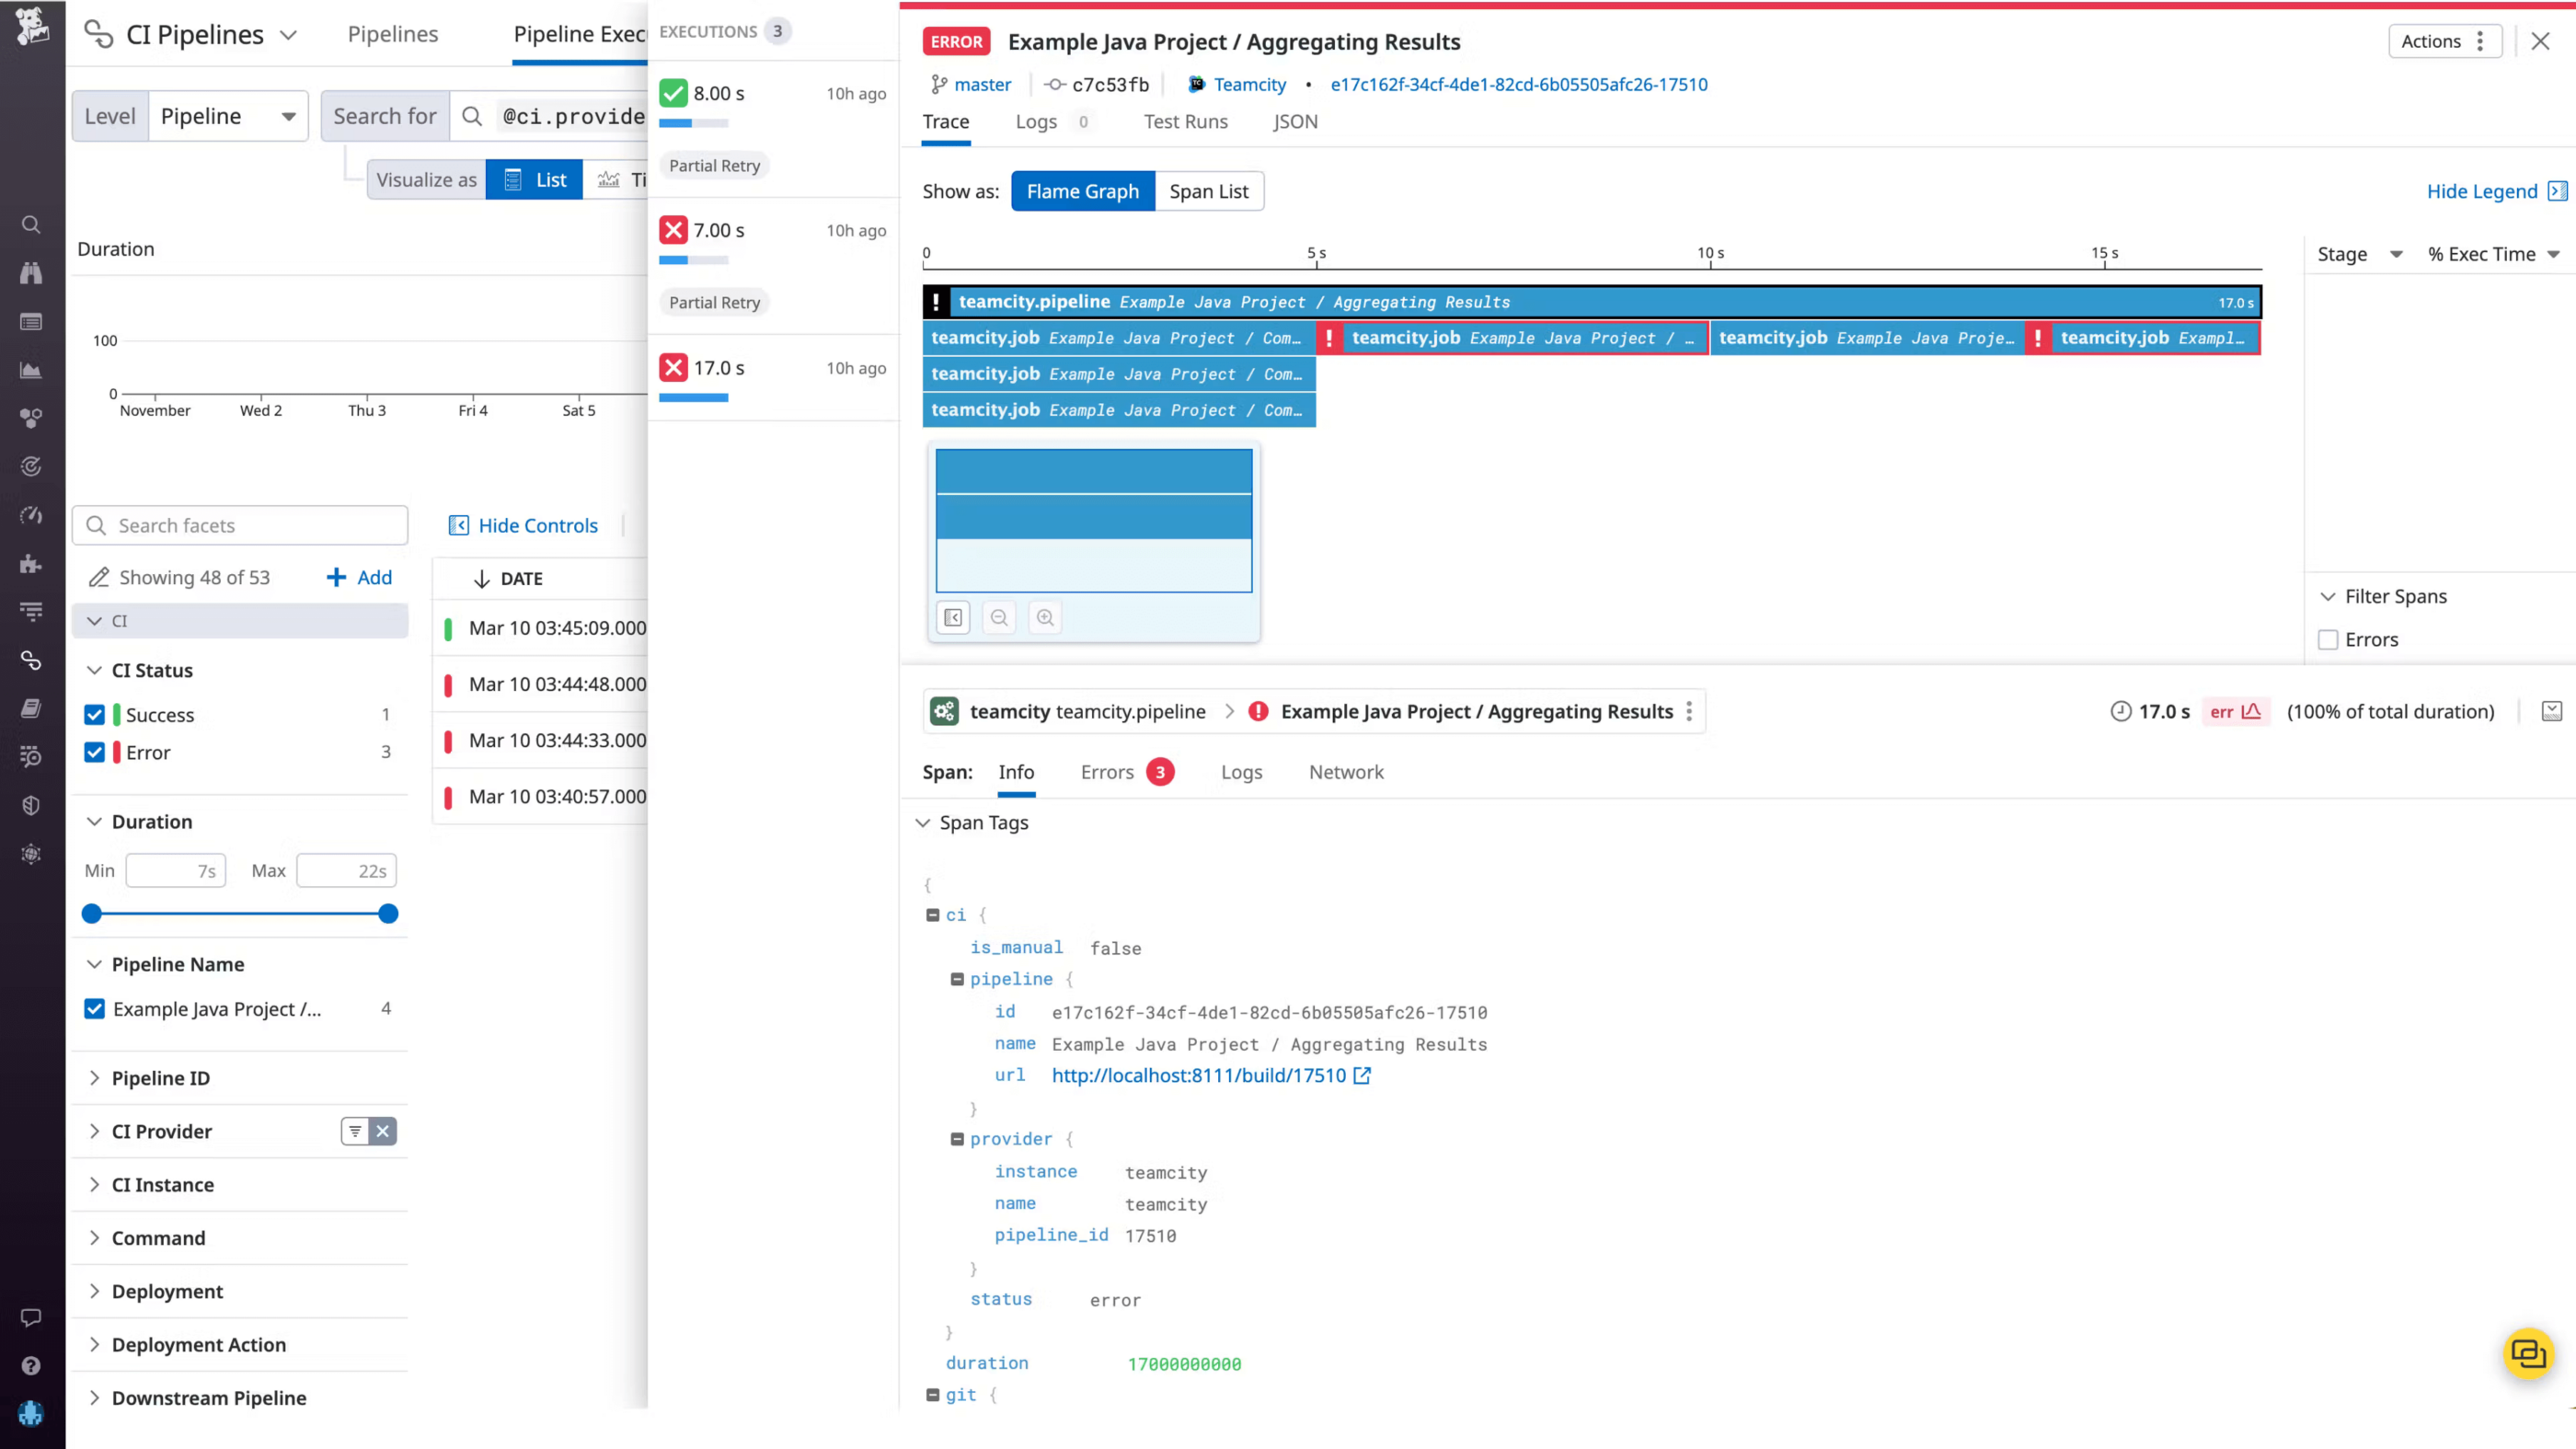
The flame graph shows you each build’s respective duration broken down by job and, if the build was erroneous, the exact parts of the build that failed. This can help you pinpoint problematic jobs that may be at the root of a failed build.
The Info tab shows you repository and commit information along with other git metadata, so you can easily see the source of each build. To investigate further, you reach out to the team member who pushed the commit for this build and discover that the issue is caused by a typo. (We strongly recommend that customers use a TeamCity username style that contains author email, so that Datadog can automatically detect git author email addresses and correlate commit information to pipeline data.)
Once resolved, the build chain functions without error so you can build and test successfully, and release your updated checkout service to customers on time.
Understand and optimize TeamCity build chain performance
CI Visibility support for TeamCity is now generally available, giving you deep visibility into your build chains so you can troubleshoot failed builds, identify performance regressions faster, and increase your release velocity.
For more information, see the Datadog documentation and blog post on the TeamCity Agent integration.
If you’re new to Datadog, sign up for 14-day free trial.
Subscribe to TeamCity Blog updates


