IntelliJ IDEA
IntelliJ IDEA – the Leading IDE for Professional Development in Java and Kotlin
Debugger Upskill: Debug Without Breakpoints

In a typical debugging scenario, you would set breakpoints to tell the debugger when to suspend your program. A breakpoint usually corresponds to the moment that marks the starting point for further investigation.
Deciding where to set a breakpoint can be challenging. There might be situations where the exact line is unclear, or you might prefer to pause the program based on timing rather than specific code.
In this article, we’ll look at IntelliJ IDEA’s Pause Program feature – a lesser known debugging technique that can be extremely powerful in some scenarios, including the ones described above. We’ll discuss its use cases and limitations, as well as discover the secret stepping trick.
What Pause Program does?
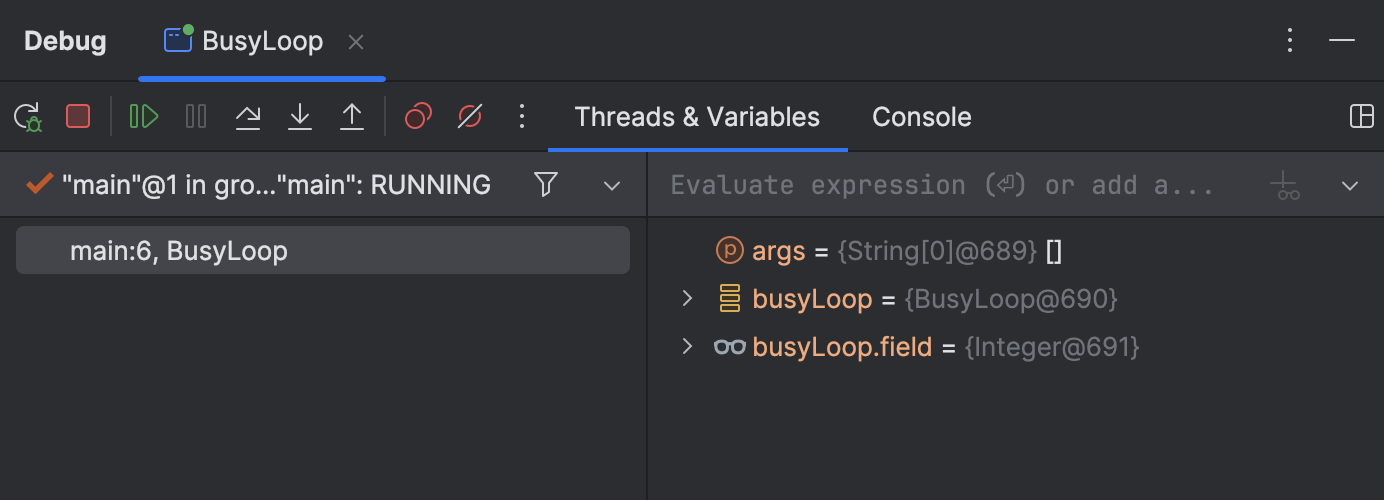
Pause Program is a feature in IntelliJ IDEA’s debugger that enables you to arbitrarily suspend your application at any given point in time. What’s more, you don’t even have to be familiar with the application code. In fact, you can just ignore it altogether!
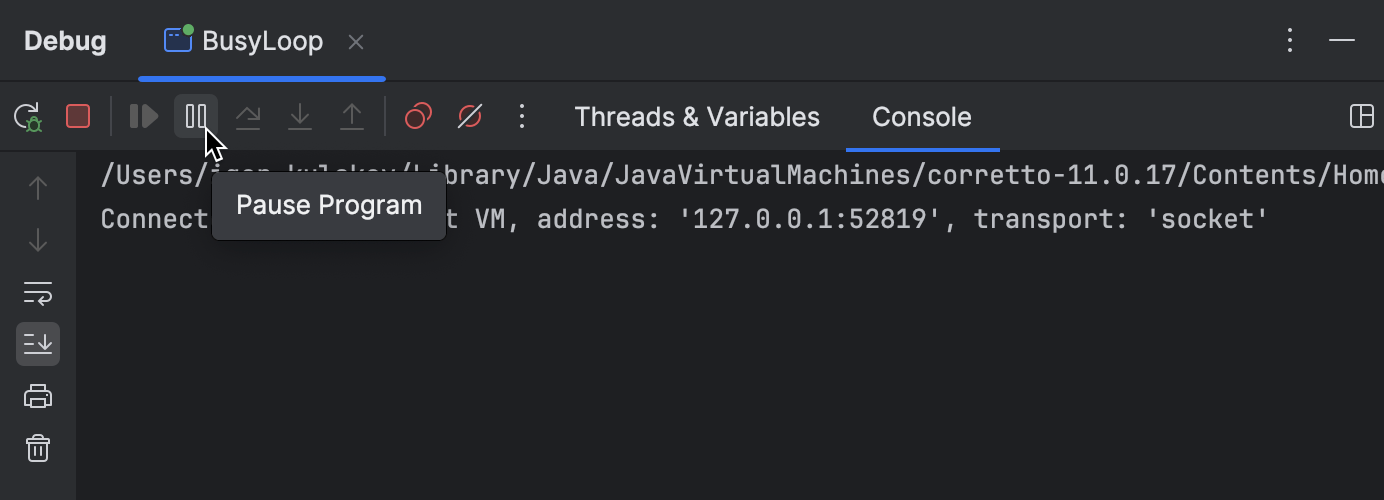
To pause a program, click Pause Program on the debugger’s toolbar. Then, the program will suspend right in the middle of whatever it’s doing.
Limitations
At first sight, a paused program may look exactly like the one that has been suspended at a breakpoint. However, this is only true to a certain extent.
It would be correct to consider Pause Program a sort of enhanced thread dump. You can still inspect variables and threads just as you typically would, but some of the more advanced debugging features, like Evaluate Expression, won’t work.
Use cases
There are countless ways you can use Pause Program, which can often be used interchangeably with traditional breakpoints. However, there are scenarios where using Pause Program is a more fitting approach. Let’s consider a couple of them.
Unresponsive apps
If the UI freezes or seems unresponsive, it’s usually because the UI thread is blocked or busy with a time-consuming task.
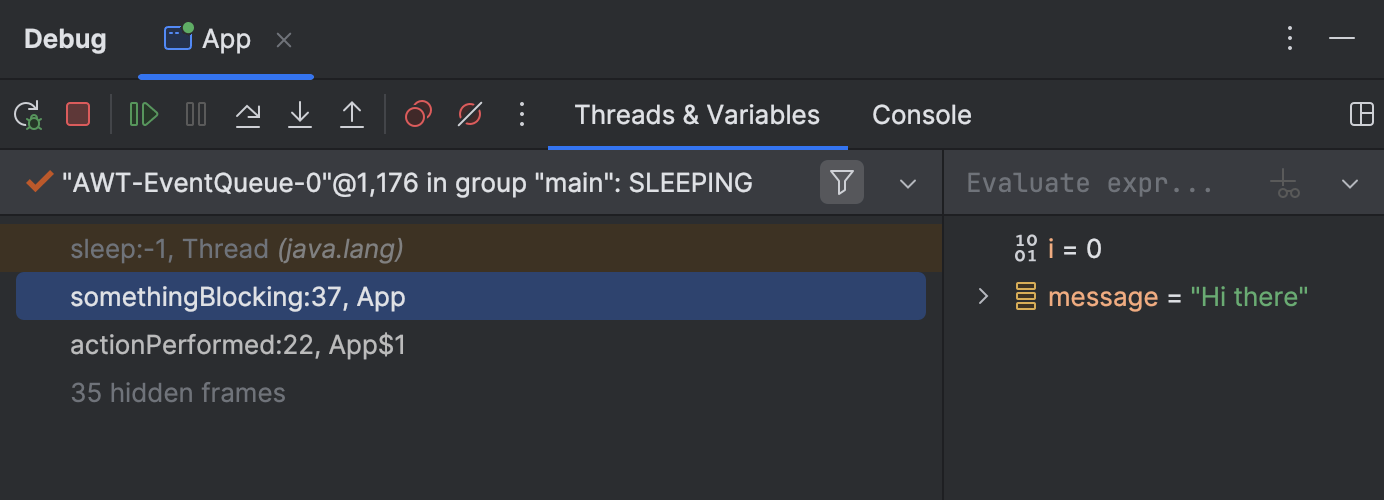
Pause Program could be useful in both those cases, as it allows you to pause the application while it’s unresponsive and examine the call stack of the UI thread. This is often sufficient to diagnose the problem.
Missing sources
As previously mentioned, Pause Program allows you to simply ignore the source code, which might be missing for you anyway. Although this scenario is not very common, when you do encounter it, breakpoints wouldn’t be of any help. That’s where Pause Program comes in!
Locks
If you suspect a synchronization problem, such as a deadlock or a livelock, Pause Program might help you find the exact threads and locks causing the issue.
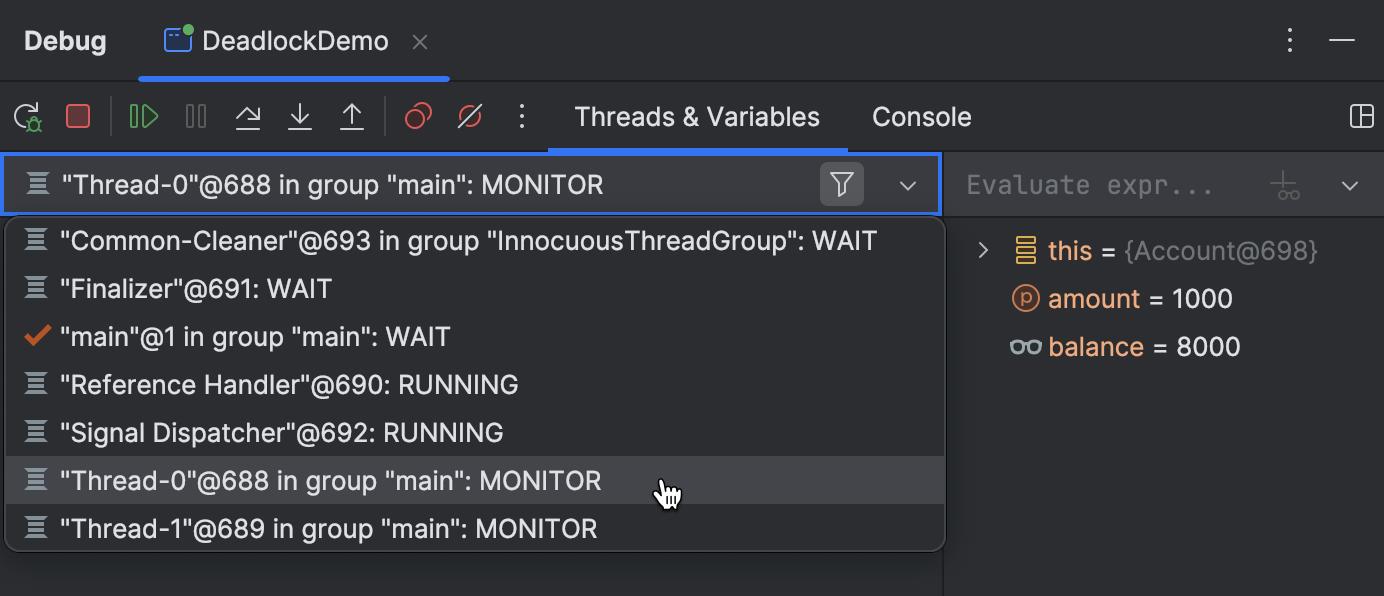
In this case, pause the program and inspect the thread list. It will show which threads are blocked. By navigating to the execution point, you’ll also see the critical sections they are locked in. This information might help guide you toward a solution.
Secret stepping trick
As we pointed out earlier, Pause Program indeed limits your access to some of the advanced debugger features. If you’ve tried to use certain features while an application is paused, you may have seen an error message that reads Cannot evaluate methods after Pause action.
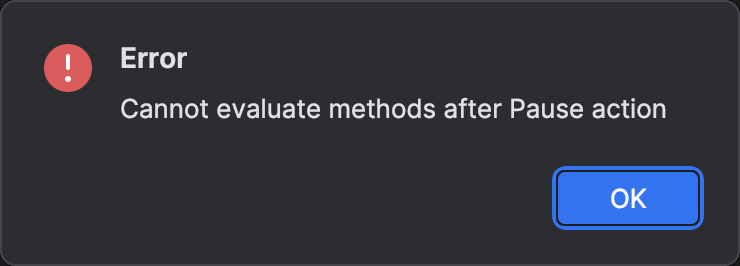
Nevertheless, there is a workaround for this restriction.
After you have paused an application, proceed by performing any stepping action. A simple Step Into or Step Over will do. Once that’s done, you’ll find yourself in a regular debugging session, similar to when you suspend an application using a breakpoint.
All advanced features are now unlocked!
Conclusion
That’s it for today! We hope you find these tips and tricks useful.
If there’s something specific about Java debugging you want us to cover, don’t hesitate to reach out! Your feedback will help in prioritizing and publishing the content that is most interesting and valuable to you.