Feature Spotlight: Python Debugger and ‘Attach to Process’
Happy Friday everyone,
Today I’d like to highlight some recent changes and improvements in PyCharm`s Python debugger and explore the brand new attach to process in more detail.
Previously PyCharm used a special fork of the PyDev debugger with some PyCharm-specific changes, as well as our own unique features like GEvent debugging and breakpoints at Django templates. Before releasing PyCharm 4, we decided to contribute to open-sourced software and merged our debugger code with that from the original PyDev repository. Now the work on the debugger continues from both sides (PyCharm and PyDev) in one place. The merged source code now lives at https://github.com/fabioz/PyDev.Debugger and pull requests are greatly appreciated!
As a result of the unification and the work done since PyCharm 3.4, the debugger in PyCharm 4 has grown more powerful. We’ve added the Referring Objects view, Jinja 2 templates debugging, and other small improvements. Still, the most notable debugger feature introduced in PyCharm 4 is attach to process.
Using this feature you can connect the PyCharm debugger with any running Python process and debug in the attached mode.
Note: ‘Attach to Process’ functionality is available in both PyCharm Community Edition and PyCharm Professional Edition starting with v4.0. This feature is supported on all Windows, Linux and Mac platforms.
Let me show you how it works.
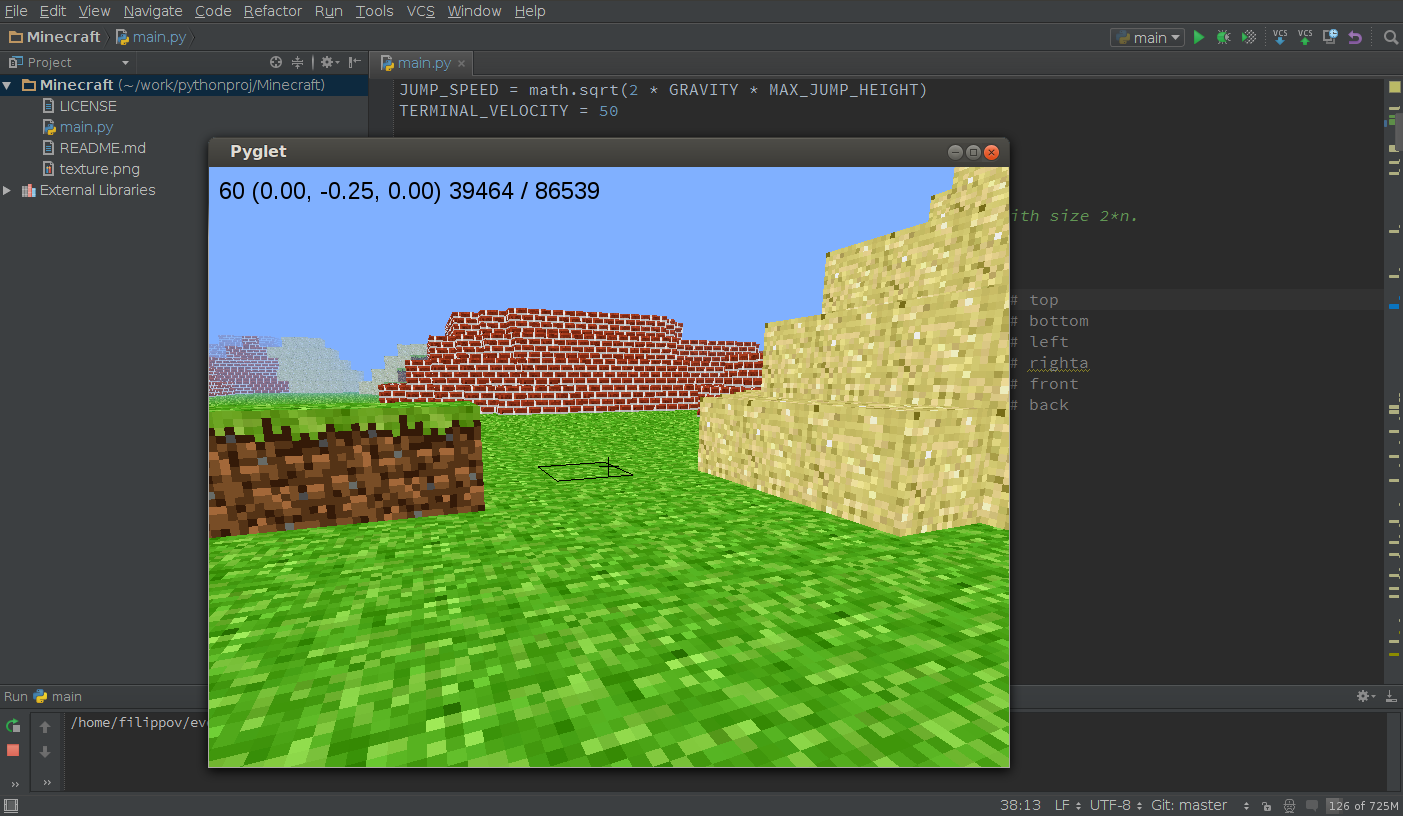
Say we have some long running application that we want attach to. In my example I’ll use a simple graphical Minecraft-inspired application that I found on GitHub.
I have opened the project in PyCharm and launched it using standard run/debug configurations:
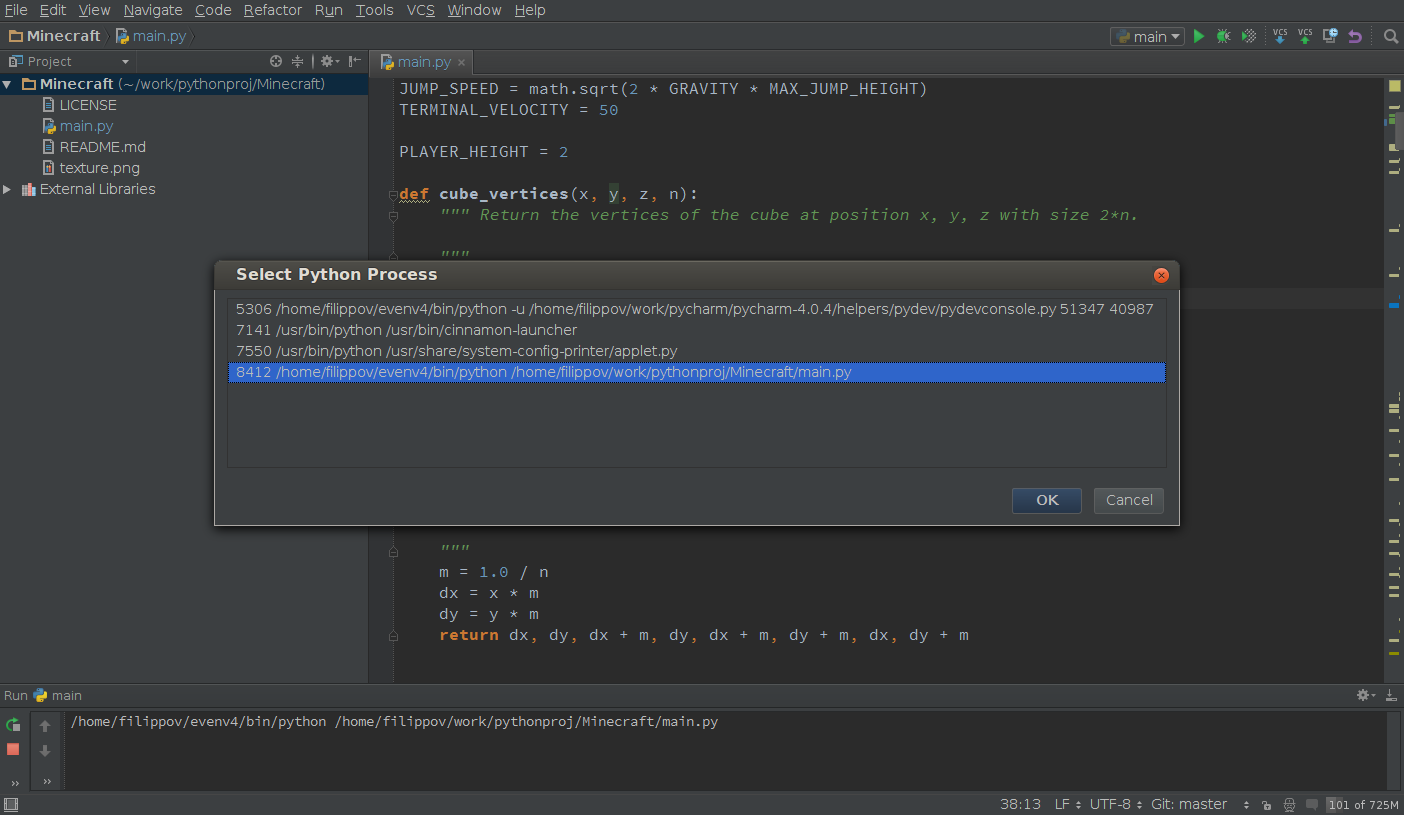
The project is running, so now I can attach the debugger to it. For that I go to Tools and select Attach to Process. PyCharm shows the list of running Python processes in our system. I select the Minecraft process and click OK:
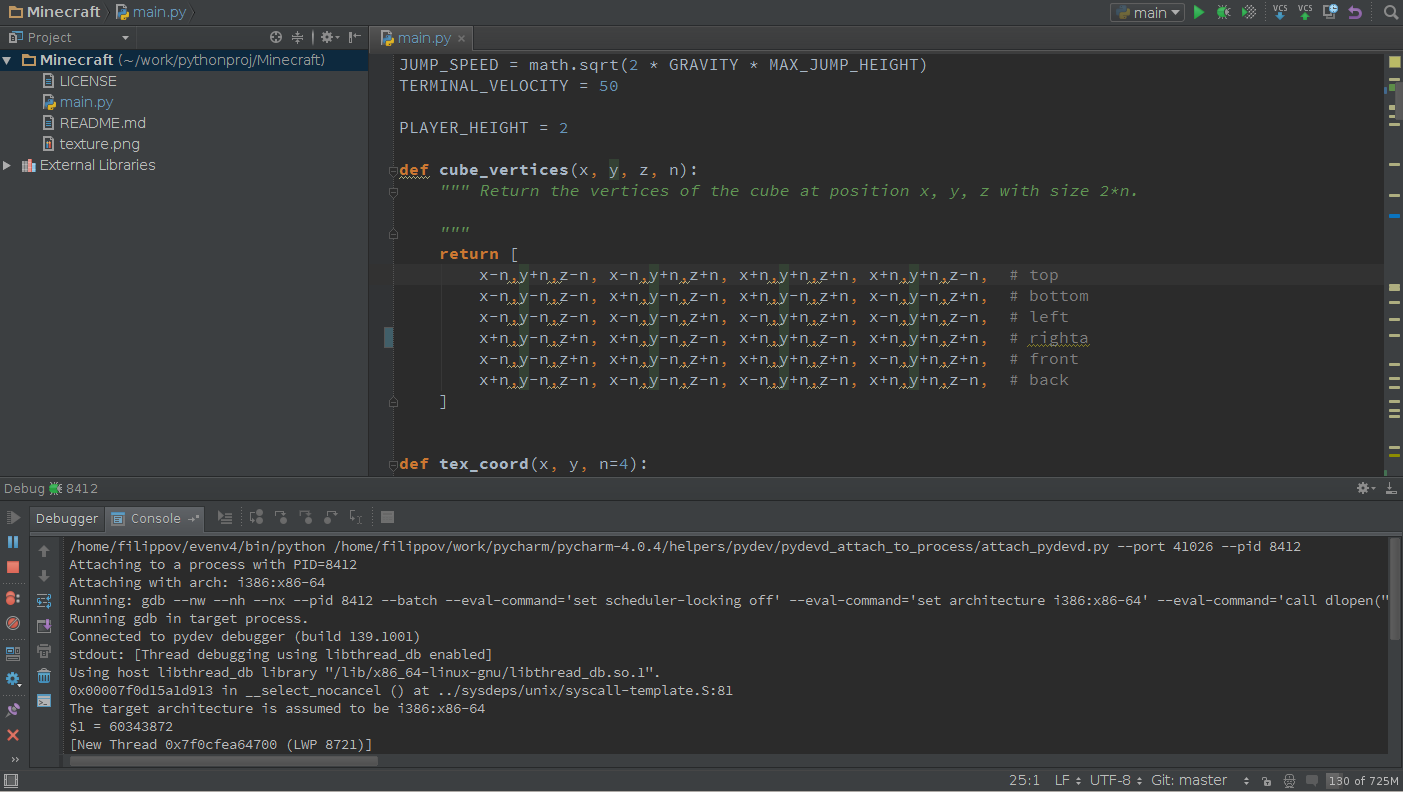
PyCharm automatically shows the debugger console with the message that the debugger has successfully connected to the process:
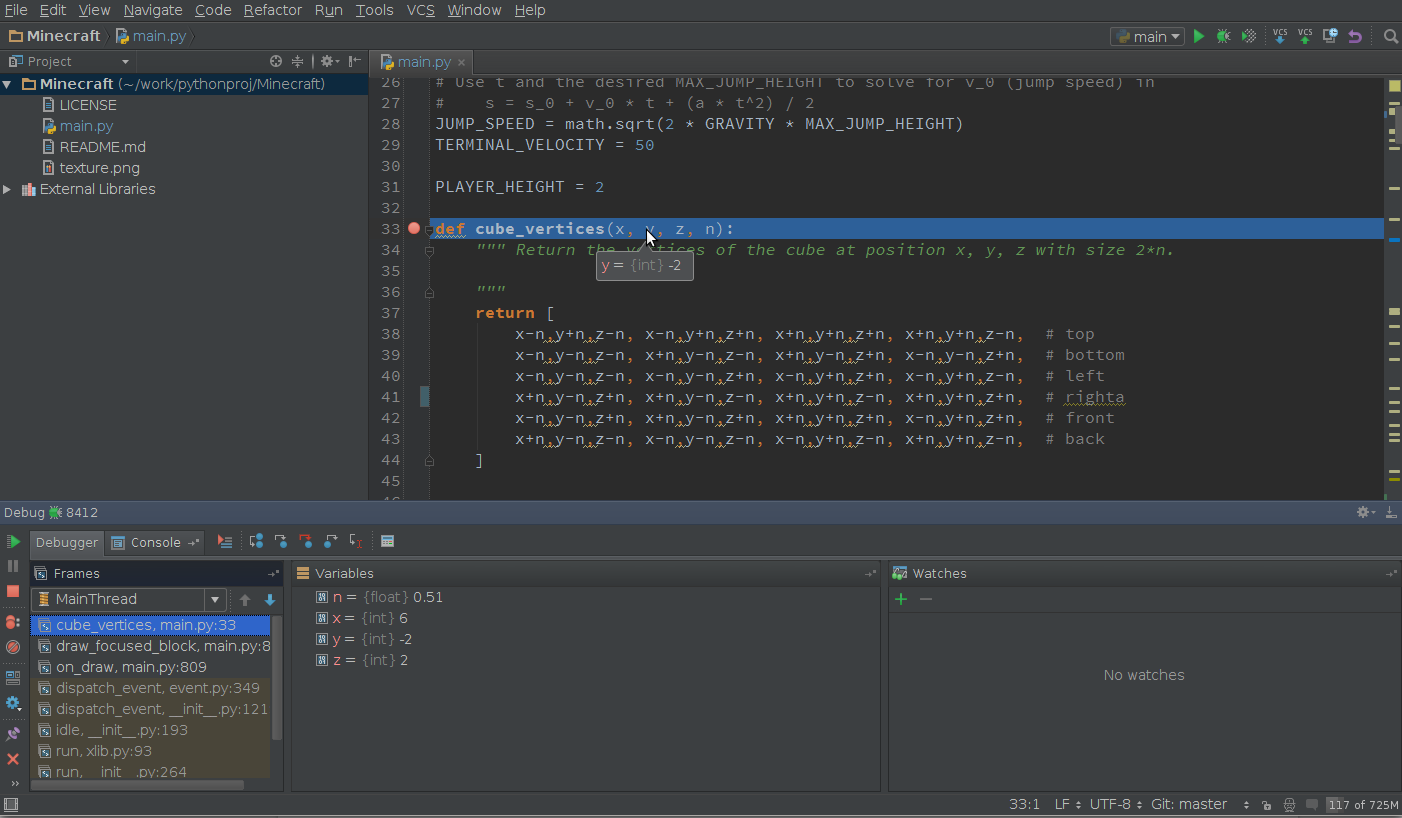
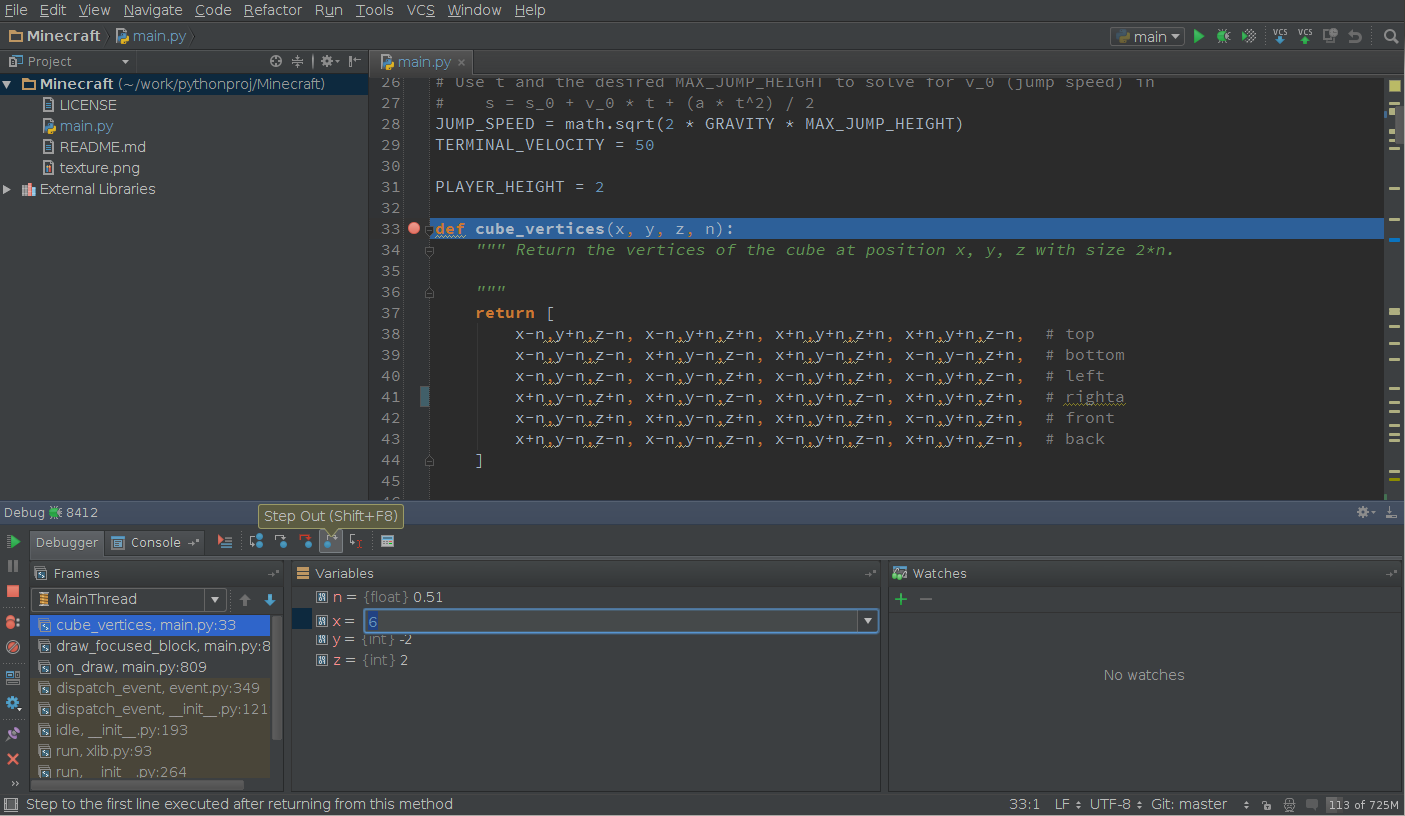
From this point on, debugger works in the attached mode. Let’s make use of it and stop at some line of code. To do that, in the editor I put a breakpoint on the line with some reachable code. In my example I’ve put the breakpoint on the line containing the definition of the cube_vertices function, which is being called a lot. In a few seconds, once the process reaches the breakpoint, PyCharm will stop at the breakpoint and show us the debugger with frames, variables and watches views:
Now we can use the debugger as usual – stepping into/over, pausing and resuming the process, evaluating variables and expressions, and changing the runtime context:
That’s it! Hopefully you’ll appreciate this addition to the new joint-effort PyCharm debugger, along with other handy features introduced in the latest version of PyCharm.
And if you’re craving for yet more details on PyCharm debugger, see this tutorial or the online help.
See you next week,
Dmitry
