TeamCity
Powerful CI/CD for DevOps-centric teams
How to Troubleshoot Builds With TeamCity Dashboards

This article was brought to you by Damaso Sanoja, draft.dev.
If you’re spending your mornings debugging Jenkins pipeline failures, waiting for builds that should take minutes but stretch into hours, or scrambling to identify which plugin update broke your deployment process, you’re not alone. These daily troubleshooting battles with legacy CI/CD systems drain engineering time that could be spent building features and delivering value.
TeamCity’s built-in health signals help you address these everyday struggles head-on by surfacing the root causes of your pipeline problems before they escalate. Instead of hunting through logs to understand why builds fail, you get clear visibility into success rates, build duration trends, and bottleneck identification.
When issues arise, comprehensive test reporting and failure analysis help you pinpoint what broke and why, turning hours of detective work into minutes of targeted fixes.
In this article, you’ll learn how TeamCity’s monitoring and diagnostic capabilities give you the insights needed to maintain stable and fast pipelines and spend more time on what matters most – shipping quality software.
Ensuring stability and quality in every release
Consistently shipping stable, high-quality code is non-negotiable; unstable releases undermine customer trust, inflate support costs, and create compounding technical debt. But how do you know your pipeline is stable and which levers improve quality?
TeamCity’s Statistics Charts offer precise answers that translate complexity into clarity.
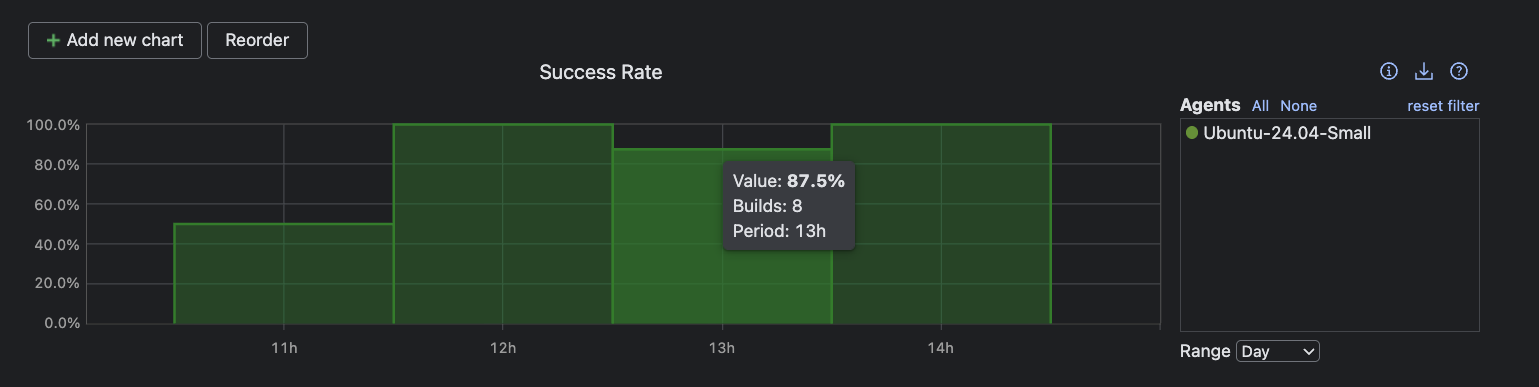
Monitor success rates for continuous stability
Success rate is an important metric of any CI/CD: It tracks the percentage of passing builds over time, spotlighting trends and sudden changes.
High success rates indicate predictable pipelines and effective feedback loops, while dips signal fragility, demanding immediate attention.
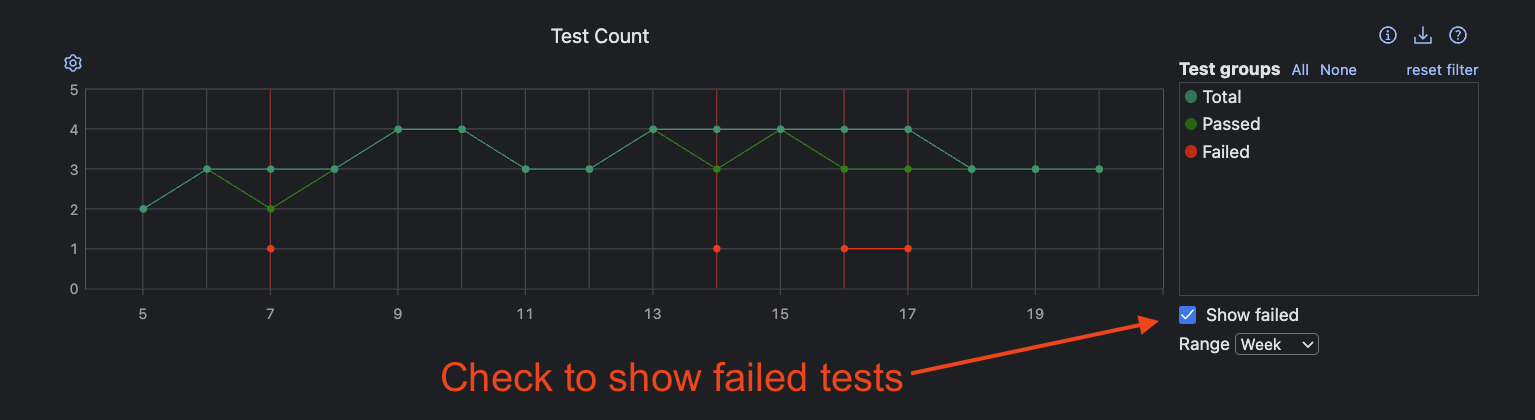
Visualize test failures to diagnose quality risks
Failure rates provide additional insight: While the success rate gives you a pass/fail snapshot, overlaying failed test counts helps pinpoint when and how systemic issues emerge, revealing what releases are more problematic.
In the same Statistics tab, toggle Show failed in the Test Count graph to make test failures visible.
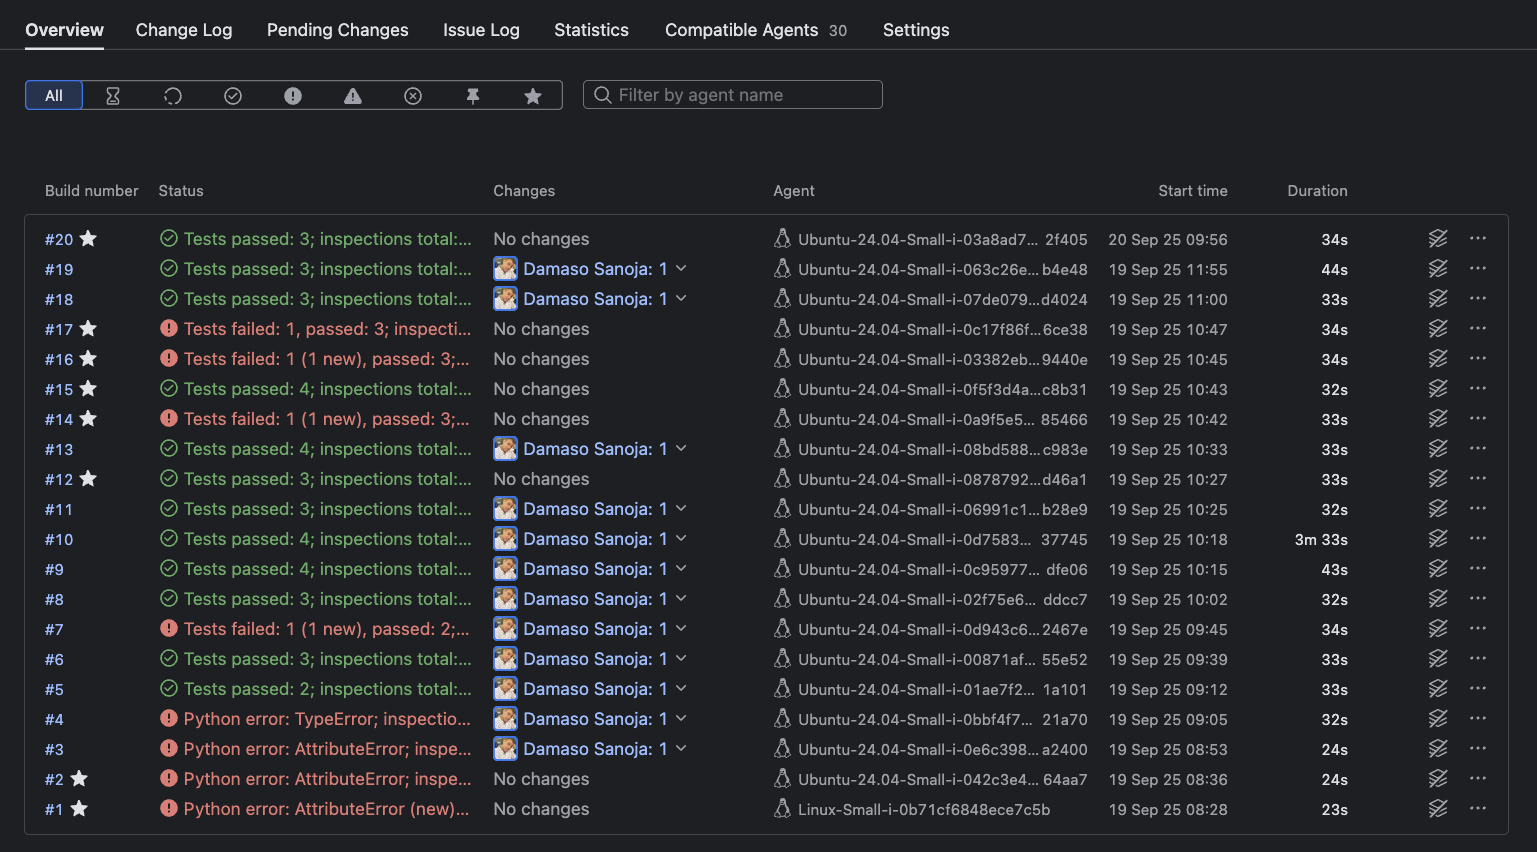
Access high-level failure data in seconds
Rapidly spotting patterns, like back-to-back failures, allows for proactive fixes before technical debt accumulates.
Use the Overview tab for a high-level summary of all builds for a project, listed with their statuses, durations, changes, and failure indicators.
Investigate failures with one click
Click into any build for detailed information regarding the status of every step, their duration, code-inspection results, changes in the code, and more:
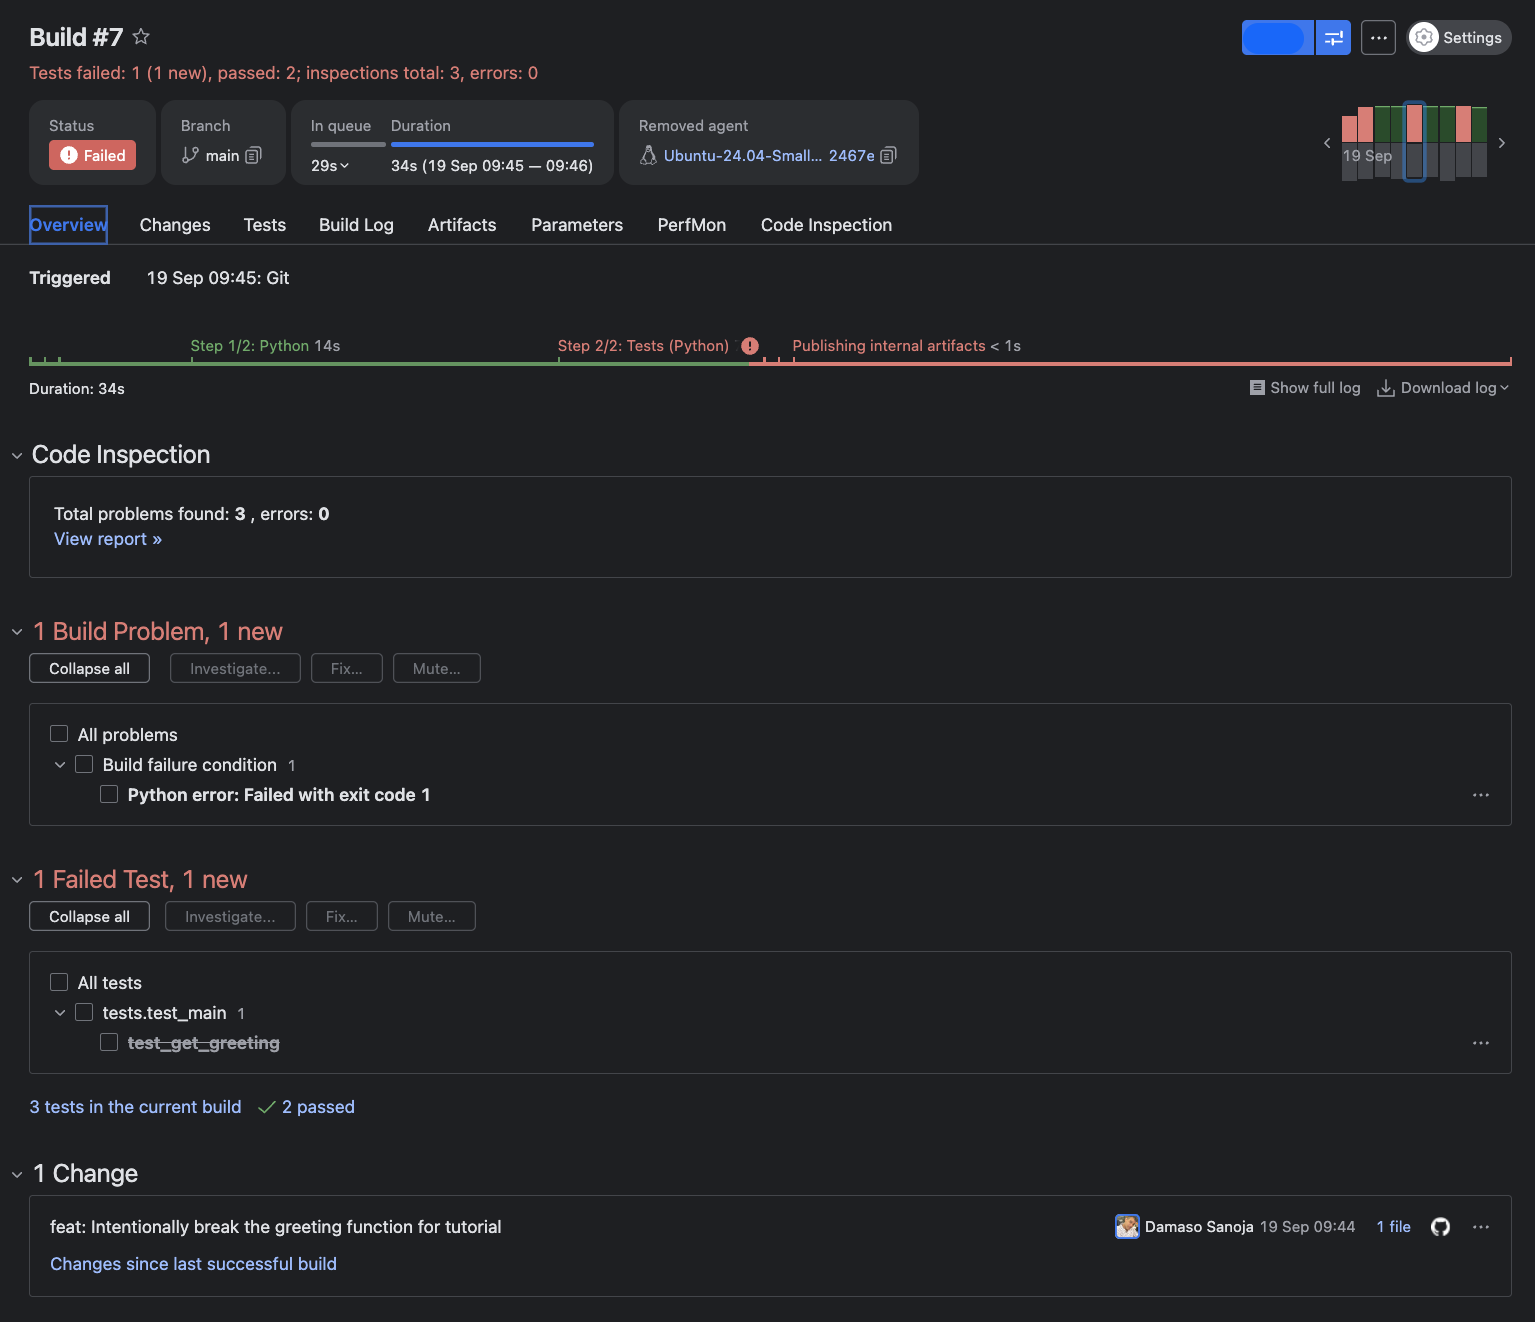
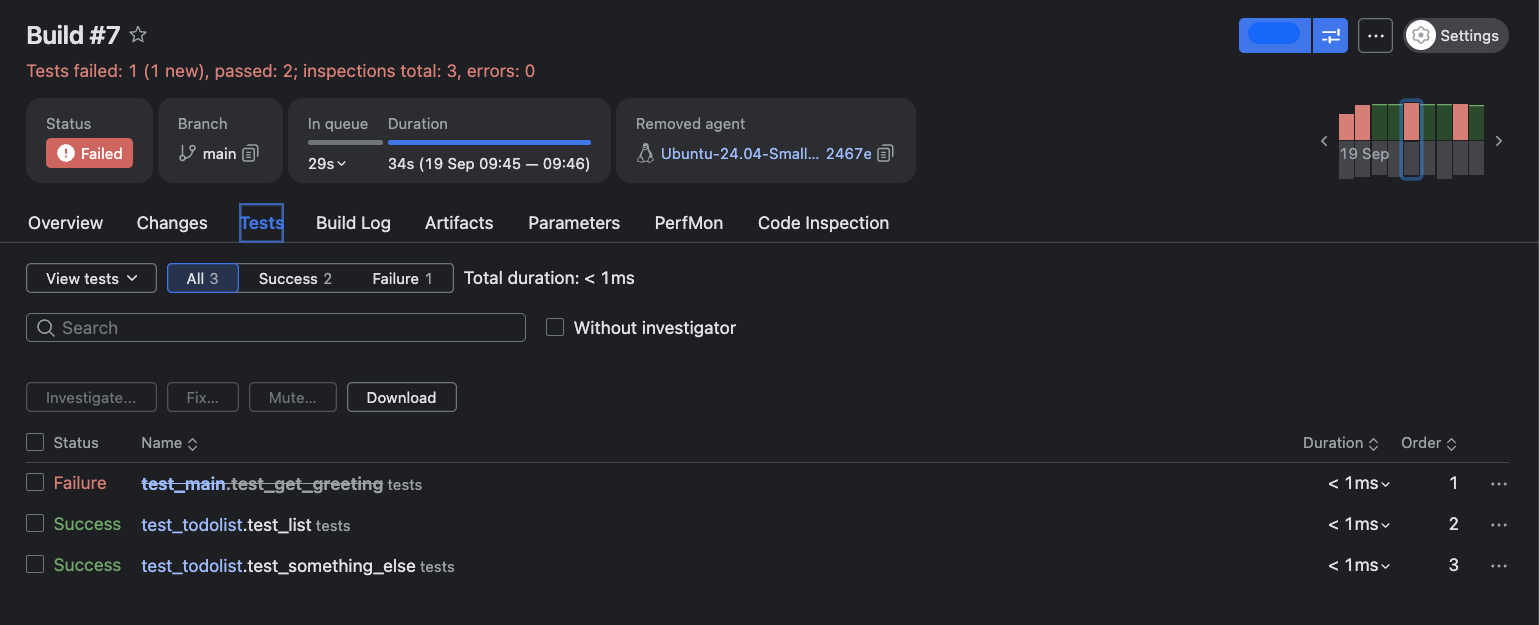
Follow the evidence: Click the Tests tab to get the full breakdown of which tests failed, whether they’re new or recurring, and contextual details that guide targeted fixes:
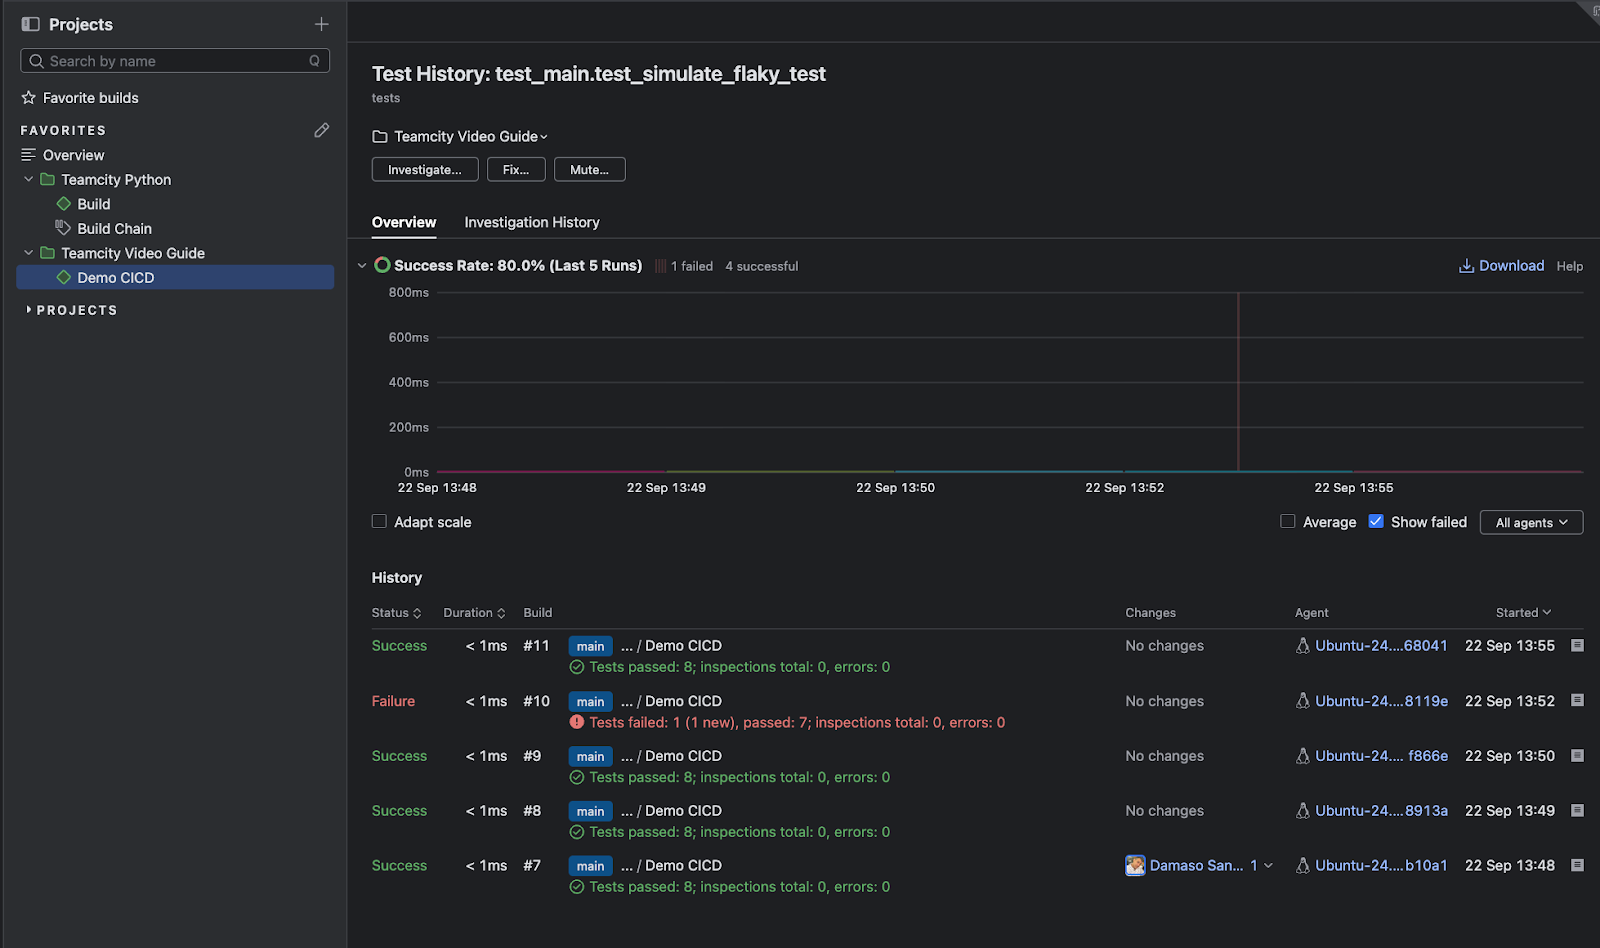
From the Tests tab, you can drill deeper into individual test behavior by accessing the test history page. Click the three-dot menu to the right of any test name to open this view, which reveals patterns in test failures, such as how frequently the test fails, which build agents experience issues, when failures began, and trends over time. This historical perspective helps you distinguish between flaky tests and genuine regressions, making it easier to prioritize fixes based on impact and recurrence.
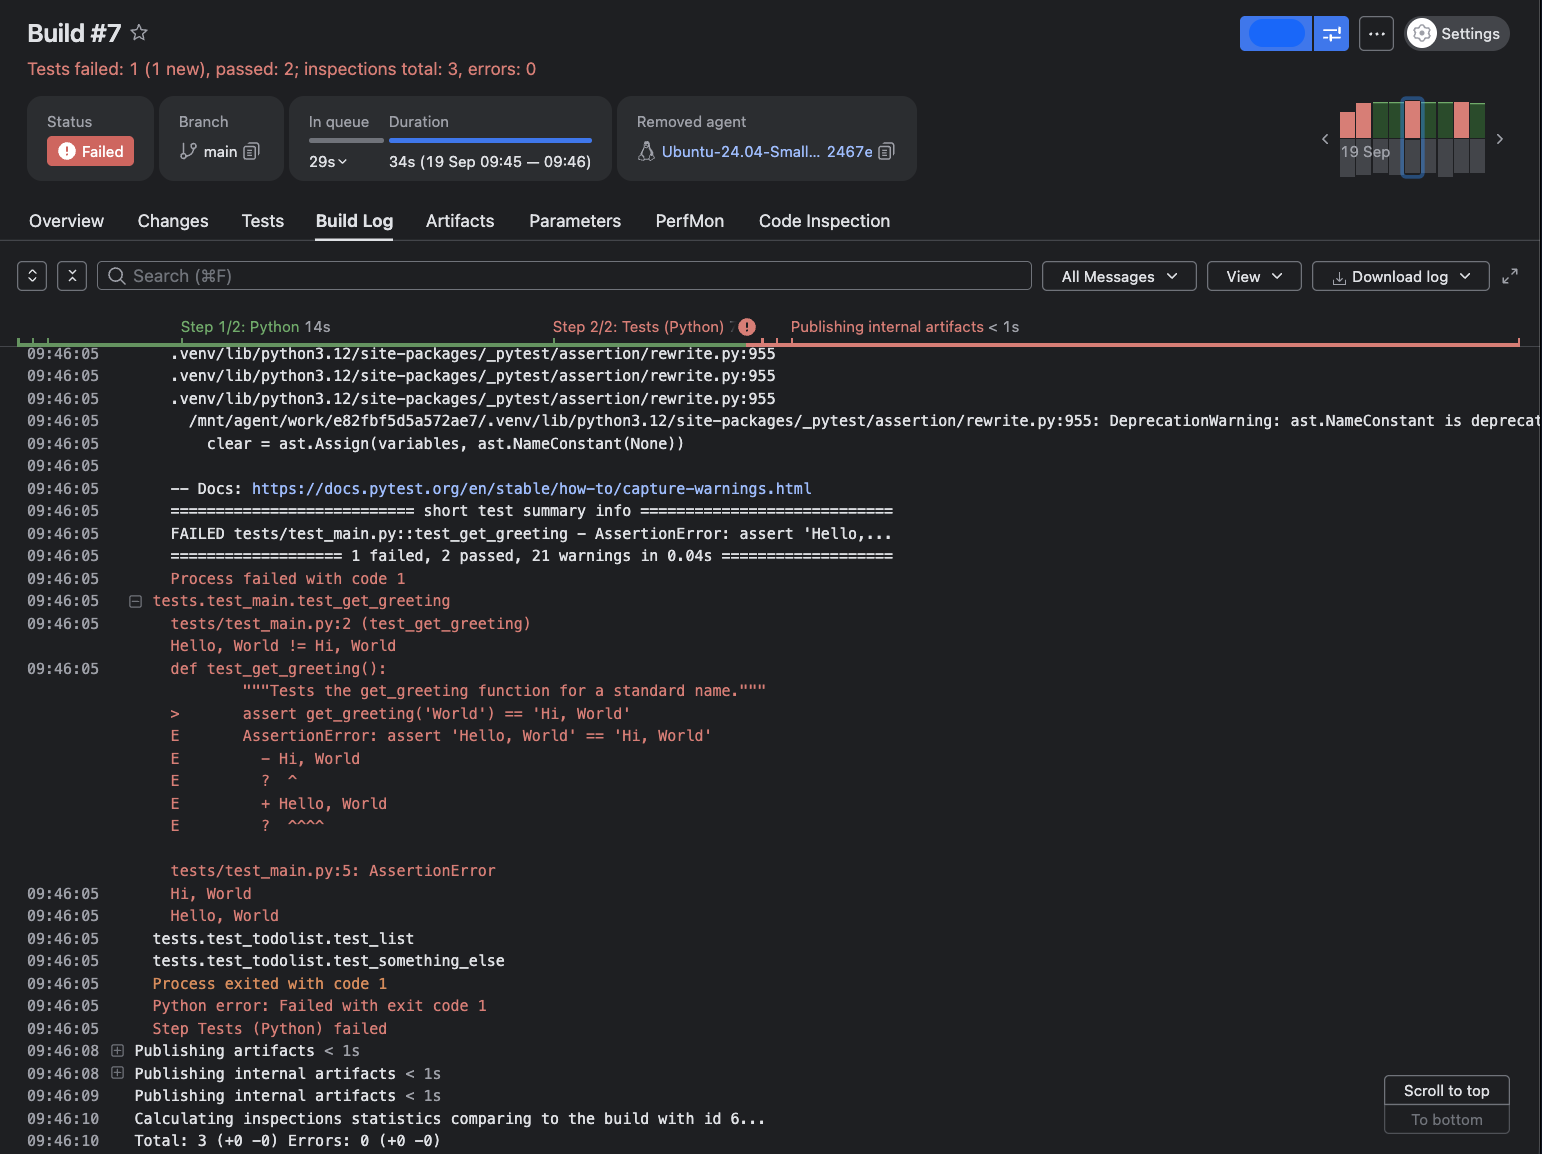
To complete the feedback loop, the Build Log offers a searchable, chronological trace of every step for uncovering underlying errors and misconfigurations behind failed tests.
From failures to code quality: Tracking what matters
After tracing a failure, comprehensive quality assurance means going beyond green builds to deep code insights. TeamCity’s Statistics tab offers dedicated charts for Code Inspections and Code Coverage to track technical debt and ensure essential logic is tested.
You can also extend TeamCity’s dashboard by adding custom tabs with your own reports to the build results interface, enabling you to incorporate specialized metrics and third-party analysis tools directly into your workflow.
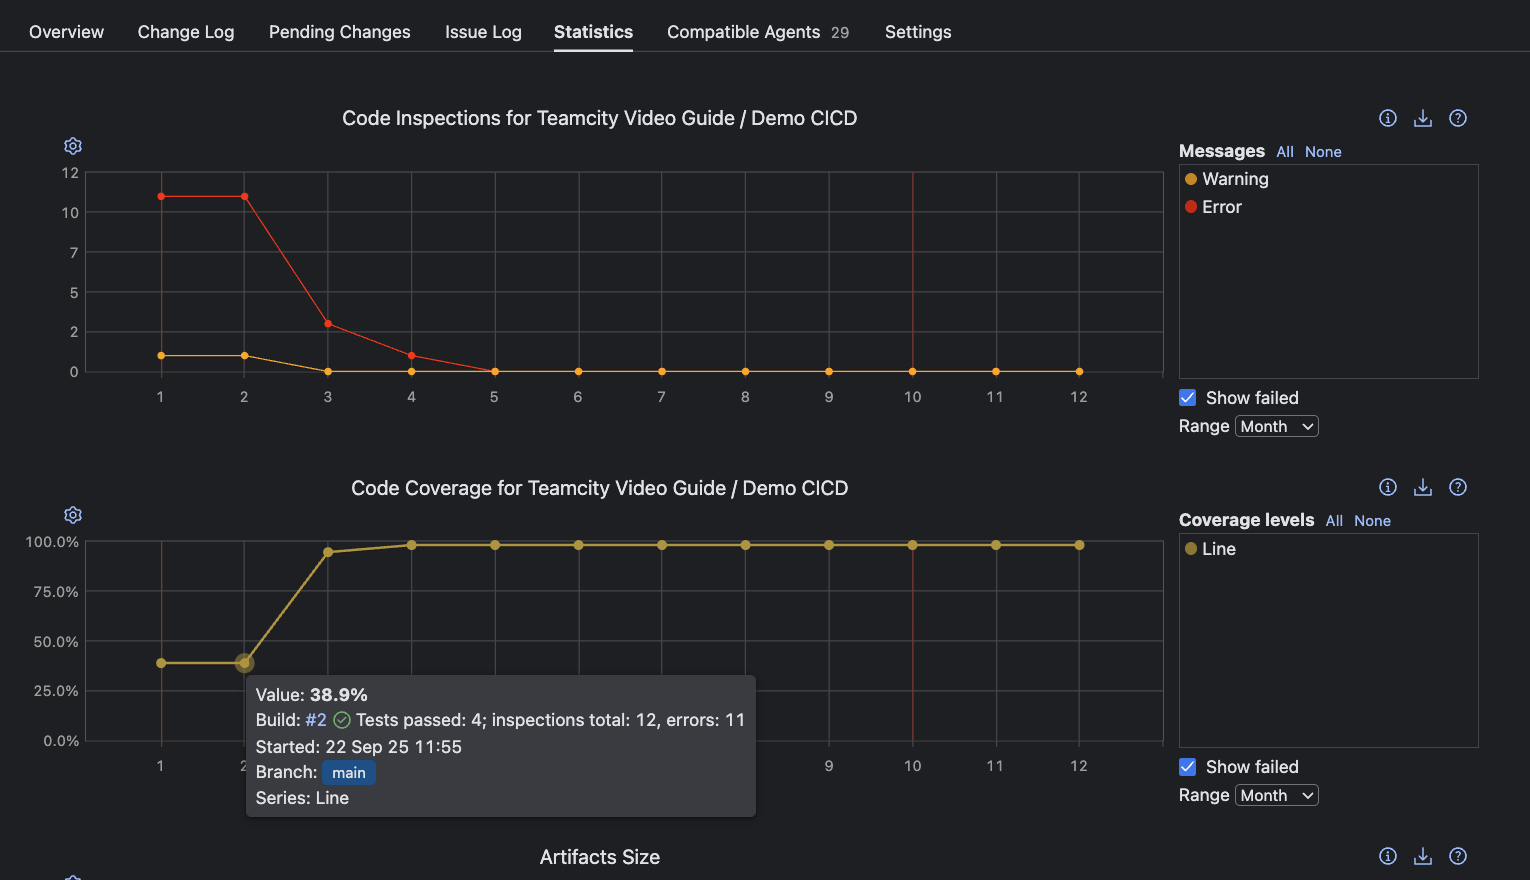
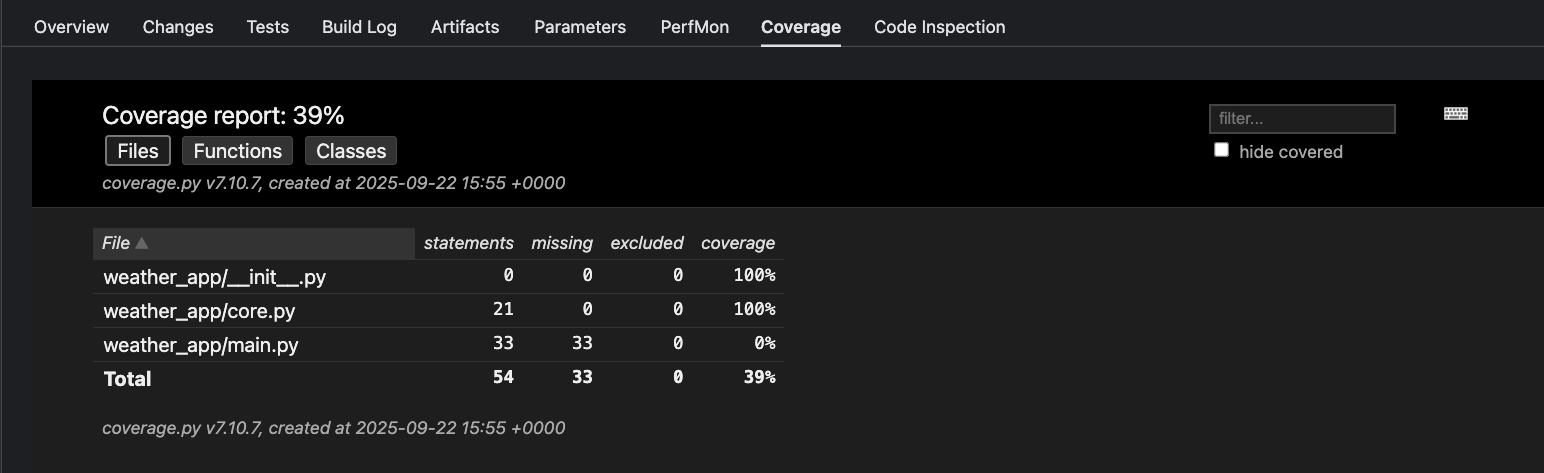
Clicking any point in the Code Coverage chart brings you to that build’s Coverage tab. Depending on your configured tool (in this example, coverage.py), you’ll find granular coverage reports here. These insights clarify which parts of your codebase are thoroughly tested versus those at risk of silent failure.
Understanding where failures occur and which code remains untested raises quality, shortens feedback loops, and reduces risk for every subsequent release.
Accelerating delivery: Measuring and improving release velocity
Once stability and quality are established, the next challenge for any engineering team is maximizing how quickly new value reaches users.
TeamCity’s analytic charts and dashboards surface velocity as a multidimensional flow to help you drive meaningful gains in delivery speed without sacrificing rigor.
You can enhance these analytics by reporting custom statistic values using TeamCity service messages directly from your build steps, allowing you to track metrics like code coverage percentages, inspection results, and other team-specific indicators alongside TeamCity’s built-in measurements.
Monitoring release cadence for continuous value delivery
Every successful production release puts features, fixes, and security improvements directly into the hands of customers. That’s why tracking how often your CI/CD pipeline ships code is a critical health signal for agility and operational efficiency.
Frequent deployments mean smaller, safer changes and less risk per release.
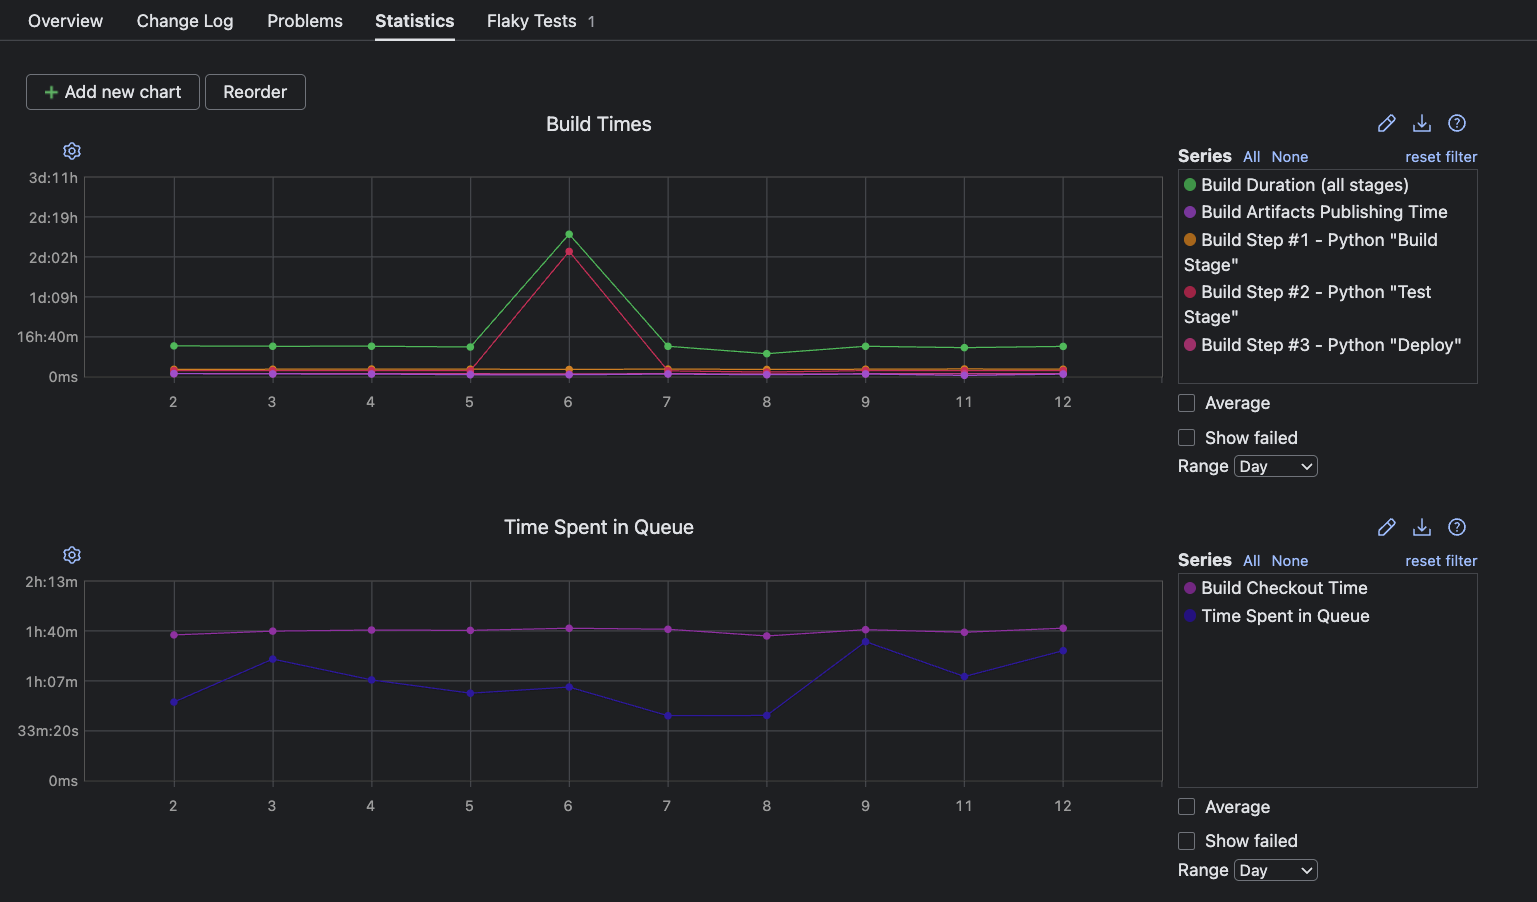
TeamCity charts like Time Spent in Queue and Build Times help you identify when and how production deployments occur to quickly spot accelerations or slowdowns in delivery cadence.
Shortening cycle time for a faster feedback loop
Speed isn’t just about shipping more often; it’s also about reducing the interval between code commit and user impact. This end-to-end cycle time is an important health signal that defines your delivery pipeline’s efficiency and how quickly improvements make it to production.
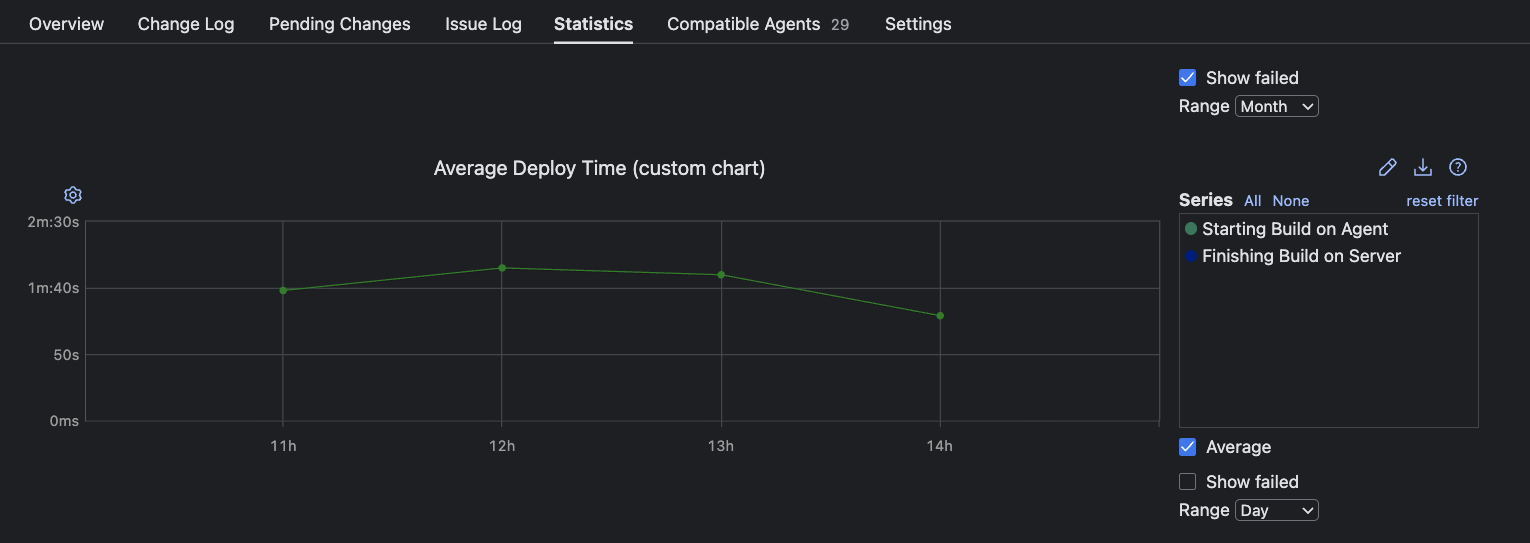
TeamCity’s flexibility allows for custom charts that highlight patterns in end-to-end delivery duration. For instance, you can build an Average Deployment Time graph using the Starting Build on Agent and Finishing Build on Server metrics:
Improving failure response time to minimize impact
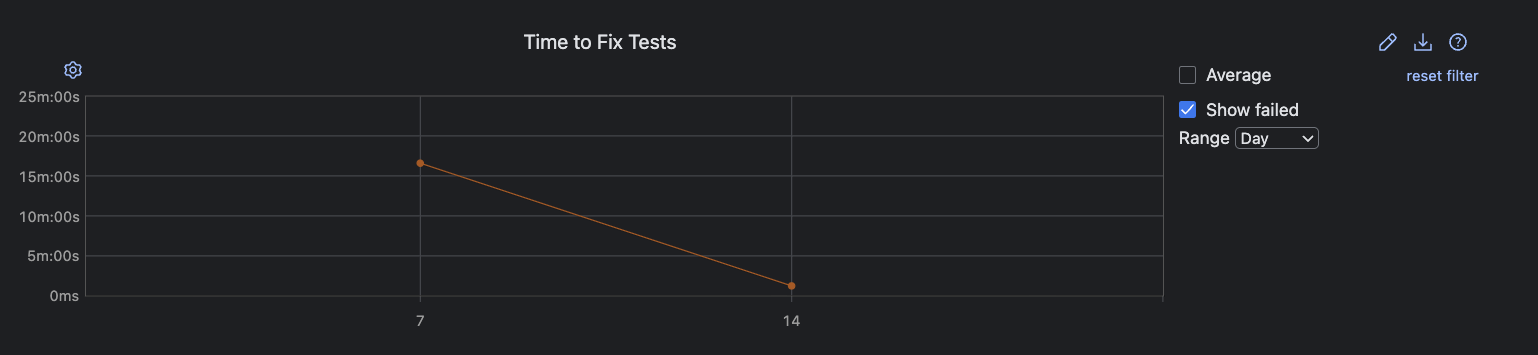
The speed at which your team responds to and recovers from production failures is a pivotal indicator of both resilience and operational maturity. TeamCity’s Time to Fix Tests and detailed build duration analytics show you how quickly errors surface and get resolved so you can quantify the impact of failures and how effectively you recover.
Monitoring build duration for sustainable velocity
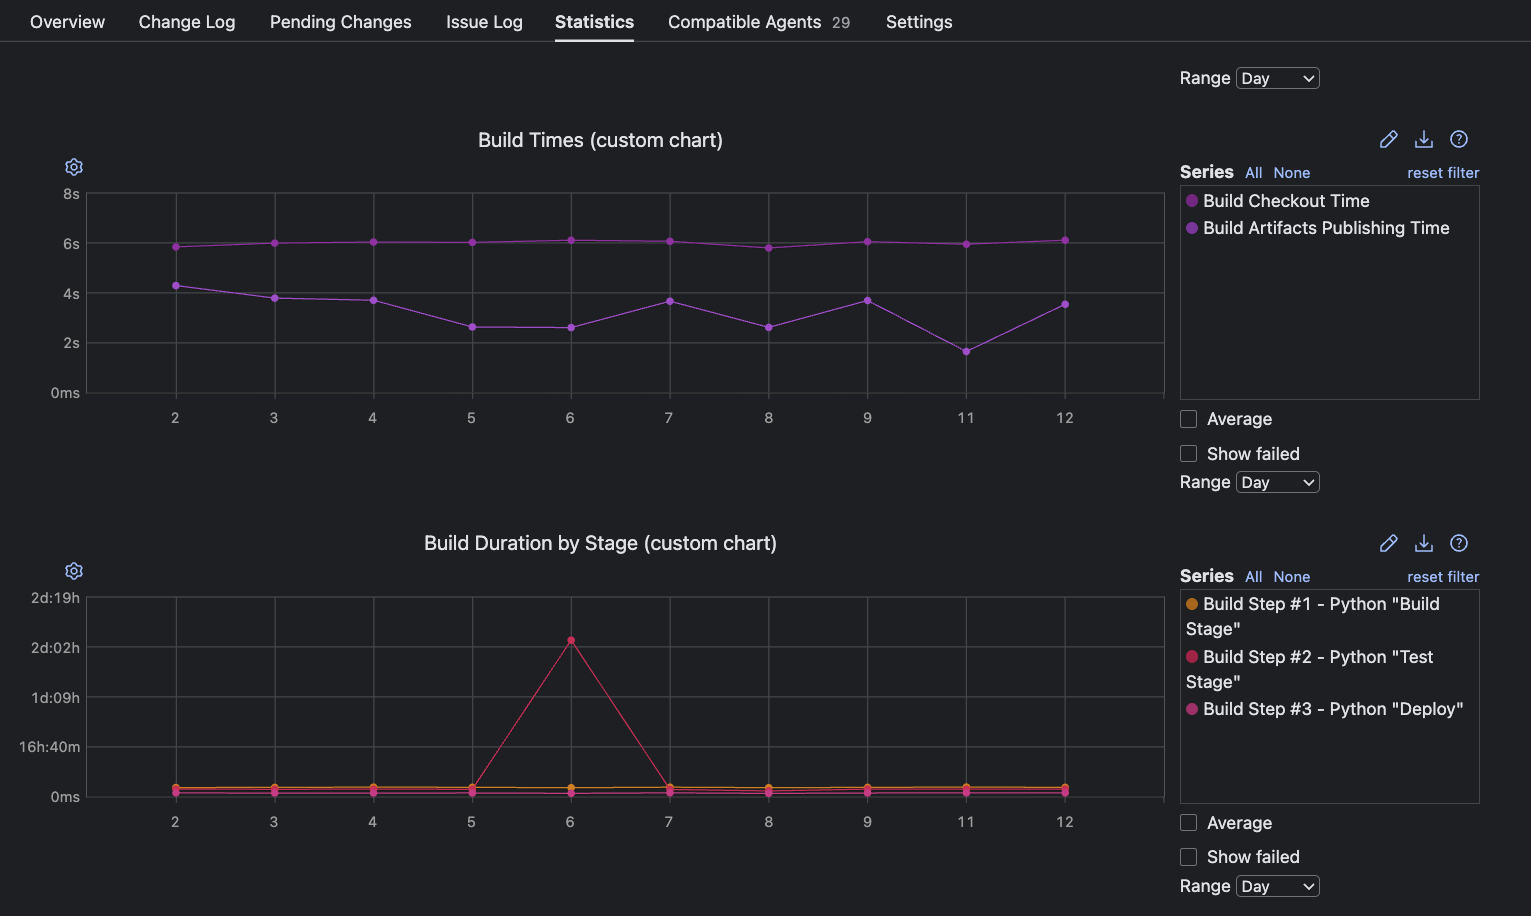
Velocity also depends on how little time is wasted in each cycle. Analyzing Build Times and Build Duration by Stage reveals how efficiently your pipeline processes changes to help you maintain momentum and ensure timely deployments.
Diagnosing bottlenecks: Pinpointing and resolving pipeline inefficiencies
While fast delivery accelerates value, a truly effective pipeline depends on quickly surfacing and eliminating waste before slowdowns become systemic. Efficiently diagnosing bottlenecks prevents frustration, boosts developer productivity, and ensures that each iteration is an opportunity for improvement, not an exercise in firefighting.
TeamCity’s analytics transform this process from guesswork into surgical, data-driven action.
Spotting build spikes with actionable trends
Analyzing build duration trends is one of the most effective ways to identify pipeline inefficiencies. A sudden spike on the Build Times chart instantly highlights a potential issue, whether due to environmental issues, unusually long tests, or integration problems.
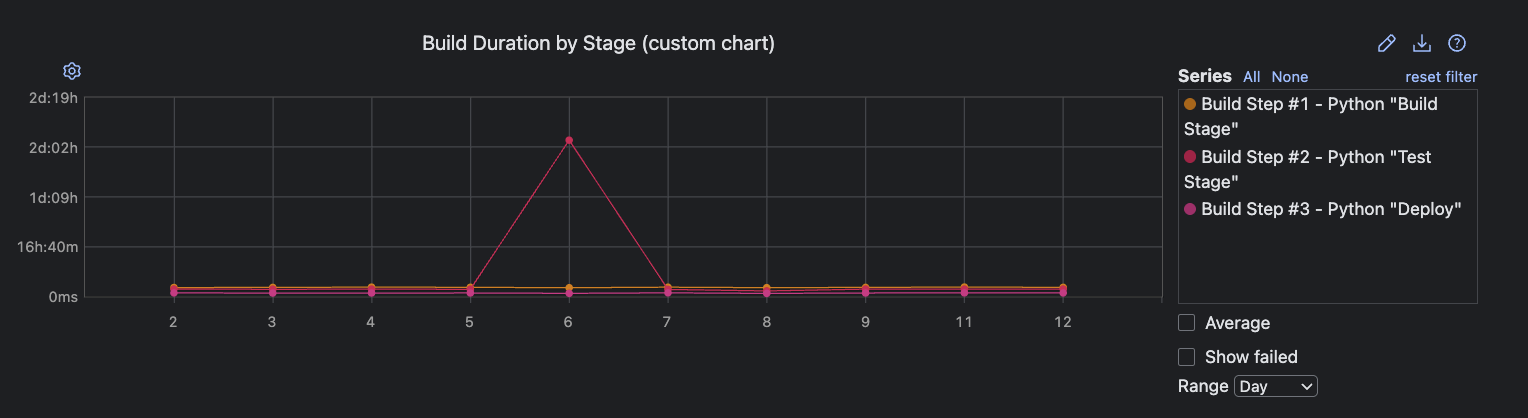
For example, you can use the Build Duration by Stage custom chart to pinpoint where in the pipeline bottlenecks occur as soon as unusual patterns emerge.
Investigating test duration: Finding the crawl in your pipeline
Long build times can often be traced back to problematic tests. You can use the Tests tab in any build to check on the status, name, and duration of every test.
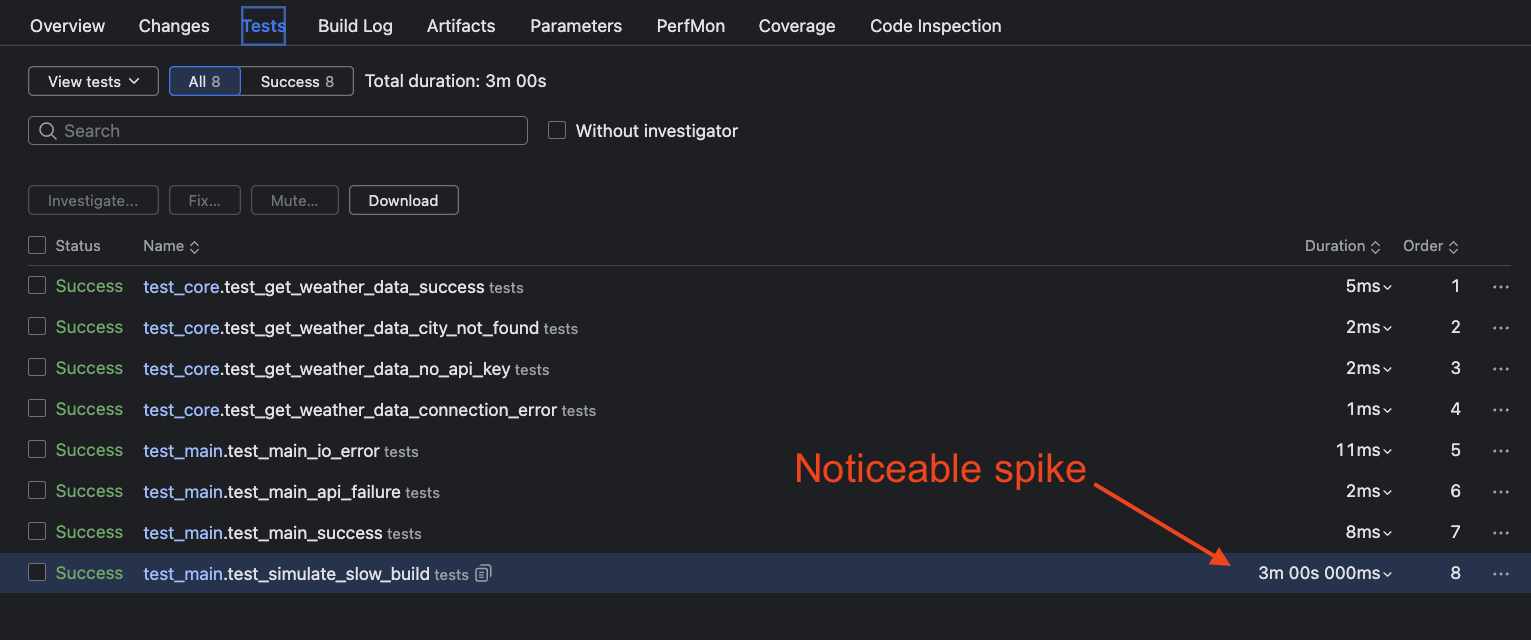
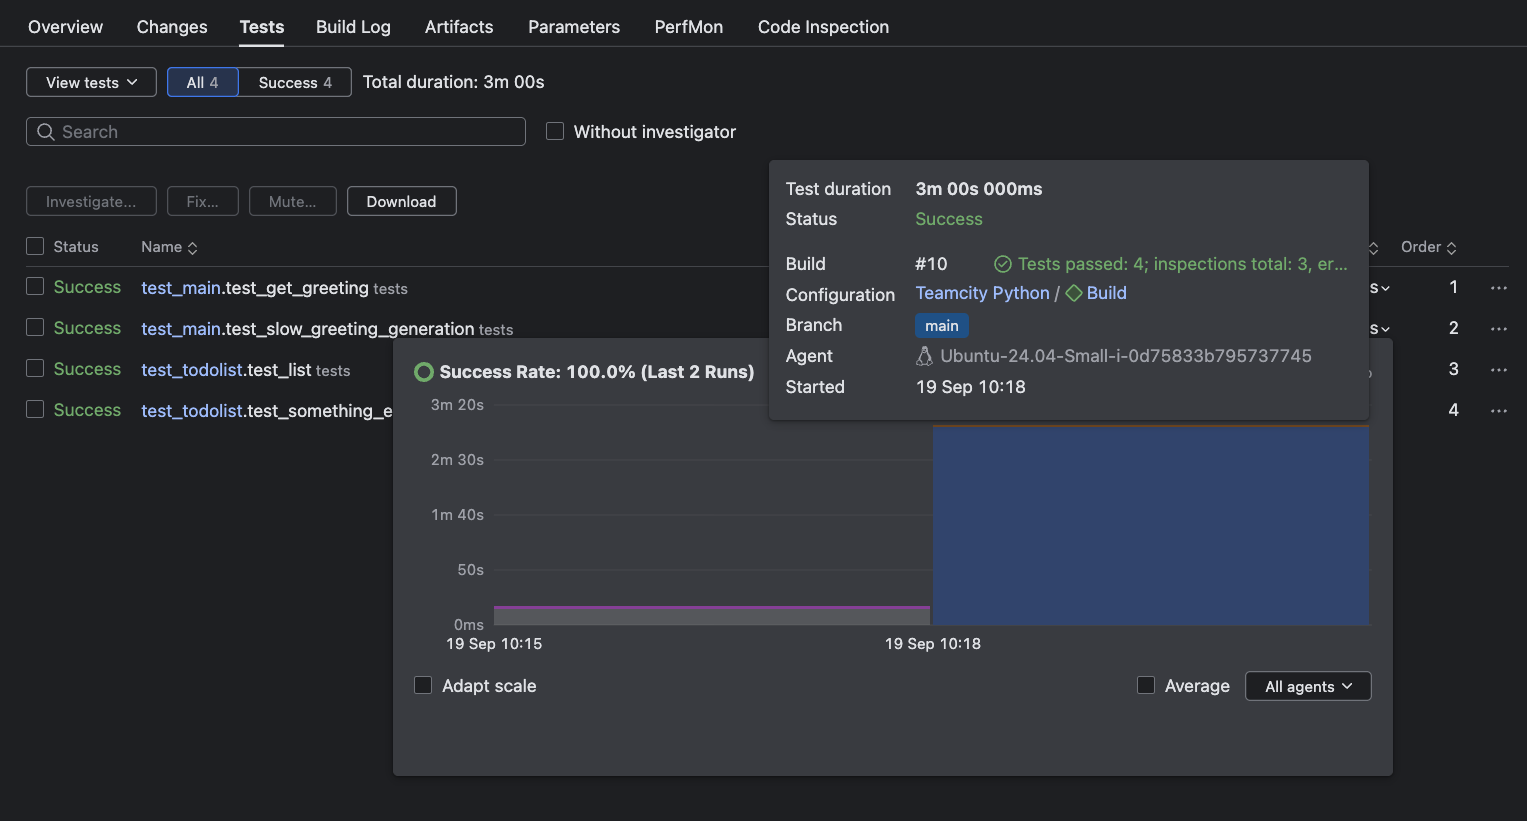
If the test duration is abnormally high, you can click on it for a historical trend chart that lets you identify when the test began slowing down and in what context.
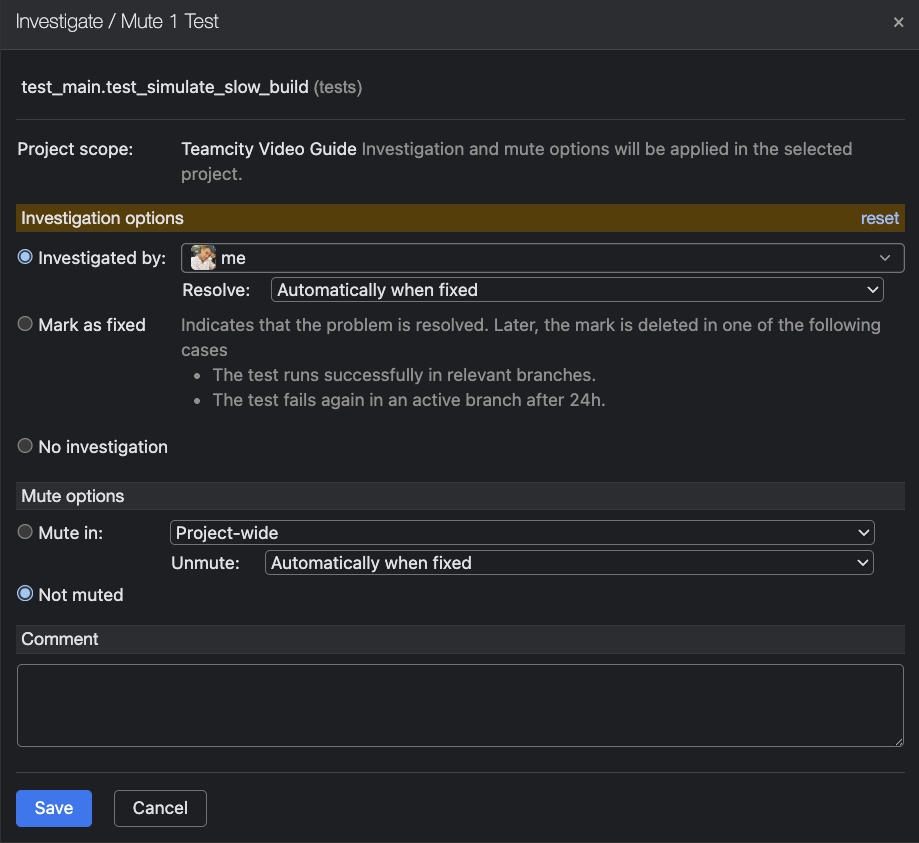
Simply click on any test to mute it or assign ownership for further investigation, ensuring accountability and rapid feedback.
Detecting and managing flaky tests automatically
Flaky tests (those that fail unpredictably) can silently degrade confidence in your pipeline and are notoriously difficult to spot through duration analysis alone.
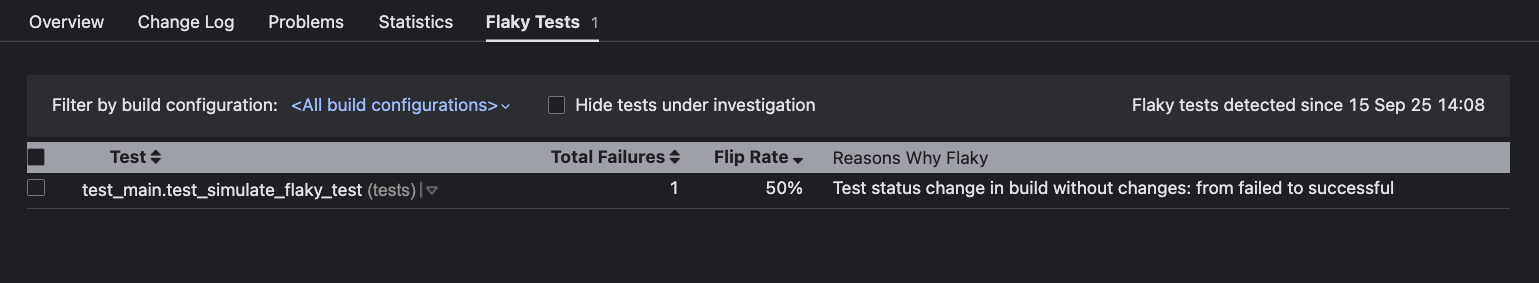
TeamCity proactively flags flaky tests and surfaces them in the dedicated Flaky Tests tab at the project level. Here, you see the test name, failure count, flip rate, and insights into the causes for flakiness that you can act on.
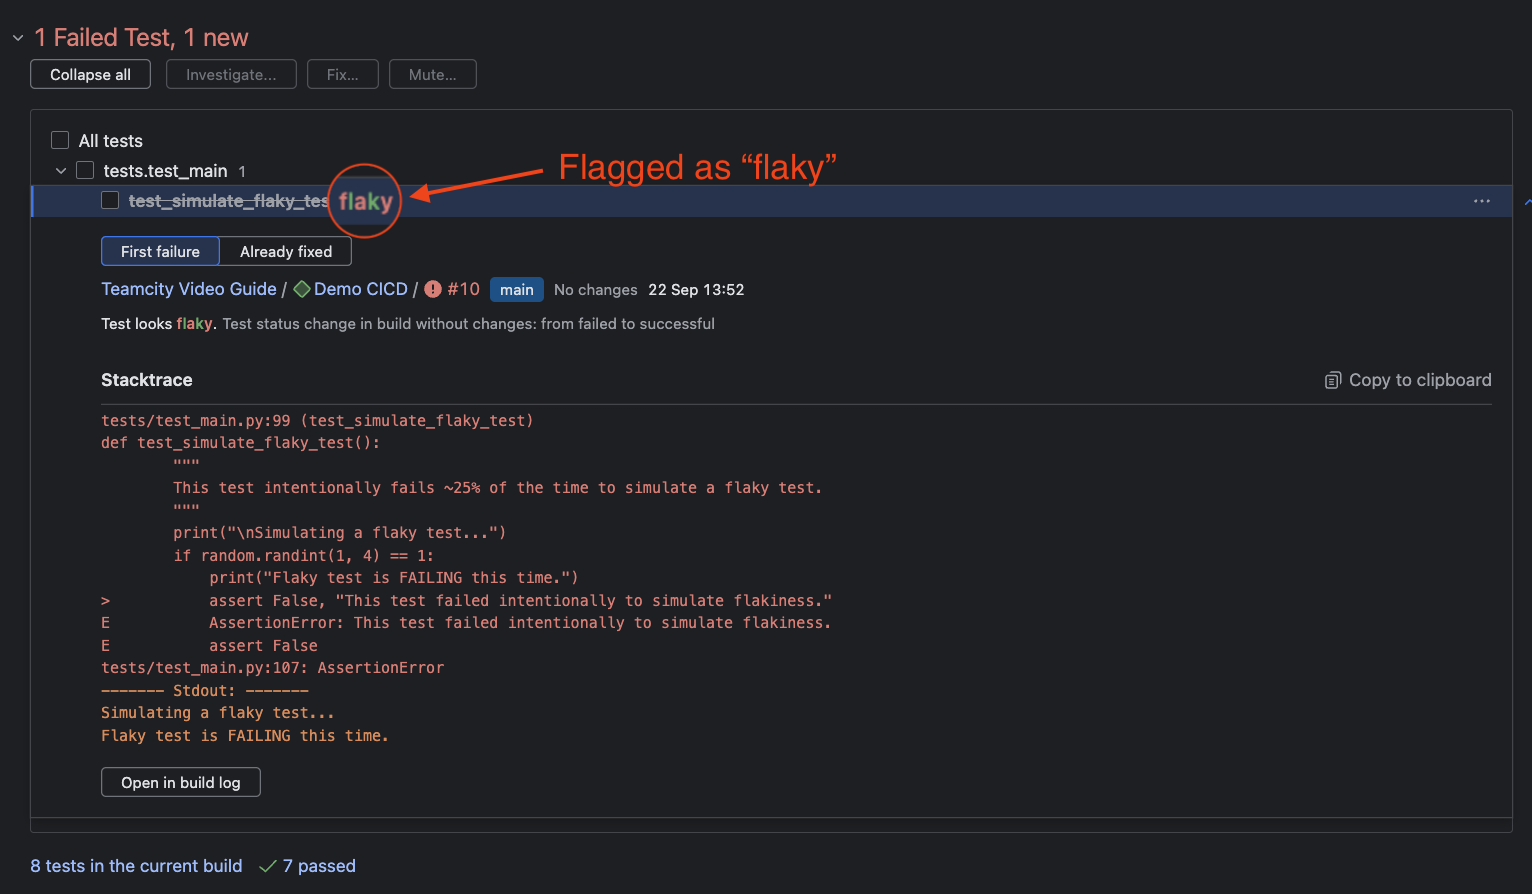
Flaky tests are also prominently flagged in the Overview code inspection section for any failed build. Click into the test entry for a detailed stack trace, or open the error in the Build Log for a deeper dive.
Using test reports for root-cause analysis
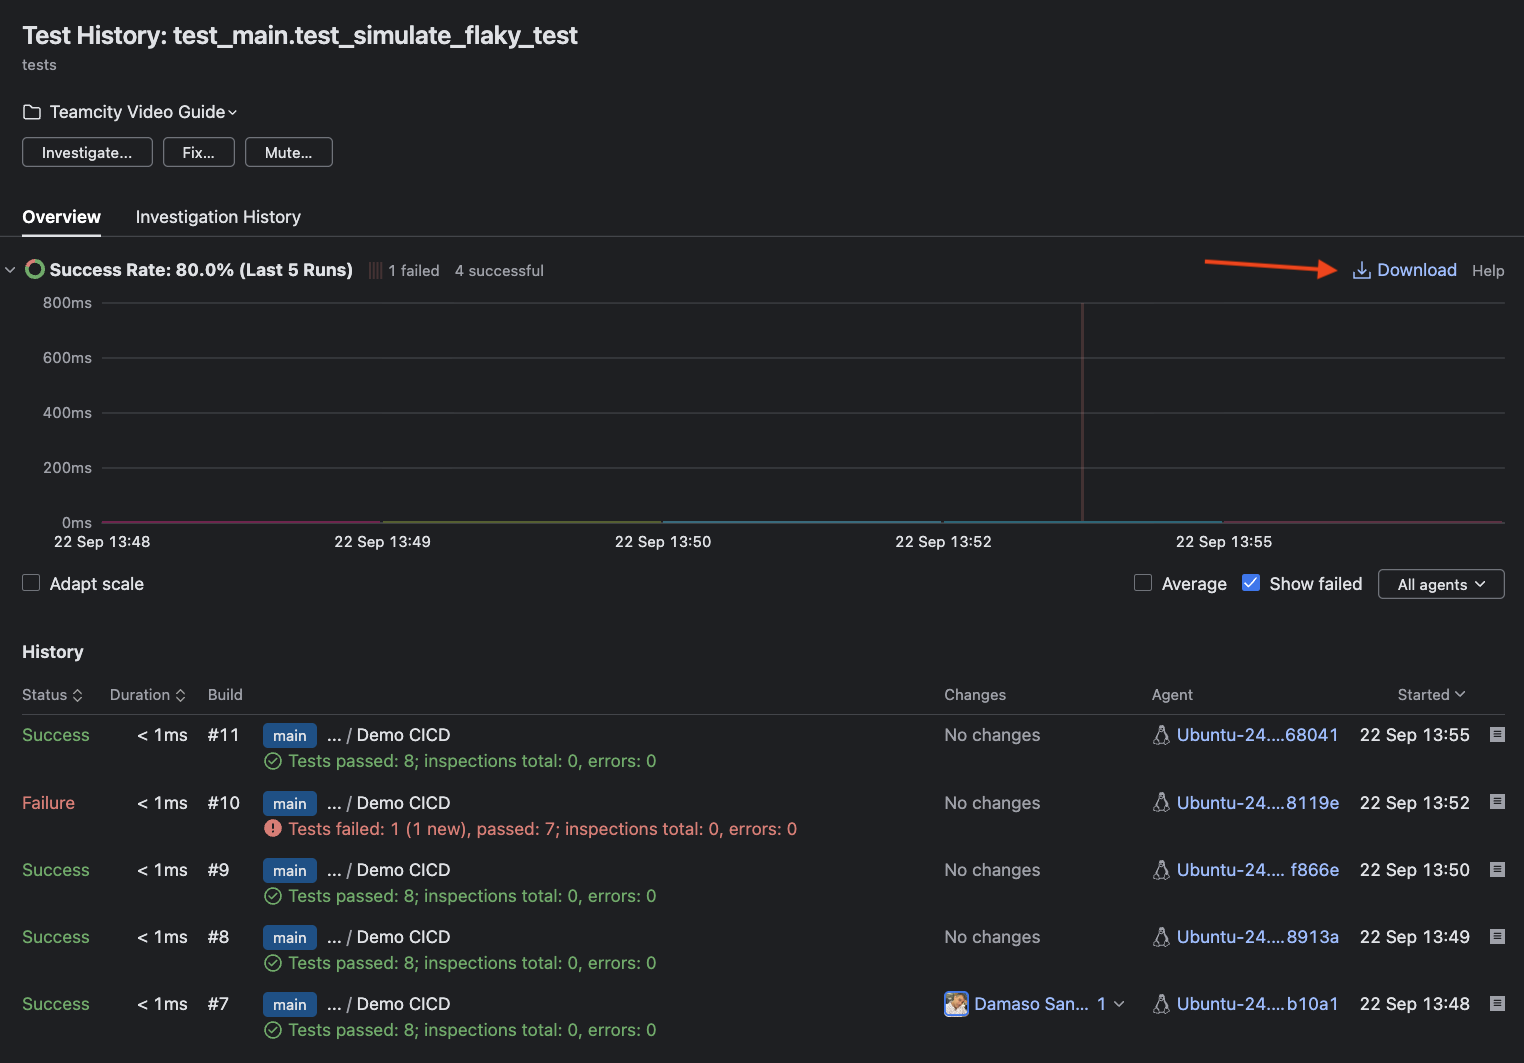
Along with flaky test management, TeamCity’s Tests tab flags these problematic tests and offers a Test History report on clicking. These reports let you compare failure patterns across builds by listing status, duration, build number, changes, agent, and precise timestamps side by side. Additionally, an intuitive history chart enables quick trend analysis.
Conclusion
Moving beyond the daily cycle of troubleshooting builds requires more than patch fixes and workarounds. TeamCity provides the diagnostic clarity you need with built-in health signals that reveal build duration trends, success rate patterns, and failure root causes – without having to dive through endless plugin configurations or log files.
Instead of spending hours investigating why builds randomly fail or trying to identify which plugin update broke your deployment chain, TeamCity’s comprehensive monitoring gives you immediate visibility into pipeline bottlenecks and stability issues.
The integrated test reporting eliminates guesswork so you can pinpoint problems quickly and maintain consistent delivery performance.