IntelliJ IDEA
IntelliJ IDEA – the Leading IDE for Professional Development in Java and Kotlin
Spring Boot Debugging – Now Remote

We released Spring Debugger in May 2025 to bring more clarity to the “magic” behind Spring Boot – helping you see what’s really happening inside your running application. By the end of 2025, the plugin had reached more than 300,000 unique downloads and became a trusted tool within the developer community.
We’ve received a lot of valuable feedback, including feature requests, bug reports, and improvement ideas. Surprisingly, this was the most common question:
“Can I debug remote applications?”
In this version, we’re happy to say that yes, you can.
Remote debug with Spring Debugger
When we started developing Spring Debugger, one of our cornerstone principles was:
“We do not want to use any debug agents.”
Adding agents to local code often makes setup harder, increases maintenance overhead, and can interfere with the debugging process. We decided to keep this approach for remote debugging as well.
The main challenge in remote debugging was gathering bean information after attaching to the app.
In the local setup, that’s simple – we set a non-suspending breakpoint in the method that finalizes Spring context initialization and then read all beans from the context. Remotely, however, the application is already running, and the context is fully initialized when we attach.
Container threading model and debugging
Our current solution is to suspend one of the servlet-container threads and read the Spring context from that thread. This approach is where our decision to avoid using debug agents is truly tested.
The behavior of Spring Debugger depends on which embedded servlet container your Spring Boot app is using, as each container handles network I/O and worker threads differently.
With Apache Tomcat, the connector maintains a pool of worker threads as soon as the server starts. Because these threads are available and ready before any HTTP request arrives, the Spring Debugger can hook into one of them immediately after startup and fetch the Spring application context.
By contrast, with Eclipse Jetty or Undertow, the thread model is more layered. For example, Jetty uses separate producer (I/O) threads and worker (task) threads submitted to an Executor.
Undertow uses I/O (event‐loop) threads for non‐blocking network handling and dispatches to worker threads for actual request processing.
Because a fully available worker thread with access to the Spring context can only appear once a request is processed, the debugger cannot load context information until the first incoming connection.
In short, when running on Tomcat, Spring Debugger can present the context immediately. When running on Jetty/Undertow, there is a slight delay in context loading before the first HTTP request. This is not a bug – it is a design trade-off linked to our agent-free inspection approach.
You can still debug remote Spring applications with nearly all Spring Debugger features – the main difference is when the context becomes available for inspection.
How to configure remote debugging
The process is the same as standard JVM remote debugging – run your application with an open debug port and connect using the Remote JVM Debug configuration.
For example, in a Docker Compose setup on a remote server:
http-server:
 depends_on:
   - postgresql
 image: 'jb/http-server:latest'
 environment:
   - SPRING_DATASOURCE_URL=jdbc:postgresql://postgresql:5432/db
   - SPRING_DATASOURCE_USERNAME=user
   - SPRING_DATASOURCE_PASSWORD=secret
   - JAVA_TOOL_OPTIONS=-agentlib:jdwp=transport=dt_socket,server=y,suspend=n,address=*:5005
 ports:
   - '8080:8080'
   - '5005:5005'
The key line is:
JAVA_TOOL_OPTIONS=-agentlib:jdwp=transport=dt_socket,server=y,suspend=n,address=*:5005
This is a well-known option for enabling remote debugging. It opens port 5005 for debugger connections and exposes it from the container.
To start debugging, create a Remote JVM Debug configuration in IntelliJ IDEA and make sure to specify the correct module classpath.
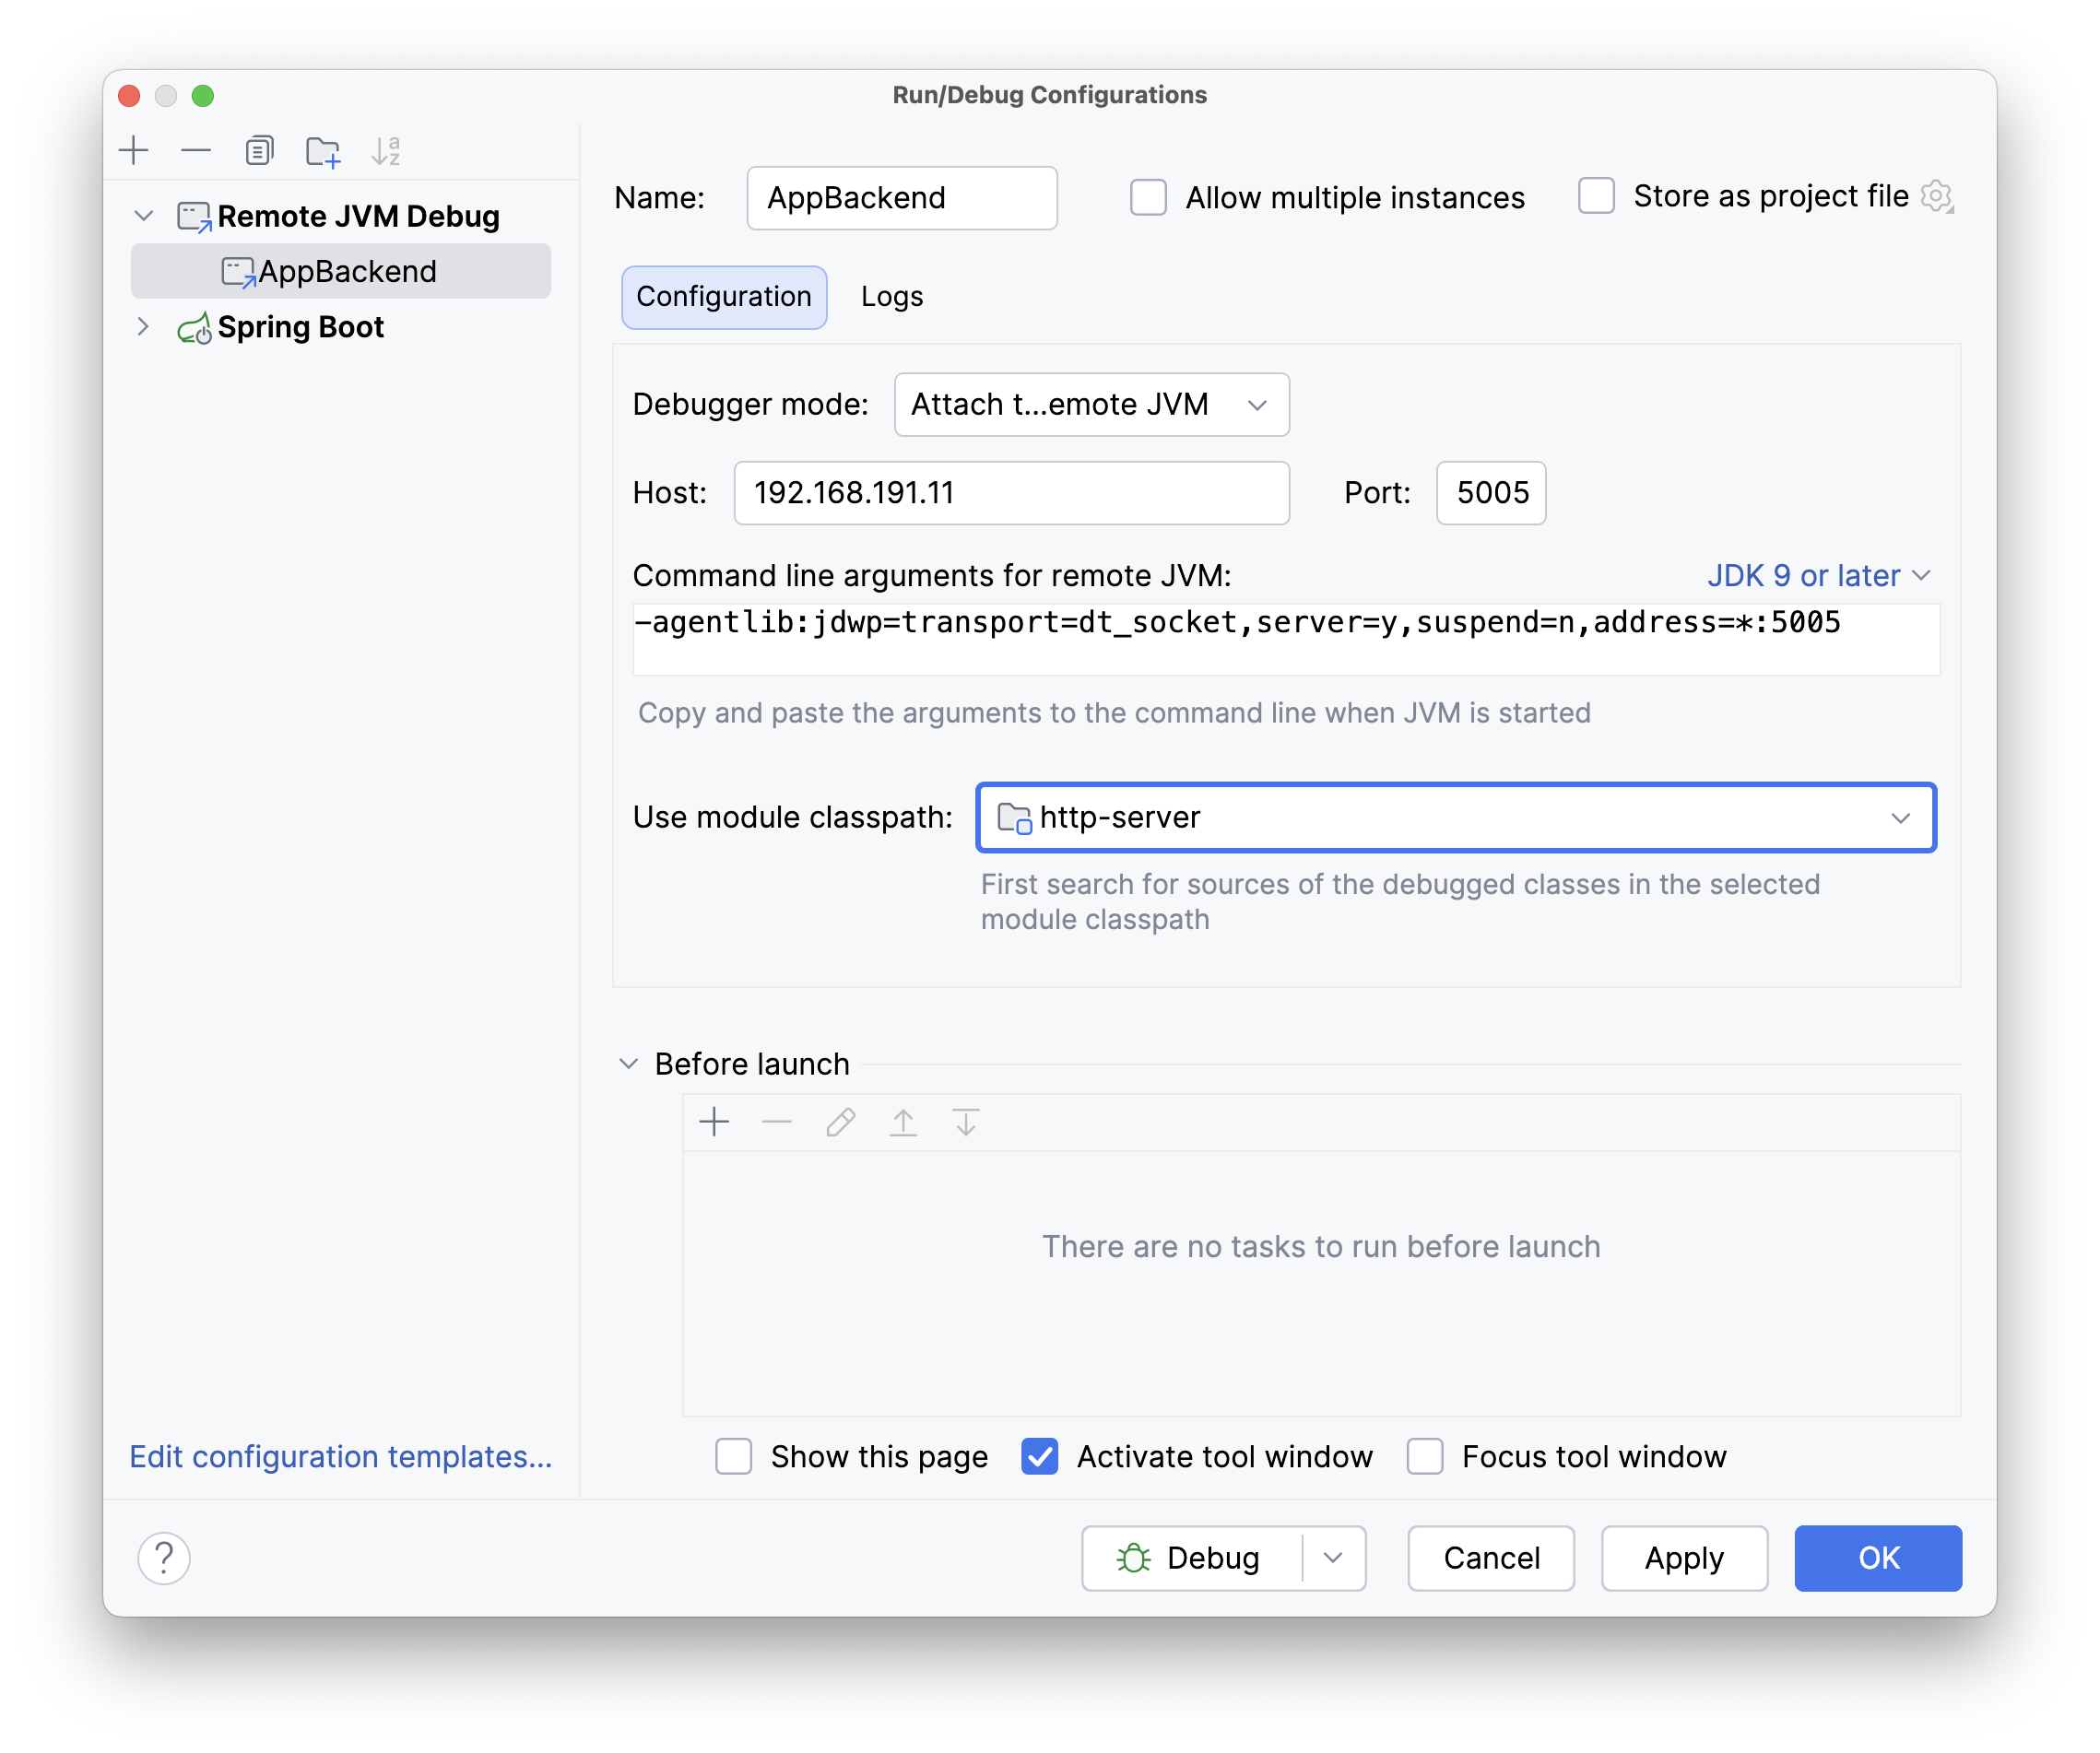
That’s it – you can now debug the remote application, inspect property values, evaluate bean expressions, and analyze transactions right inside your IDE.
Limitations
Remote debugging differs slightly from local debugging, but there are a few limitations:
- Only embedded containers (Tomcat, Jetty, Undertow) are currently supported.
- You need to specify the module classpath in your run configuration.
- Database connections are shown, but the database structure view is not available.
The last point might be disappointing, but direct access to a remote database is often not technically possible – it may be inside a Docker network, a separate environment, or behind a firewall. We’re working on finding a solution, but this will take some time.
Conclusion
The new version of Spring Debugger takes another step toward application troubleshooting by adding remote attach support. Even if you’ve never tried remote debugging before, you’ll find the process almost identical to local debugging – just open a port and connect from IntelliJ IDEA.
No agents, no actuators, just a standard remote port and a regular debug session.
Simply hit Debug and dive into your running application – inspect beans, properties, transactions, and use extended expression evaluation capabilities.
We’re exploring optional agent-based extensions for environments where deeper introspection is worth the trade-off, and we’d love to hear your feedback.
Happy coding!