CLion 2016.2 EAP: Remote GDB debug
Hi,
CLion 2016.2 release is just around the corner, and today we have a EAP build (162.1236.1) for you with a long-awaited feature: Remote GDB debug!
To try it download the build from our confluence page, or get a patch-update right in the IDE in case you are using previous EAP build.
Remote GDB debug
This build brings you one of the most voted feature – remote debug. To be precise, CLion now supports remote debug with GDB/gdbserver. That means that having executable running on one host under gdbserver, you can connect to it with the GDB from CLion from another host and inspect the code using all the benefits of CLion’s debugger UI: set breakpoints from the IDE, view variable values, evaluate expressions and more.
Supported platforms
Since GDB/gdbserver is a universal tool, many combinations are possible, from which most popular are debugging on various Linux targets from Linux/macOS hosts. On Windows remote debug is supported from version 2016.3.
Configuration settings
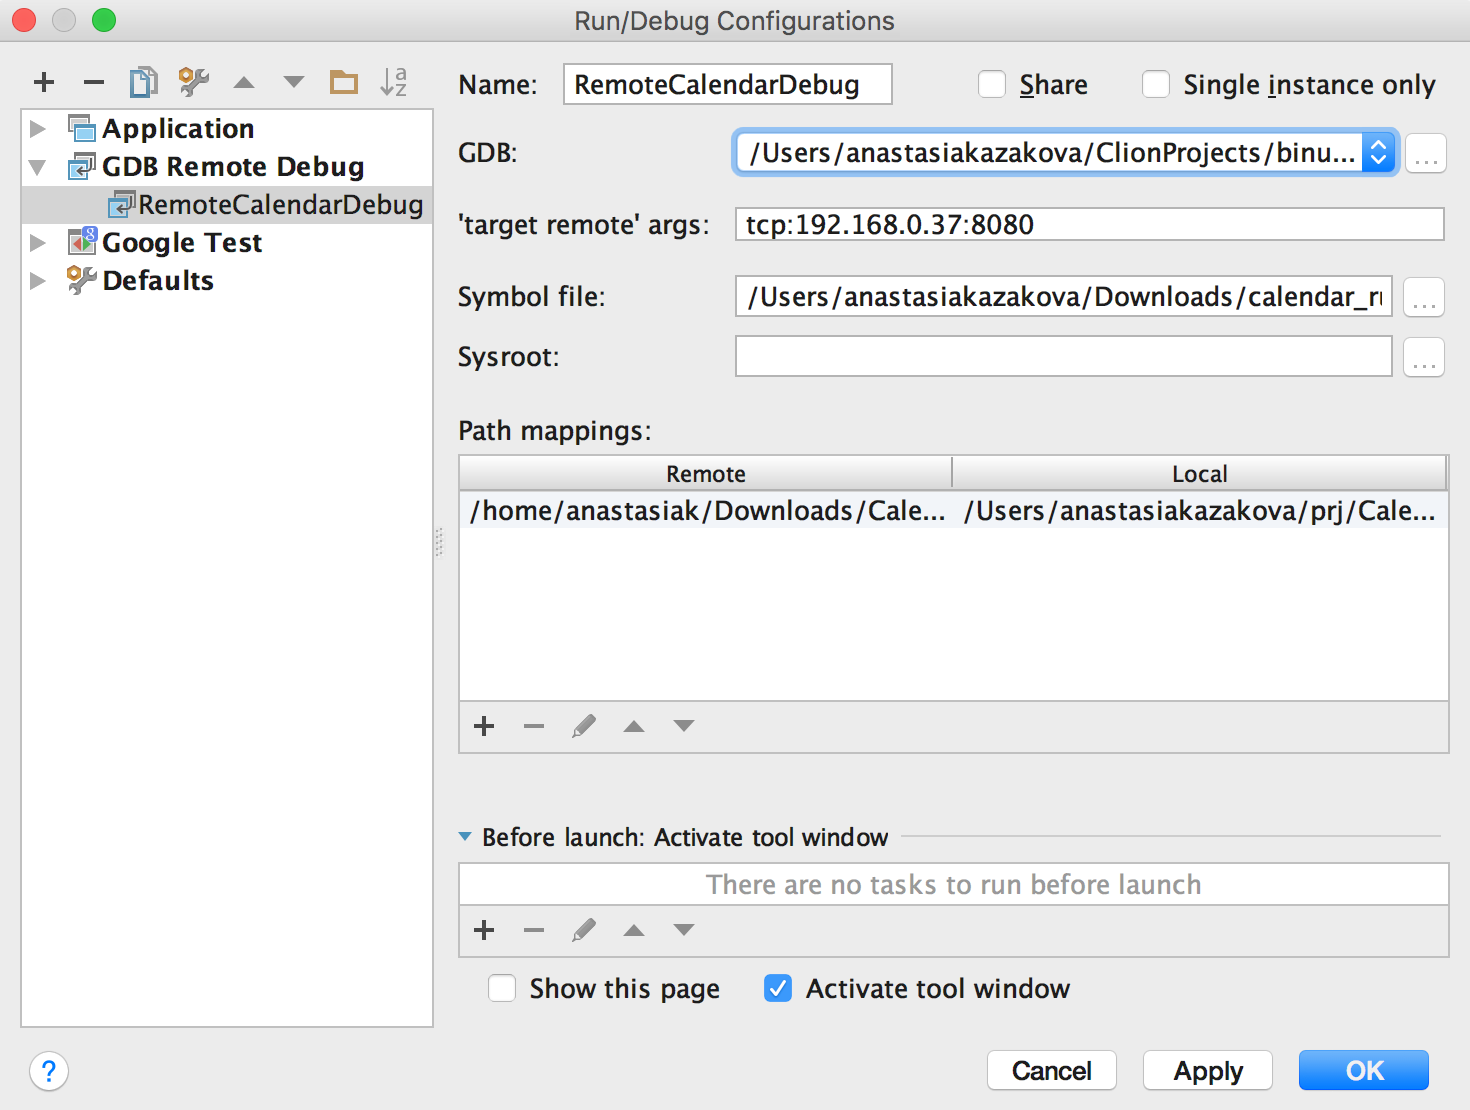
To connect remotely with GDB to the target host, create GDB Remote Debug configuration (go to Run | Edit Configurations and create it from the template) and provide settings for the remote connection, like GDB to use, medium to carry the debugging packets (serial line, or an IP network using TCP or UDP), debug symbols, sysroot, path mappings:
Core functionality
Finally, simply run the executable on a target system under gdbserver (you can use built-in terminal to access the remote host). And start debugging the GDB remote debug configuration in CLion. The execution will stop on a breakpoints set from the IDE. You’ll be able to view variables, evaluate expressions, set values on the fly, check inline variable views in the editor and more:
Limitations and known issues
In case you’d like to debug Linux target from macOS host, you have to use GDB version compiled with --target=x86_64-linux-gnu
flag. Get the binutils-gdb sources from the Git repository, switch branch to gdb-7.11.1-release and build like this:
./configure --target=x86_64-linux-gnu --with-python --prefix=make make install
Then select this debugger in the remote GDB configuration.
Be aware, that in case you set this debugger to be used globally in the IDE (in Build, Execution, Deployment | Toolchains settings) local debug on macOS won’t work, so we don’t recommend you doing so.
Besides note, that in case you have sources with symlinks on your host, to make remote debug work open project in CLion using the canonical paths (CPP-7052). Another problem could happen from time to time if you have another target configured in the ‘Before Run’ section of the configuration (CPP-7171).
Please, check the new functionality in case you are interested in remote debug, and provide the feedback to us in the comment section below or in our tracker. Note, that we already have some plans about UI improvements: CPP-7011, CPP-7050.
Environment variables in CMake
Our users asked us to define a way to automatically detect that CLion is used to run the CMake command on the project. After some discussion we’ve decided to introduce special environment variable (CLION_IDE) and implement environment variables completion in CMake to make it easier for you to find it:
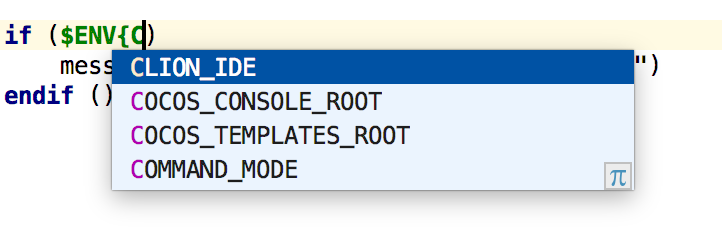
This way now you can detect CLion usage and if so, set special variables/paths or execute some additional scripts of your choice, or just add some extra logging to your CMake.
That’s it! Full list of release notes are available by the link.
Your CLion Team
JetBrains
The Drive to Develop
nigthsuns says:
July 6, 2016good job.
Sidney Just says:
July 6, 2016Yes! This is a huge step for CLion, thank you all so much for the hard work
Anastasia Kazakova says:
July 6, 2016Thanks for the support!
Sampo Karvonen says:
July 6, 2016Yay!
David Zemon says:
July 7, 2016Well done all! I’m very excited to try this at work tomorrow. Congratulations on getting remote debug in there!
Anastasia Kazakova says:
July 7, 2016Thanks! Feel free to share your impression after checking it.
David Zemon says:
July 7, 2016Pretty sad start so far 🙁
All I see in the console is:
“`
Cannot configure GDB defaults: Execution finished
STL pretty printers are not initialized for /privdir/igen006/software/clion-162.1236.1/bin/gdb/bin/gdb
“`
And more alarming is that the GDB tab in the Debugger tab is empty. Shouldn’t I normally see the standard GDB startup output, like the license info?
I have GDB set to bundled, target remote args don’t seem to make a difference (I tried “foobar” with no change) and both symbol file and sysroot are empty. No path mappings either.
David Zemon says:
July 7, 2016This problem may revolve around library compatibility. I get the same error when running a local debug session:
`
Process finished with exit code 0
Cannot configure GDB defaults: Execution finished
STL pretty printers are not initialized for /privdir/igen006/software/clion-162.1236.1/bin/gdb/bin/gdb`
And again, empty GDB tab. If I try to invoke the bundled GDB executbale from the terminal, I get errors:
`igen006@omhqv12915:~$ /privdir/igen006/software/clion-162.1236.1/bin/gdb/bin/gdb
/privdir/igen006/software/clion-162.1236.1/bin/gdb/bin/gdb: /lib64/libc.so.6: version `GLIBC_2.15′ not found (required by /privdir/igen006/software/clion-162.1236.1/bin/gdb/bin/gdb)
/privdir/igen006/software/clion-162.1236.1/bin/gdb/bin/gdb: /lib64/libc.so.6: version `GLIBC_2.14′ not found (required by /privdir/igen006/software/clion-162.1236.1/bin/gdb/bin/gdb)
igen006@omhqv12915:~$ `
I will open a ticket in YouTrack for this.
Anastasia Kazakova says:
July 7, 2016Thanks, we’ll check.
Anastasia Kazakova says:
July 8, 2016We are currently working on the problem. Please, use system GDB until we fix this (https://youtrack.jetbrains.com/issue/CPP-7146). Thanks!
Anastasia Kazakova says:
July 13, 2016The problem is fixed in the RC build published today.
Olof says:
July 7, 2016I have this problem as well. As a data point, if I run the tests outside the debugger it works.
Olof says:
July 7, 2016Another data point:
/data/clion-162.1236.1/bin/gdb/bin/gdb: /lib64/libc.so.6: version `GLIBC_2.15′ not found (required by /data/clion-162.1236.1/bin/gdb/bin/gdb)
/data/clion-162.1236.1/bin/gdb/bin/gdb: /lib64/libc.so.6: version `GLIBC_2.14′ not found (required by /data/clion-162.1236.1/bin/gdb/bin/gdb)
Anastasia Kazakova says:
July 7, 2016Thanks. Could you please remind which OS do you have? Was it RedHat or smth?
Anastasia Kazakova says:
July 8, 2016We are currently working on the problem. Please, use system GDB until we fix this (https://youtrack.jetbrains.com/issue/CPP-7146). Thanks!
Olof says:
July 8, 2016RHEL 6.4
Anastasia Kazakova says:
July 8, 2016Thanks
Anastasia Kazakova says:
July 13, 2016The problem is fixed in the RC build published today.
David Zemon says:
July 7, 2016If I use the system default GDB instead of bundled, I get better progress, but still failure. I’m running 64-bit CentOS 6.6 which has GDB 7.2 (I know… CLion warns only 7.8-7.11 is supported).
My console tab now shows that it is connected:
`STL pretty printers are not initialized for /usr/bin/gdb
Debugger connected to tcp:omhqv12916:2345`
and the GDB tab shows _something_ at least.
`GNU gdb (GDB) Red Hat Enterprise Linux (7.2-83.el6)
Copyright (C) 2010 Free Software Foundation, Inc.
License GPLv3+: GNU GPL version 3 or later
This is free software: you are free to change and redistribute it.
There is NO WARRANTY, to the extent permitted by law. Type “show copying”
and “show warranty” for details.
This GDB was configured as “x86_64-redhat-linux-gnu”.
For bug reporting instructions, please see:
.
Cannot access memory at address 0x7420656c62616e5d
Created trace state variable $trace_timestamp for target’s variable 1.`
David Zemon says:
July 7, 2016These memory errors turned out to be user error. I was loading the wrong symbols. Once I loaded the correct symbols, debugging worked nicely. Looks like it isn’t loading my ~/.gdbinit file though. And I’m still not sure why the bundled gdb doesn’t work
Brian Topping says:
July 7, 2016`git clone -b gdb-7.11.1-release –single-branch git://sourceware.org/git/binutils-gdb.git` will help speed things up if your connectivity to sourceware.org is not great.
Anastasia Kazakova says:
July 7, 2016Indeed. Thanks for the note!
Brian Topping says:
July 7, 2016For OS X folks: I updated Homebrew for the 7.11.1 version of GDB. PR is at https://github.com/Homebrew/homebrew-core/pull/2785. Feel free to go add “thumbs up” there 🙂
Brian Topping says:
July 13, 2016And it’s applied for some days now. OS X Homebrew users can just do `brew install gdb` to get the latest.
Roman says:
July 7, 2016Is it worth trying to launch remote debug with OpenOCD GDB server on Intel Quark board? Or it will not work for sure?
Anastasia Kazakova says:
July 7, 2016We haven’t tested the case, but no obvious reasons why it shouldn’t work, so you’d better try and share the results with us. Thanks.
Roman says:
July 7, 2016No, does not work properly. But remote gdb log shows it has connected and set breakpoints. However it does not stop on any breakpoint and I have no control over remote target.
Clion says GDB view is “read only”, so I can’t enter any commands to experiment.
Also it would be nice to have some startup options, like in Eclipse “GDB Hardware debugging” plugin, for example I want to sent a halt command after connection to remote target. Currently I receive an error in Clion:
“Unexpected response: @”target running\n” in Frames and Variables views.
Roman says:
July 7, 2016I don’t think it makes sense for you to investigate in this direction before you implement assembly support in Clion. Obviously, the first thing I want to debug on embedded target is boot code that will do system initialization, configure interrupts, stack etc.
Anastasia Kazakova says:
July 7, 2016Could you please describe this case in tracker in details? Looks like we are missing some real cases from our users that can help us make decisions about how remote debug should be supported in CLion. Thanks in advance.
Roman says:
July 8, 2016I don’t know why gdb console is not working in Clion with remote debug. I guess you will have to experiment with OpenOCD yourself, I can’t help here with a detailed bugreport.
Anastasia Kazakova says:
July 8, 2016Ok, I see, thanks.
R. says:
July 9, 2016I just spent some hours testing clion. Probably it’s quite nice for C++ developers; after all Jetbrains has some experience with IDEs.
For a C developer, however, it seems to be just useless crap.
My anger doesn’t stem from clion not yet being perfect. It stems from the fact that Jetbrains made clion bluntly, offensively and brutally C-ignorant and, no matter what they propagandize, C++ only. To make it worse Jetbrains also lied (A cross-platform IDE for C and C++)
You can’t even create a C project; *every*thing is C++ focussed only.
Following Jetbrains advice to create a C++ project and to hand-edit(!) it to become a C project in the Cmake file doesn’t work. It merely vomits a ton of errors.
I take clion to be a scam that misleads customers by promising what it doesn’t care about the least.
We are used to get crap and PR blabla, based on market studies from the usa. From Jetbrains I expected better and more honest.
Anastasia Kazakova says:
July 9, 2016Sorry for making you feel that way, but could you please share what kind of error you’ve got?
Anyway we do plan to add C-project template: https://youtrack.jetbrains.com/issue/CPP-860. Hopefully, we’ll do soon. Anything else you think is a ‘must-have’ for C developers? Please, share your ideas here. We’ll be glad to know.
Sebastian says:
July 11, 2016I agree that C support could be better and the fact one must create a C++ project and then manually rename main.cpp to main.c and edit the CMake file is not very elegant. It would be nice if CLion had an internal concept of the project model being C, C++ (or mixed?) and if the UI would react to that, for example when creating new files it could select .c/.h pairs for C projects and .cpp/.h pairs for C++ projects.
But the statement that CLion is useless for C is not quite true. I have successfully worked on several open source C projects. There are some minor glitches with syntax highlighting and the parser reports some false errors, but generally it works.
When you create a new project with CLion, just rename the main.cpp to main.c, then in CMakeLists.txt change the following:
Replace:
set(CMAKE_CXX_FLAGS “${CMAKE_CXX_FLAGS} -std=c++11”)
with
set(CMAKE_C_FLAGS “${CMAKE_C_FLAGS} -std=c11”)
and:
set(SOURCE_FILES main.cpp)
with:
set(SOURCE_FILES main.c)
Of course you also have to replace the content of the main.c with some C proper C code. But if you are a C programmer you should know how to do that.
Sebastian says:
July 11, 2016Anastasia,
CLion has got CMake variable completion since a few releases, but it seems that not all valid CMake variables are recognized by CLion.
For example when I use the `PkgConfig` module and do something like:
find_package(PkgConfig REQUIRED)
pkg_check_modules(GTK3 REQUIRED gtk+-3.0)
Then the pkg_check_modules function exports (among others) the following variables:
GTK3_INCLUDE_DIRS
GTK3_LIBRARY_DIRS
GTK3_LIBRARIES
See here for a complete list: https://cmake.org/cmake/help/v3.0/module/FindPkgConfig.html
It would be quite helpful if CLion could recognize these variables, and also if I could inspect the value of theses variables. Do you know if there is an open issue for that already?
Anastasia Kazakova says:
July 11, 2016Currently, completion works for CMake variable only, others (like these exported) are not yet supported. This work should be done within this ticket: https://youtrack.jetbrains.com/issue/CPP-4097
Tom Alexander says:
July 20, 2016This was released just in time! I’ve started working on cross-platform development for an embedded ARM target and have gotten cross compilation and cross platform remote debug to work with this early access release. I haven’t ported an real source code over yet though, that will be the real test.
Anastasia Kazakova says:
July 20, 2016CLion 2016.2 is released now: https://blog.jetbrains.com/clion/2016/07/clion-2016-2-released/
Also you might be interested: https://blog.jetbrains.com/clion/2016/06/clion-for-embedded-development/
Tom Alexander says:
July 20, 2016Thanks, Anastasia. One question, is there a way to tie the build configuration to the remote debug configuration? As it is now I have to select the build configuration to compile, then switch to the remote gdb configuration to debug.
Anastasia Kazakova says:
July 20, 2016You can configure another target/configuration in the Before Run section of the Remote GDB configuration, however we’ve caught some unstable problem there: https://youtrack.jetbrains.com/issue/CPP-7171
The Week in C++ 2016.27: July 3rd-9th | Utah C++ Users Group says:
July 20, 2016[…] CLion 2016.2 EAP: Remote GDB debug by Anastasia Kazakova […]
Ewout Boks says:
July 21, 2016Hello,
congratulations on expanding CLion’s capabilities, I like using it very much!
I am trying to debug remotely an arm cortex-m0 (stm32f0) . For that purp
ose I have a gdb init file with gdb commands to set up GDB to connect to my hw debugger (JLink) .
normally I would load the file into gdb with
arm-none-eabi-gdb -x jlinkstm32f072gdbinit.gdb .
How do I set up the “-x jlinkstm32f072gdbinit.gdb” in CLion’s remote debugger set-up ?
Thanks !
Anastasia Kazakova says:
July 22, 2016Thanks. Looks like it’s enough just to place your settings to ~/.gdbinit, GDB will get it from there by default:
https://sourceware.org/gdb/onlinedocs/gdb/gdbinit-man.html
Ewout Boks says:
July 22, 2016Hi,
configuring settings in .gdbinit will suffice for now. However, I have different HW target setups, and cramming them all in .gdbinit is not really optimal. Would it be possible to add a field in the GUI to pass extra arguments to gdb ?
Anastasia Kazakova says:
July 22, 2016Feel free to submit a feature request – https://youtrack.jetbrains.com/issues/CPP
andreabertini says:
July 24, 2016If you can do what he does VisualGDB with CLion could not be more complete and powerful.
Jens says:
August 1, 2016Hi,
I am using a .gdbinit with some custom “monitor” commands needed for my remote target. One of the monitor commands makes gdb output a custom string. When this happens, CLion aborts the debugging session with “Cannot configure GDB defaults: Unexpected response: ….”.
I have not found a way to make gdb to not output this. Is it possible to somehow make CLion ignore this output and continue?
Anastasia Kazakova says:
August 1, 2016Could you please create an issue here https://youtrack.jetbrains.com/issues/CPP and attach your gdbinit? We’ll keep an eye on it and investigate the issue.
lan says:
August 12, 2016I hope the debug from windows to linux gdbserver comming soon,the function is very important
Anastasia Kazakova says:
August 12, 2016We are going to work on this within 2016.3
lan says:
August 28, 2016Thanks a lot!
miaodx says:
September 23, 2016Really Really waiting for it.
Anastasia Kazakova says:
September 23, 2016It’s already there released with 2016.2. Feel free to try it.
Bob says:
September 12, 2016Hello, I try to debug Linux target from macOS host, bug the c++ file not stop on breakpoint.
What’s the problem
Bob says:
September 12, 2016and the console shows:
Debugger connected to tcp:192.168.60.153:8080
Debugger disconnected
Anastasia Kazakova says:
September 12, 2016Please, check the configuration settings:
– GDB (should be non-default on macOS to debug Linux target)
– symbol file (with debug symbols)
– path mappings between remote and local host
Bob says:
October 12, 2016the debugger connected to gdb server on linux, but not stop on the breakpoint I set in Clion, it just run to the end and exit
Bob says:
October 12, 2016I compile the c++ source file on linux and copy it to OSX host as symbol file
Anastasia Kazakova says:
October 12, 2016You have to provide path mappings (Linux <-> macOS) as well in that case. Otherwise GDB on macOS won’t get correct paths to stop on breakpoints in your code.
Long says:
February 14, 2019Hi Anastasia,
Does the path mappings have anything to do with the location of symbol file?
Let’s say I put the source in a Linux remote host at the path: /remote-workspace/projects/a
and in the my Mac local machine at path /local-workspace/projects/a
I copy the symbol file from the remote host to my local machine at path: /symbols/a.so
then I set path mappings to:
/remote-workspace/projects/a /local-workspace/projects/a
Right now I can connect to the remote gdbserver, however when I try setting breakpoints, I get this error:
“No source file named local-workspace/projects/a/code/main.cpp”
I’ve already used the gnuGdb.
Thanks
Anastasia Kazakova says:
February 14, 2019I assume you have this file local-workspace/projects/a/code/main.cpp, don’t you?
Ps says:
October 10, 2016I’m trying to debug a microcontroller but I’m having trouble finding a place to put the needed GDB commands because there are no options for a GDB script for remote debugging. Was it left out intentionally?
When I try to create a bash script that includes the ‘-x myscript.gdb’ and any other arguments passed to it, debugging doesn’t work. I hope I’m just missing something…
Anastasia Kazakova says:
October 10, 2016Just place the gdbinit file in the home directory – GDB will read it on start.
Bob says:
October 14, 2016My clion working path on OSX is /Users/n-188/clion/test, a main.cpp file, mapping path to /home/n-188/clion/test on linux
Please check my step
1 : gcc -o main main.cpp
compile main.cpp on linux
2: gdbserver :8080 main
run gdbserver on linux
3: copy the execute file main to my local mac host
4: Configuration settings
config local gdb and target remote args
config the main file as symbol file
config path mapping:
/home/n-188/clion/test /Users/n-188/clion/test
5: run the gdb debug, the debugger connected to gdb server
and run to end
I still don’t know how the remote gdbserver find the breakpoints I set on the main.cpp file on my local clion.
Thank you very much
Anastasia Kazakova says:
October 14, 2016Could you please attach the screenshot of the Remote GDB Debug configuration settings set in CLion?
Bob says:
October 17, 2016I just create a issue and attach the screenshot of the configuration.
https://youtrack.jetbrains.com/issue/CPP-7867.
Please check it.
Anastasia Kazakova says:
October 17, 2016Thanks, please proceed in the YouTrack ticket.
Suresh Subramani says:
October 14, 2016How do I remote debug the code running on mac host with CLion running on the same host too, using lldb, since that is what is used for CLion on OS X.
Anastasia Kazakova says:
October 17, 2016Why do you need the remote debug in that case? You can use attach to local process functionality I suppose.
Mikhail Romaneev says:
October 14, 2016Hello!
To be able to attach to local processes with gdb on Ubuntu 14.04 (and I think on most linux systems with kernel protections) user have to make some changes in Ubuntu config files, specifically in /etc/sysctl.d/10-ptrace.conf . Please add that information to Clion’s user manual. You can read more about that here : http://askubuntu.com/questions/41629/after-upgrade-gdb-wont-attach-to-process .
Anastasia Kazakova says:
October 17, 2016Thanks, we’ll check it.
Anastasia Kazakova says:
October 17, 2016This information is already present in our webhelp: https://www.jetbrains.com/help/clion/2016.2/attaching-to-local-process.html#d1797e37. Thanks anyway.
Jose Clua says:
October 18, 2016Hi,
Please help. I am trying to remote debug using gdbserver/CLIon without success.
I am able to debug using terminal with these commands:
– gdb myprog
– break myprog.c:4115
– run –myarg
– the breakpoint works and I can step in the program
Now when I try the remote debug using CLion 16.2.2 in Fedora System:
– in server I run: gdbserver localhost:8080 myprog –myarg
– I get this: Process data created; pid = 80199 Listening on port 8080
– In Fedora client with CLion:
– Settings / Deployment / configure SFTP (upload and download working fine)
– Download all files from server
– Edit Configuration
– Create new GDB Remote Debug:
– GDB: Default (Bundled)
– Target: tcp:193.101.144.128:8080
– Symbol file: {blank}
– Sysroot: {blank}
– Path Mapping: server path and local path
– Place the breakpoint in line 4115
– Run the debugger
– on the server terminal I see:
– Remote debugging from host 172.24.10.2 (this makes me believe I am close)
– address_string = T:servername:4311
– In CLion console I see:
– Debugger connected to tcp:193.101.144.128:8080 (connection works!)
Although it seems the connection from the GDB server and client is working it seems I – am missing something because the debugger tools (step in, step over, continue, etc.) remain grayed out and the breakpoints are never reached.
Note: In the bottom of the IDE I see this message: IBus prior to 1.5.11 may cause input problems
From the first test I know that the breakpoints I am using should work.
I suspect the way I am using to pass in the program argument (–myarg) in this line: gdbserver localhost:8080 myprog –myarg its not right but I don’t know where else to pass it.
I am looking forward to be able to debug using this awesome IDE rather than using the terminal. I am close but got stucked here. I really appreciate some help!
Thank you
Anastasia Kazakova says:
October 18, 2016You need to also provide a file with debug symbols. It can be simply an executable built with debug and copied to your Fedora host.
Jose Clua says:
October 19, 2016Hi Anastasia,
We use gmake to build the program. Is that ok?
I used gmake -d and copied the executable file to the Fedora host and configured the Symbol file.
Now in the server I see: readchar: Got EOF
Remote side has terminated connection. GDBserver will reopen the connection.
And in the client console I see: Command timed out
Any thoughts?
Thank you!
Anastasia Kazakova says:
October 19, 2016Hm, do you have a CMake project to open in CLion in that case?
Jose Clua says:
October 19, 2016I just downloaded the files from the server but I could not actually build the program locally (Fedora), I can only build and run in the server (Red hat). I thought it wouldn’t be a problem because I was doing a remote debug.
Thanks!
Anastasia Kazakova says:
October 19, 2016I’m not talking about if build is working locally or not, but you need a CMake project to open in CLion.
Jose Clua says:
October 20, 2016I created a CMakeList.txt but still no luck. I believe it’s not so straightforward. I am looking into posts such as the one bellow and trying to figure how to convert MakeFile project into a CMake project. The system I am working with it’s huge and has several modules and dependencies among them so that makes things difficult.
In the meantime I will keep debugging using gdb command line.
Thanks!
http://stackoverflow.com/questions/18680977/converting-a-makefile-project-to-cmake
Anastasia Kazakova says:
October 20, 2016Jose, could you please submit some logs (follow the instruction here: https://intellij-support.jetbrains.com/hc/en-us/articles/206560589-Debugger-doesn-t-stop-on-a-breakpoint-Debugger-shows-Command-timed-out-What-to-do-) to our support, when ‘Got EOF’ problem happens?
Jose Clua says:
October 20, 2016OK done. I’ve attached the log file.
readchar: Got EOF message shows in the server terminal session when I start the debugger in the debug client :
Listening on port 8080
Remote debugging from host 172.24.10.2
readchar: Got EOF
Remote side has terminated connection. GDBserver will reopen the connection.
Thank you
Anastasia Kazakova says:
October 20, 2016Thanks, we got it. We’ll take a look and reply to you there.
Galis says:
November 13, 2016First,thanks clion provide the good job for gdb test. There is a problem when i used gdb to debug my application.When add a watch for the variable ,I got the info “-var-create: Usage: NAME FRAME EXPRESSION.”.Eh,is there any idea for this ?
Anastasia Kazakova says:
November 13, 2016Could you please share logs with us when the problem occurs: https://intellij-support.jetbrains.com/hc/en-us/articles/206560589-Debugger-doesn-t-stop-on-a-breakpoint-Debugger-shows-Command-timed-out-What-to-do-
Feel free to submit them via support. Code sample could be useful as well, if possible.
Galis says:
January 6, 2017Oh,I still could not resolve this problem util now.Where can I get the log for clion? Can you tell me your email if possible ?
Galis says:
January 6, 2017I have got the log and I found the error at the follow lines.
2017-01-06 15:14:07,018 [ 21091] INFO – .diagnostic.PerformanceWatcher – Unindexed files update took 14065ms; general responsiveness: ok; EDT responsiveness: 1/14 sluggish, 1/14 very slow
584 2017-01-06 15:14:07,055 [ 21128] INFO – #com.jetbrains.cidr.lang – Building Module Maps finished in 0 s.
585 2017-01-06 15:14:07,055 [ 21128] INFO – #com.jetbrains.cidr.lang – Building Module Maps finished in 0 s.
586 2017-01-06 15:14:07,065 [ 21138] INFO – #com.jetbrains.cidr.lang – Clearing symbols finished in 0 s.
587 2017-01-06 15:14:07,070 [ 21143] INFO – #com.jetbrains.cidr.lang – Clearing symbols finished in 0 s.
588 2017-01-06 15:14:07,458 [ 21531] INFO – #com.jetbrains.cidr.lang – Loading symbols finished in 0 s.
589 2017-01-06 15:14:07,475 [ 21548] INFO – #com.jetbrains.cidr.lang – Building symbols finished in 0 s.
590 2017-01-06 15:14:07,478 [ 21551] INFO – #com.jetbrains.cidr.lang – Saving symbols finished in 0 s.
591 2017-01-06 15:14:07,758 [ 21831] INFO – #com.jetbrains.cidr.lang – Loading symbols finished in 0 s.
592 2017-01-06 15:14:07,767 [ 21840] INFO – #com.jetbrains.cidr.lang – Building symbols finished in 0 s.
593 2017-01-06 15:14:07,770 [ 21843] INFO – #com.jetbrains.cidr.lang – Saving symbols finished in 0 s.
594 2017-01-06 15:15:04,919 [ 78992] INFO – term.terminal.ui.TerminalPanel – WARNING: Font Anonymice Powerline is non-monospaced
595 2017-01-06 15:15:05,007 [ 79080] ERROR – terminal.emulator.JediEmulator – Error processing OSC 1;..os/linux-0.12^G
596 2017-01-06 15:15:07,193 [ 81266] ERROR – terminal.emulator.JediEmulator – Error processing OSC 1;bochs^G
597 2017-01-06 15:15:10,058 [ 84131] INFO – brains.cidr.execution.debugger – Debugger started
598 2017-01-06 15:15:15,587 [ 89660] WARN – brains.cidr.execution.debugger – >-var-create – 0x3356c “((long)(memory_end))”
599 2017-01-06 15:15:15,588 [ 89661] WARN – brains.cidr.execution.debugger – -var-create – 0x3356c “memory_end”
601 2017-01-06 15:15:15,595 [ 89668] WARN – brains.cidr.execution.debugger – -var-create – 0x3356c “((struct drive_info)(drive_info))”
603 2017-01-06 15:15:15,603 [ 89676] WARN – brains.cidr.execution.debugger – -var-create – 0x3356c “drive_info”
605 2017-01-06 15:15:15,605 [ 89678] WARN – brains.cidr.execution.debugger – -var-create – 0x3356c “((long)(memory_end))”
607 2017-01-06 15:15:15,643 [ 89716] WARN – brains.cidr.execution.debugger – -var-create – 0x3356c “memory_end”
609 2017-01-06 15:15:15,646 [ 89719] WARN – brains.cidr.execution.debugger – <^error,msg="-var-create: Usage: NAME FRAME EXPRESSION."
610 2017-01-06 15:15:45,646 [ 119719] ERROR – terminal.emulator.JediEmulator – Error processing OSC 1;..os/linux-0.12^G
611 2017-01-06 15:15:50,459 [ 124532] ERROR – brains.cidr.execution.debugger – Remote connection closed
Andre PArodi says:
November 22, 2016This looks good.
I am trying to debug using arm-linux-androideabi-gdb in ndk. I have a couple of issues.
– I am selecting my .so file but it doesn’t seem to be loading the symbols. in cmd line gdb i was loading them using set solib-search-path. Would it not be better to support that?
– when it connect it automatically does a continue. It would be nice to be able to select this. I typically like to hit continue myself.
– I instinctively feel like I would like to run gdb commands directly in an interactive shell. maybe if the above problem is fixed I wouldn’t feel the urge to.
Anastasia Kazakova says:
November 22, 2016That’s interesting case actually. Thanks for sharing.
Feel free to create feature requests here: https://youtrack.jetbrains.com/issues/CPP
Eldar Abusalimov says:
November 23, 2016Andre, thank you for the detailed feedback! I replied you in https://youtrack.jetbrains.com/issue/CPP-7322.
Jerome says:
January 23, 2017Hi,
Is there any chance that remote debug using lldb (instead of gdb) will be supported at some point in the future (in this particular case: host = MacOS, target = arm-linux (RPi))?
Or am I missing something, and is this already possible in some way?
Anastasia Kazakova says:
January 23, 2017In theory, we do consider this – https://youtrack.jetbrains.com/issue/CPP-7048. However, we haven’t tried it yet and not sure how technically difficult is that. We’ll try when have some free resources.
Jerome says:
January 23, 2017Thanks.
Then I hope you will have some resources “free” in the near future 😉
Viacheslav Slavinsky says:
February 14, 2017I’m trying to setup a debug target with JLink. My GDB Remote Debug is set up like so:
GDB: /opt/arm/bin/arm-none-eabi-gdb
‘target remote’ args: 127.0.0.1:2331
My ~/.gdbinit (it’s not fantastically convenient to have it in ~ instead of project dir btw):
target remote 127.0.0.1:2331
monitor reset
load
si
This works perfectly from the the command line. Actually it even works with CLion once I have executed the commands from .gdbinit by hand. But I cannot make it just work when launching the debug configuration. When I launch it, in the Console I see:
Cannot configure GDB defaults: Cannot change this setting while the inferior is running.
Debugger connected to 127.0.0.1:2331
In GDB window I see things like:
Type “apropos word” to search for commands related to “word”.
/Users/svo/.gdbinit:3: Error in sourced command file:
“monitor” command not supported by this target.
Oh yes it is perfectly supported. If I press pause and enter them by hand, they work. This suggests that CLion runs gdb in some weird way. It does not really help if i try and change .gdbinit. What am I doing wrong? This is extremely frustrating.
Eldar Abusalimov says:
February 14, 2017I understand your frustration, there’re some features that could be implemented better, remote debugging of J-Link/OpenOCD targets in particular. However, there seem to be a workaround for this case, please try a solution described here and tell whether it helps: http://stackoverflow.com/a/39828850/545027
Viacheslav Slavinsky says:
February 17, 2017I see what’s going on now. The solution from the referenced post looks like it could work, I’m looking forward to a free afternoon to try it out. Meanwhile I really appreciate the help, thank you!
Roi says:
March 6, 2017Hi,
As I didn’t understand it from the text
* Is it possible to remote debug a linux machine from a windows host (GDB/gdbserver)?
* Is it possible to specify on the windows host the symbol/source files?
Roi says:
March 6, 2017Publish the question in the 2016.3 page as there I understood that the remote debugging I asked about is possible.
Anastasia Kazakova says:
March 6, 2017Yes, starting from 2016.3: https://blog.jetbrains.com/clion/2016/11/clion-2016-3-eap-remote-gdb-debug-udl-rename-and-code-analysis-fixes/#remote_debug
Preethi Srinivasan says:
May 1, 2017I am having trouble using GDB remote debug.
I have a Linux project which I am trying to develop and build in a Windows PC. I have a remote Linux PC to which I am trying to remotely attach my clion for debugging purposes..
The error that i am getting in Clion Console is :
Remote register badly formatted: T0506:0000000000000000;07:305f8f1aff7f0000;10:00fbee192e7f0000;thread:p3563.3563;core:a;
here: 00000000;07:305f8f1aff7f0000;10:00fbee192e7f0000;thread:p3563.3563;core:a;
Debugger disconnected
The message shown in gdb-remote server is :
Remote debugging from host 10.49.236.45
readchar: Got EOF
Remote side has terminated connection. GDBserver will reopen the connection.
Eldar Abusalimov says:
May 2, 2017Tracked as https://youtrack.jetbrains.com/issue/CPP-9670 “Got EOF” error in gdb-server while using remote-gdb debug in CLION
Logs attached suggest that you use a native Cygwin gdb to remotely debug a Linux target, which is not supported by your gdb:
warning: A handler for the OS ABI “GNU/Linux” is not built into this configuration
of GDB. Attempting to continue with the default i386:x86-64 settings.
warning: Architecture rejected target-supplied description
You need a cross-gdb in order to debug a target of different architecture, see here for the details: https://blog.jetbrains.com/clion/2016/11/clion-2016-3-eap-remote-gdb-debug-udl-rename-and-code-analysis-fixes/#remote_debug
Jan says:
May 23, 2017Do I always have to manually start the remote target under gdbserver? Is there something like the following workflow supported? If I Debug the current configuration all of the following steps will be automatically executed:
1. Build outdated projects
2. Deploy updated outputs to remote target
3. Start remote debugging
It seems like step 2 and 3 must be done manually.
Anastasia Kazakova says:
May 23, 2017Currently yes. Remote deploy and remote start is not yet supported. You can however open a built-in terminal and execute commands there.
Jason says:
November 4, 2018It has been a year now, any update on automating step 2 and 3?
Anastasia Kazakova says:
November 4, 2018This is a case for remote dev which is now in EAP. It builds, run and debug apps on remote machine, with an IDE running on a local machine.
Jason says:
November 4, 2018The 2018.3 EAP is going after a different use case than 2016.2 which is build on local machine and run/debug on remote target. Remote target only needs GDB server + binary program executable, nothing else is needed. It’s almost there except automatic syncing binary to remote machine + automatic starting GDB debug session + possibly startup script (needs to do manually). This use case is supported by eclipse out of the box unfortunately I don’t know why Clion never wanted to finish it.
Anastasia Kazakova says:
November 4, 2018It’s still planned: https://youtrack.jetbrains.com/issue/CPP-7050
But the full remote case has now higher priority upon this.