Rapidly find and fix failures with Undo’s plugin for CLion
Hi,
Tracking down bugs is one of the most time-consuming parts of a developer’s job. Code almost never works first time and more often than not there are problems to diagnose and fix even once code is deployed. To help users of CLion, Undo has partnered with JetBrains to bring its next generation debugging technology to the IDE. This is a guest blog post from the Undo team.

Undo is a Cambridge, UK-based startup and its software lets Linux and Android developers see exactly what their program did at every step in its execution. This helps companies respond quickly to failures in development, test and production, to increase their productivity and to improve software quality. CLion is an IDE by JetBrains that helps make software development more productive and enjoyable for C and C++ developers. By combining CLion with Undo, developers will now be able to find and fix failures fast, and generate recordings of failures which can then be debugged on different machines.
So how does it work? Undo’s technology captures the necessary information required to replay the behaviour of Linux and Android software down to single instruction granularity. Put simply, it lets you record, rewind, and replay your application without consuming too much memory or running too slowly. With UndoDB, Undo’s reversible debugger, you can step forward and backwards inside your program, seeing exactly what happens leading up to the bug striking. Using Undo’s Live Recorder, a recording of the failure can be generated and replayed on any machine the developer chooses – incredibly useful if the bug shows up in testing or on a customer machine. The value of every memory location and every register is available at all points in the recording of the program’s execution.
Until now CLion on Linux has used GDB by default, but with a simple configuration change developers can now use UndoDB instead. JetBrain’s CLion is the latest IDE to support UndoDB, which can be used directly from the GDB command-line interface but also from a variety of graphical front-ends. Recordings can be created directly with Undo’s Live Recorder for subsequent analysis in UndoDB/CLion, and a beta version of the Undo-CLion plugin is now available from JetBrains’ plugin repository.
Let’s take a look at how Undo helps CLion developers find (and consequently fix) bugs:
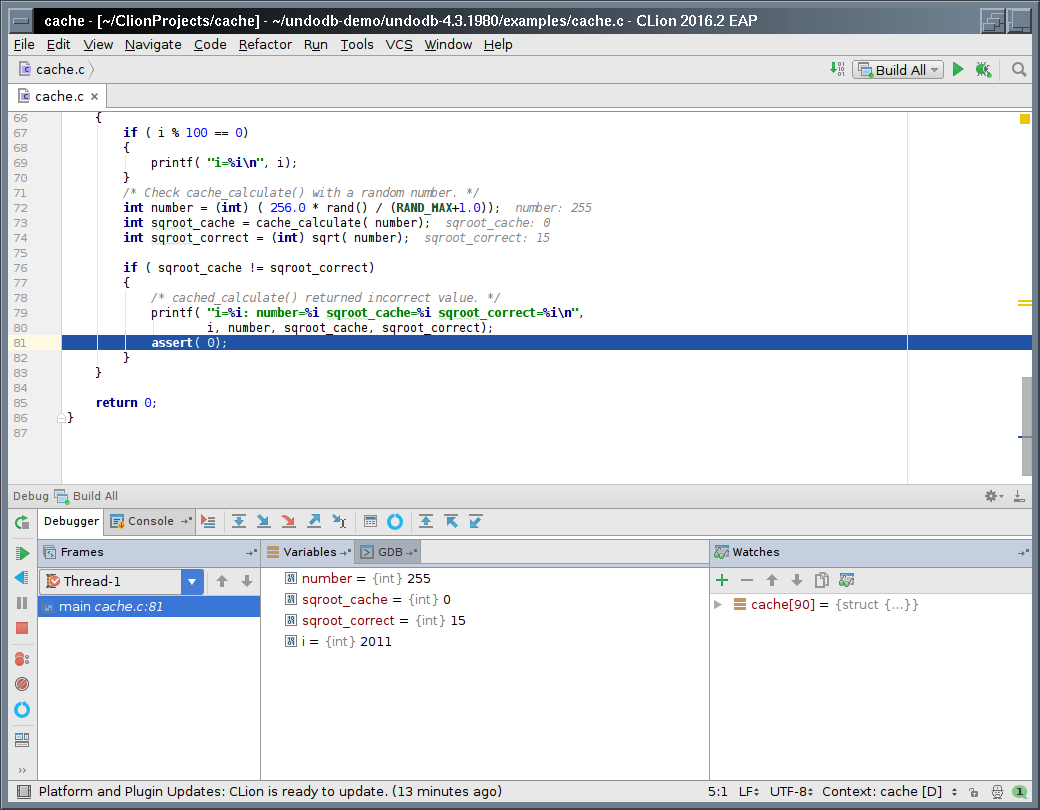
A problem has occurred, so the developer has clicked the green bug button in the top right corner of the window. This brings up the familiar CLion debugger interface, which now features some additional buttons:
On the top row of the debugger window there are four new buttons to use:
 The near complete circle allows you to load an Undo Recording, created previously on this machine or on a different machine.
 The arrow between two lines lets you Reverse Step Over back to the preceding line in your program’s execution history, but stepping over function calls. It’s the opposite of GDB’s ‘next’ command.
 The arrow pointing top left lets you Reverse Step In back to the preceding line in your program’s execution history, whether that line was in the current function or a called function. It’s the opposite of GDB’s ‘step’ command.
 The arrow pointing bottom left lets you Reverse Step Out within your code, taking you back to the line that called the current function. It’s the opposite of GDB’s ‘finish’ command.
On the left hand side there are forward and reverse continue buttons:
 The top one (forward facing) continues the program within the debugger, running the program until it encounters a breakpoint or watchpoint or until it receives a signal.
 The lower button continues the program backwards within the debugger, winding the entire program state back until the most recent breakpoint or watchpoint triggers, or until the most recent signal in the program’s recording history.
 There is also a second load Undo Recording button that operates identically to the one in the top row.
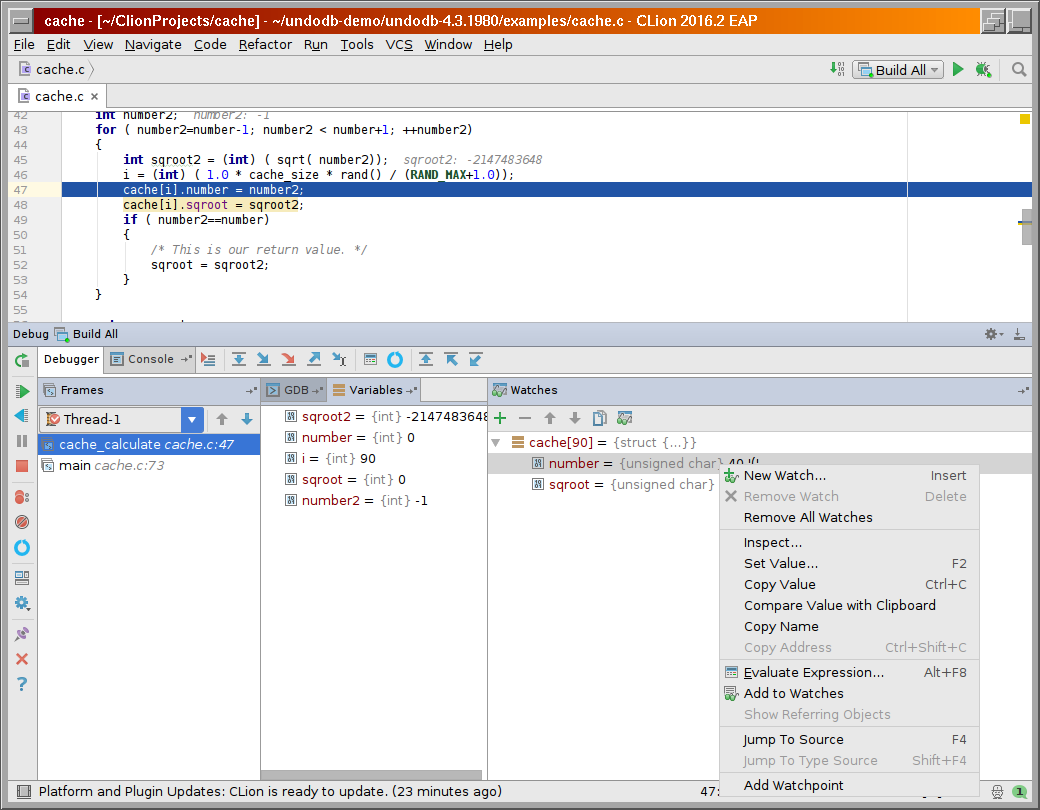
CLion developers will be familiar with the idea of watches and watchpoints when it comes to debugging. A watch displays the contents of a variable every time a program stops, while a watchpoint halts program execution when a watched variable changes.
With Undo, developers can reverse continue until a watchpoint triggers, making it trivial to identify where issues are occurring. This is particularly valuable for memory corruption bugs, but also for logic errors, race conditions and many other kind of subtle bugs.
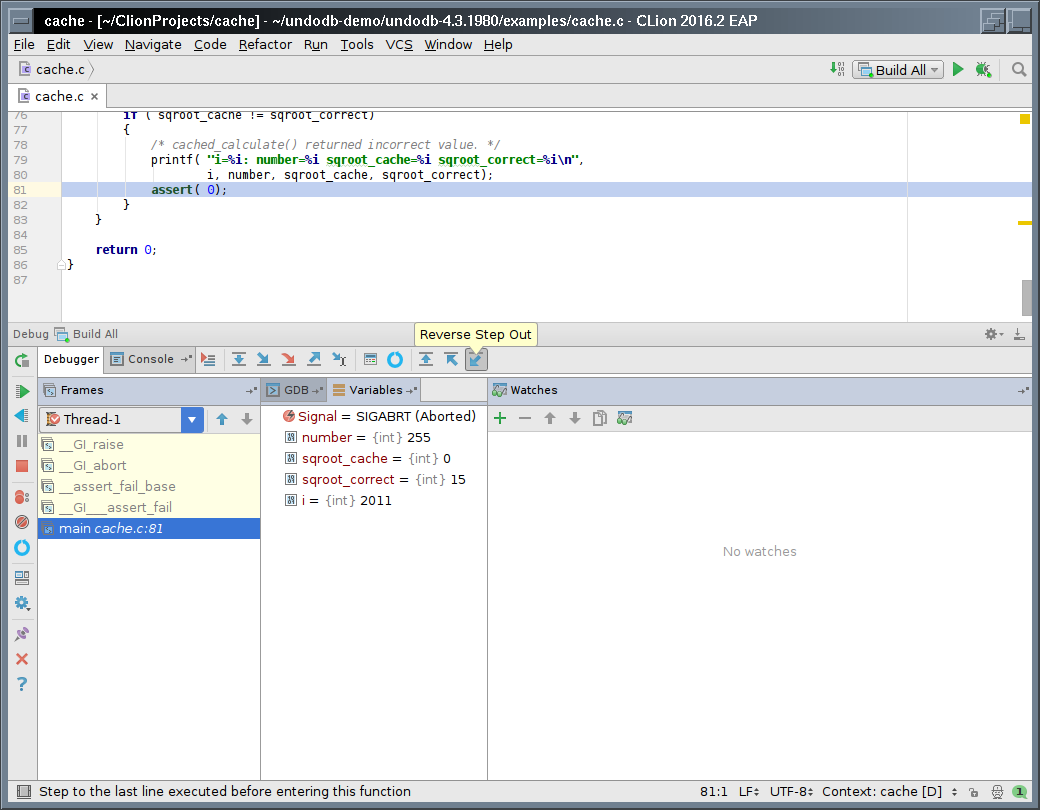
This screenshot shows a typical bug. An Assert has failed. By clicking on the ![]() Reverse Step Out button you can go back within the code, essentially unwinding the program state, based on function calls, rather than line by line. You can see the function calls highlighted in yellow in the debugger window. This makes it much easier to see exactly what your program has done, and why it did what it did.
Reverse Step Out button you can go back within the code, essentially unwinding the program state, based on function calls, rather than line by line. You can see the function calls highlighted in yellow in the debugger window. This makes it much easier to see exactly what your program has done, and why it did what it did.
Undo in action
Let’s look at a typical agile development scenario which will be most familiar to testers and those using continuous integration:
- The CI infrastructure (such as TeamCity or Jenkins) notifies the developer that a test has failed.
- Along with artefacts of the failure such as logs and corefiles, the CI infrastructure has been extended to include a recording of the failed test, generated by Live Recorder.
- The developer loads the recording into CLion using the
 Load recording button.
 - She or he can then step forward and backwards in the code to find the root cause of the bug – all without leaving CLion!
- Success! The bug is fixed quickly and the developer moves onto his or her next activity.
A beta version of the Undo-CLion plugin is now available from the JetBrains’ CLion plugin repository. A free 30 day trial of UndoDB can be downloaded directly from the Undo website at http://undo.io/get-started-undodb/. If you wish to try Live Recorder, complete the form to get your free 30 day evaluation http://undo.io/get-started-live-recorder/.

