

2019.2 Features that Make Debugging Easier

GoLand 2019.2 brings with it a lot of new features and bug-fixes. In addition to making the debugger compatible with the new features in Go 1.13, we’ve added a few more things to help you debug code even more quickly and efficiently.
- Function call support
- Better types representation
- Support for custom value representation via helper methods
- Default representation for int types
Function call support
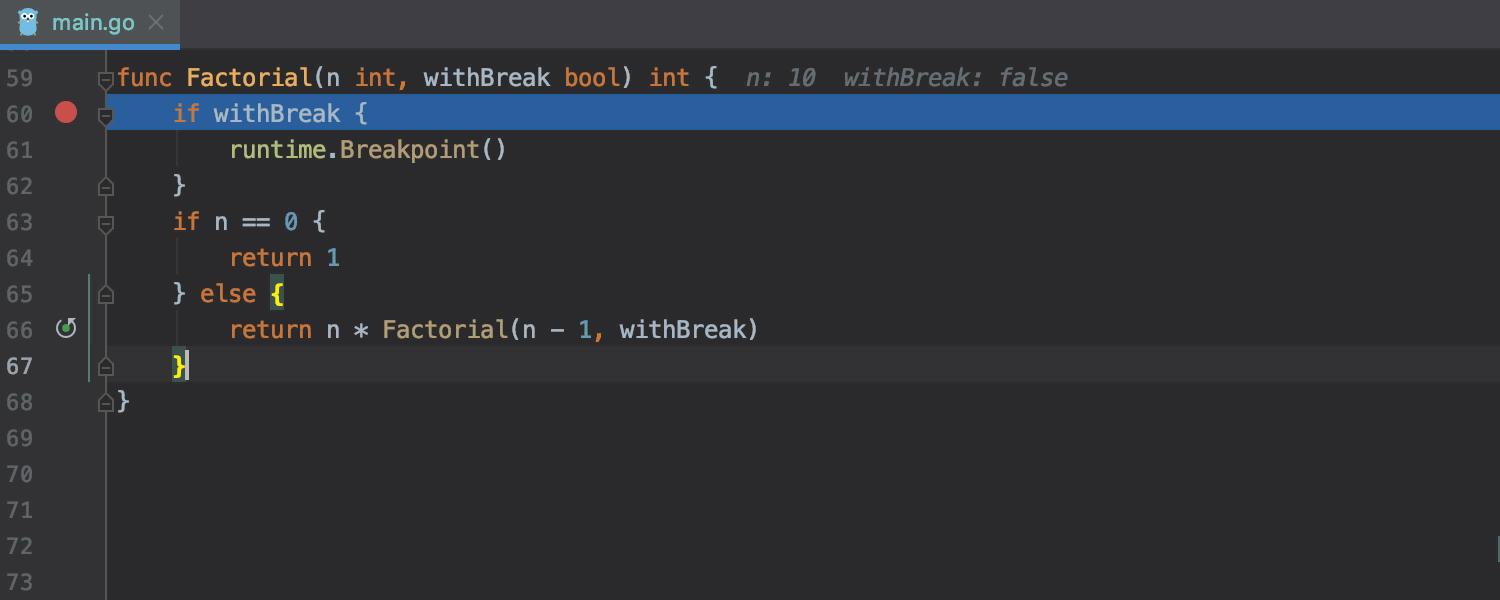
Let’s start with one of the most highly anticipated and requested features: function call support.
With this new version, you can now call functions during a debugging session. This is made possible thanks to some experimental support in Delve, the underlying debugger used by the IDE, and experimental function call support in the Go runtime.
To use this feature, your applications must be compiled with Go 1.11 or newer, but we recommend using Go 1.12 or even Go 1.13 where possible. This is because the compiler/runtime will contain further improvements for this feature, along with many other benefits for your application.
There are some limitations and bugs still floating around which you might still bump into. If you come across any, or if this feature does not work as you’d expect, we’d appreciate it if you could report them to us and help us reproduce them.
What does this mean for you? You will now have a better experience debugging because you can monitor function call results and debug results from function call chains without having to break them into separate calls.
Better types representation
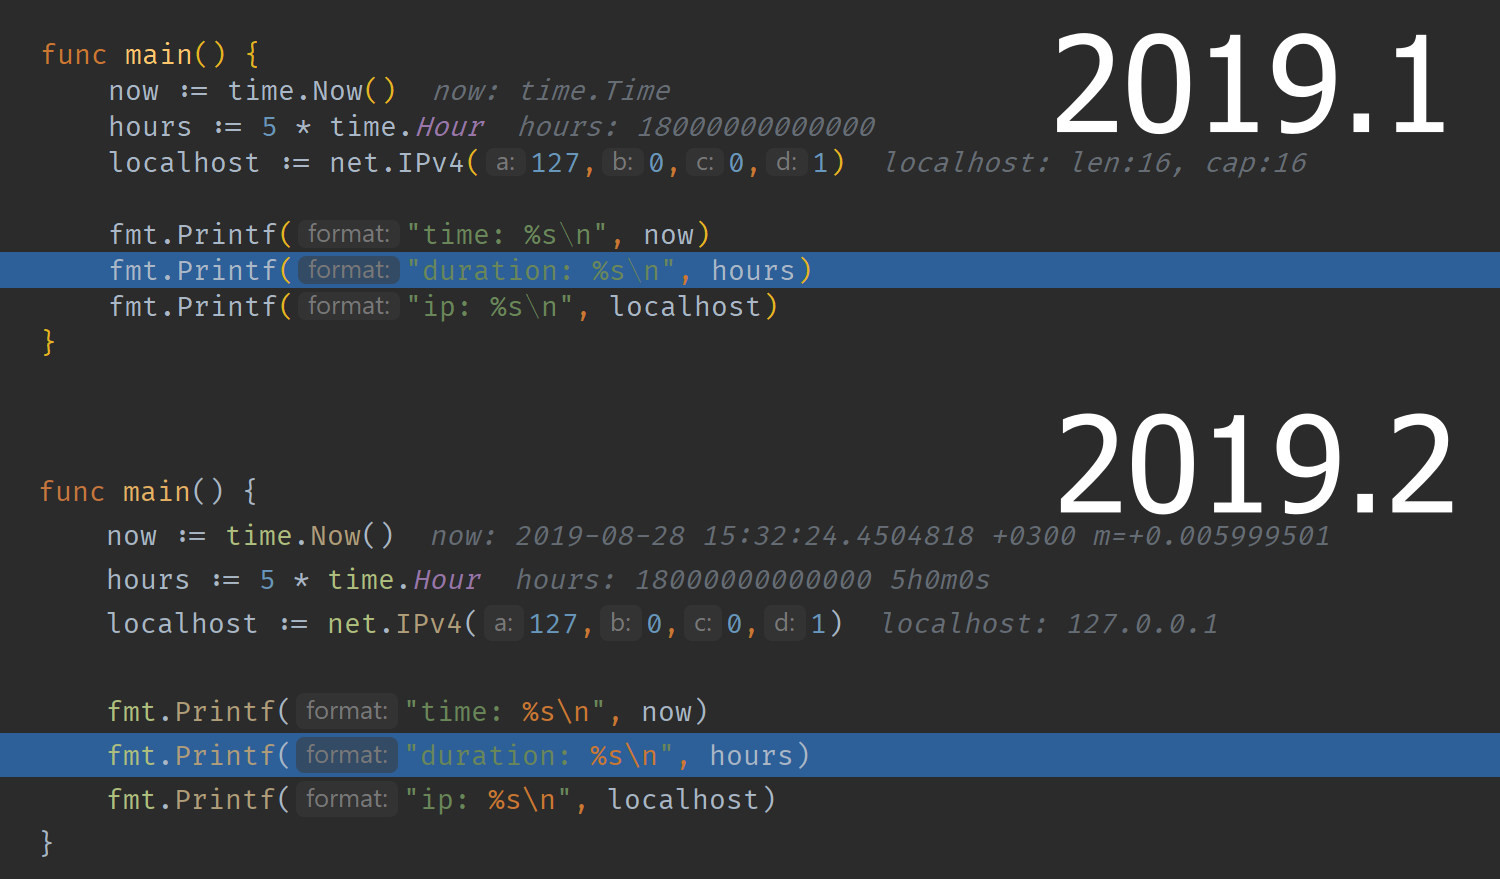
Moving on with the list of changes for the debugger, let’s look at a new feature: improved representation of special types. These special types are time.Time, time.Duration, and net.IP.
Below is a comparison of these types displayed in 2019.1 and 2019.2. As you can see, it’s much easier to work with code that contains these types in the new version.
Support for custom value representation via helper methods
Speaking of better representation for types, if your type defines any of the methods DebugString, String, and Error, and they are simple to evaluate, then the IDE will automatically display their values.
While the DebugString method is specific to our implementation, we hope that it will start being adopted by people in their code. Meanwhile, the signature of the String and Error methods is the same as in the “Stringer” and “error“ interfaces, which makes them easy to use in existing codebases.
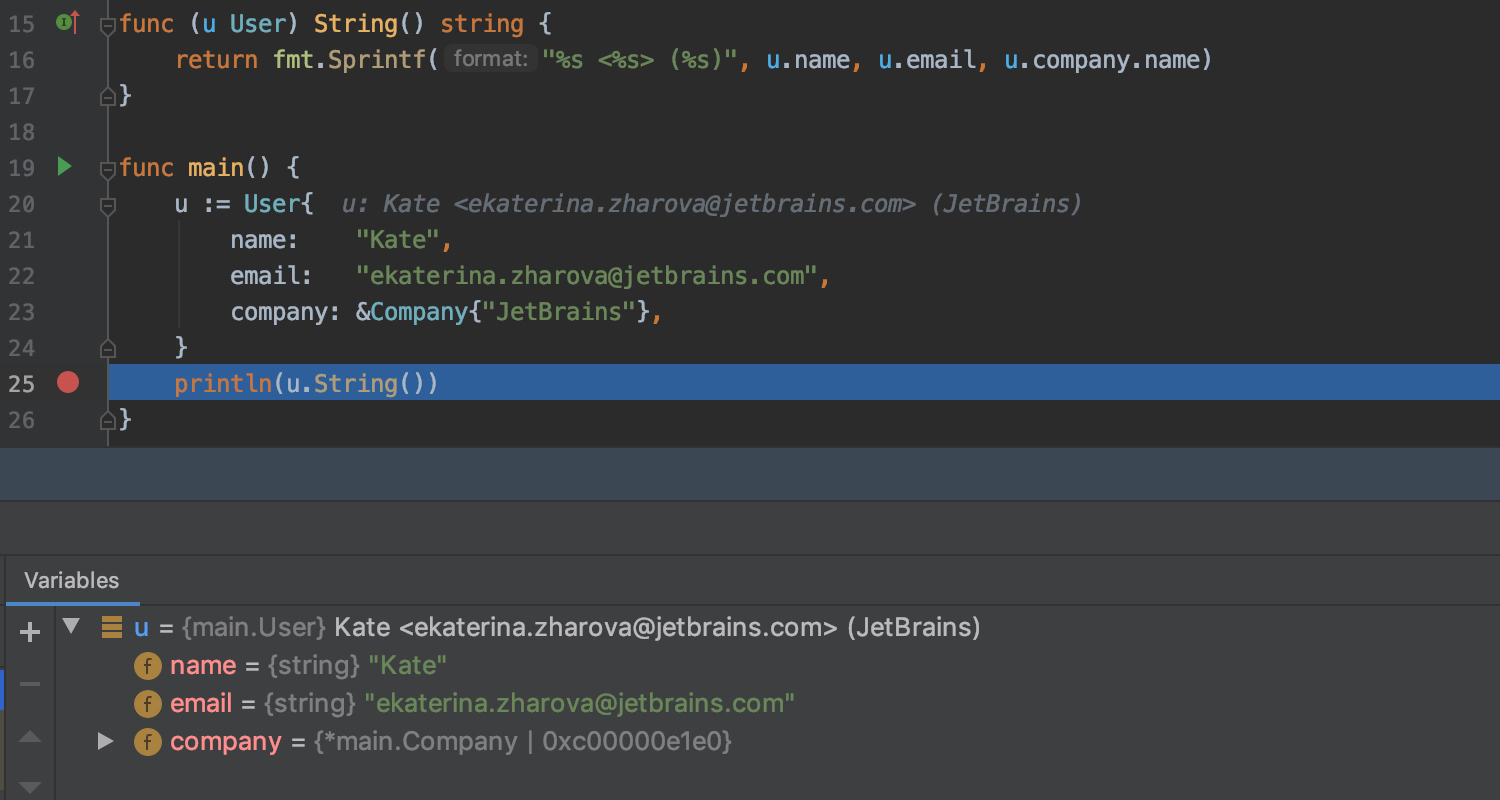
You may wonder if this is done using the function call support since we just talked about it, but the answer, in this case, is no, it’s not. One of the reasons we chose not to implement this is that executing a function may affect the state of the program, as the runtime needs to perform some internal operations. So, instead of showing the result of the call to display the results, the feature might accidentally trigger an unwanted state or obscure that really hard-to-catch bug you are looking for.
You may be wondering what we mean when we say a function method is “simple to evaluate”. It means that the method returns a value that can be:
- A string literal.
- A receiver field expression.
- A call to fmt.Sprintf() with a constant format containing only supported verbs and either string literals or receiver field expressions as format arguments.
The supported verbs are %t, %b, %d, %x, %X, %s, %f, %F, %q, and %p, without a width, precision, and argument index.
What if a type contains all or several of these methods? Then the order they are evaluated/used is DebugString, then String, and then Error.
Default representation for int types
Another change in the debugger is how the int values can be displayed.
Previously, you could see the integer types by right-clicking on them in the debug view, selecting View As, and choosing the representation style.
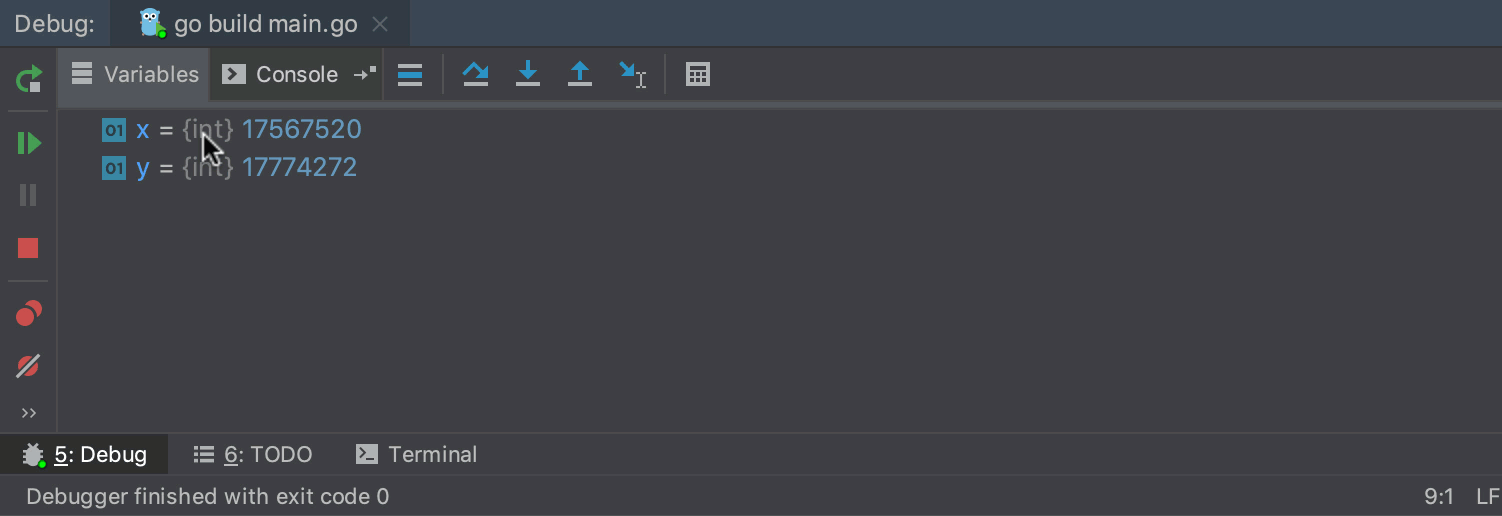
Now the IDE offers the option to represent int values as binary, decimal, or hexadecimal by default. So if your code uses ints as those types more often, you can enable this feature and have a better view of those values by default.
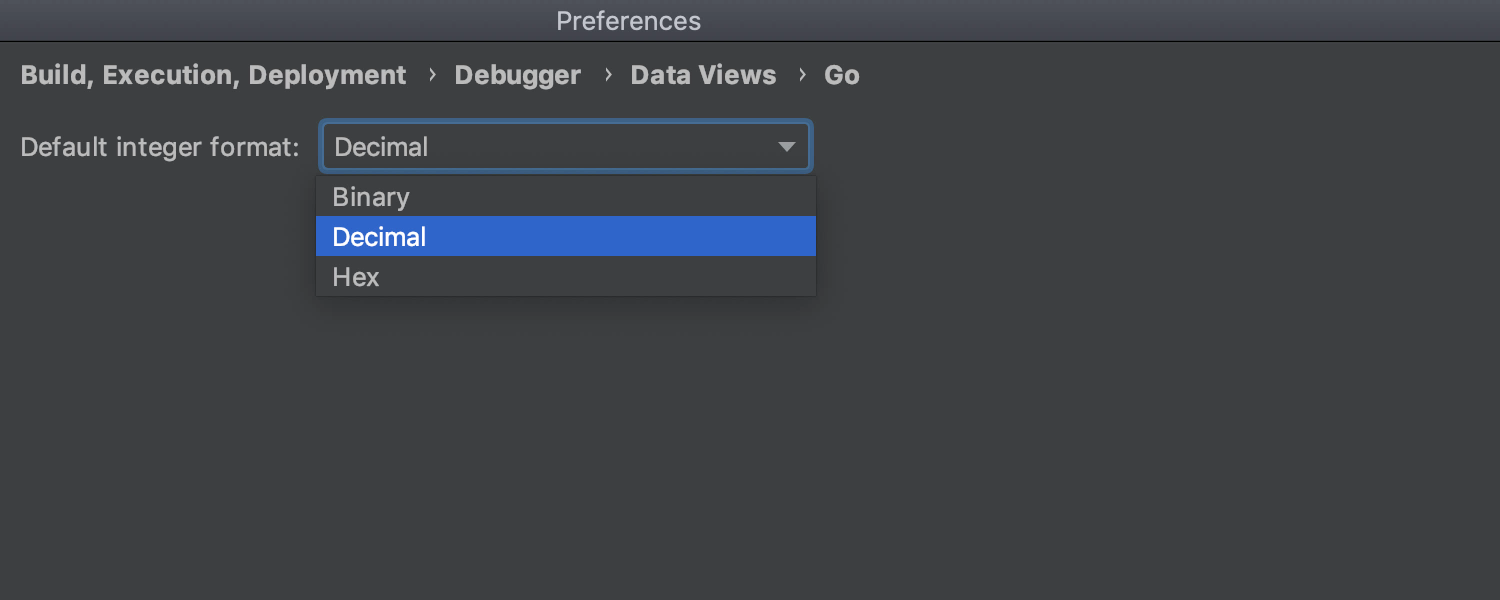
As you have probably noticed from the above screenshot, to enable this feature, you need to go to Settings/Preferences | Build, Execution, Deployment | Debugger | Data Views | Go.
And that’s it for today.
We’ve seen quite a few changes in 2019.2 related to the debugger, and they are all there to boost your productivity and help you quickly understand what’s going on so you can fix the bugs.
As always, please let us know your thoughts in our issue tracker or in the comments section below, or ping us on Twitter. Thanks!
Subscribe to GoLang Blog updates


