Hub
Integration Across Team Collaboration Tools
Multiple, Shareable and Guest Dashboards

Dashboard is the heartbeat of every project and team. You want to come to your Dashboard and get the most important information: progress made, current status, changes, and possible problems and bottlenecks, just from a glance. Like pilots monitoring their dashboard to make sure the flight goes smoothly.
On Hub’s Dashboard, you can place widgets from all the services connected to your Hub: YouTrack widgets (reports, issues), Upsource widgets (code reviews, commits), TeamCity widgets (project status, investigations, build artefacts), and Quick Notes. Also, in Hub 2.0 you can create as many dashboards as you want and share them with the whole team, individual colleagues, or the whole company.
Why do you need multiple and shareable dashboards?
In every team there are lots of different roles: developers, QA testers, managers, designers, support, marketing people, and more. How do you know what’s important to every member of your team? Of course, general metrics are crucial for everyone, but when it comes to specific needs, every role has its own priorities. Hence multiple and shareable dashboards.
You can have your personal dashboard, reflecting what’s important to you or your sub-team. Of course, you are free to share it, as your priorities might be interesting to others in your team. At the same time, you can have a common shared dashboard for the whole team, reflecting the most important project metrics.
Here are some examples of team dashboards for our own YouTrack and Hub teams at JetBrains.
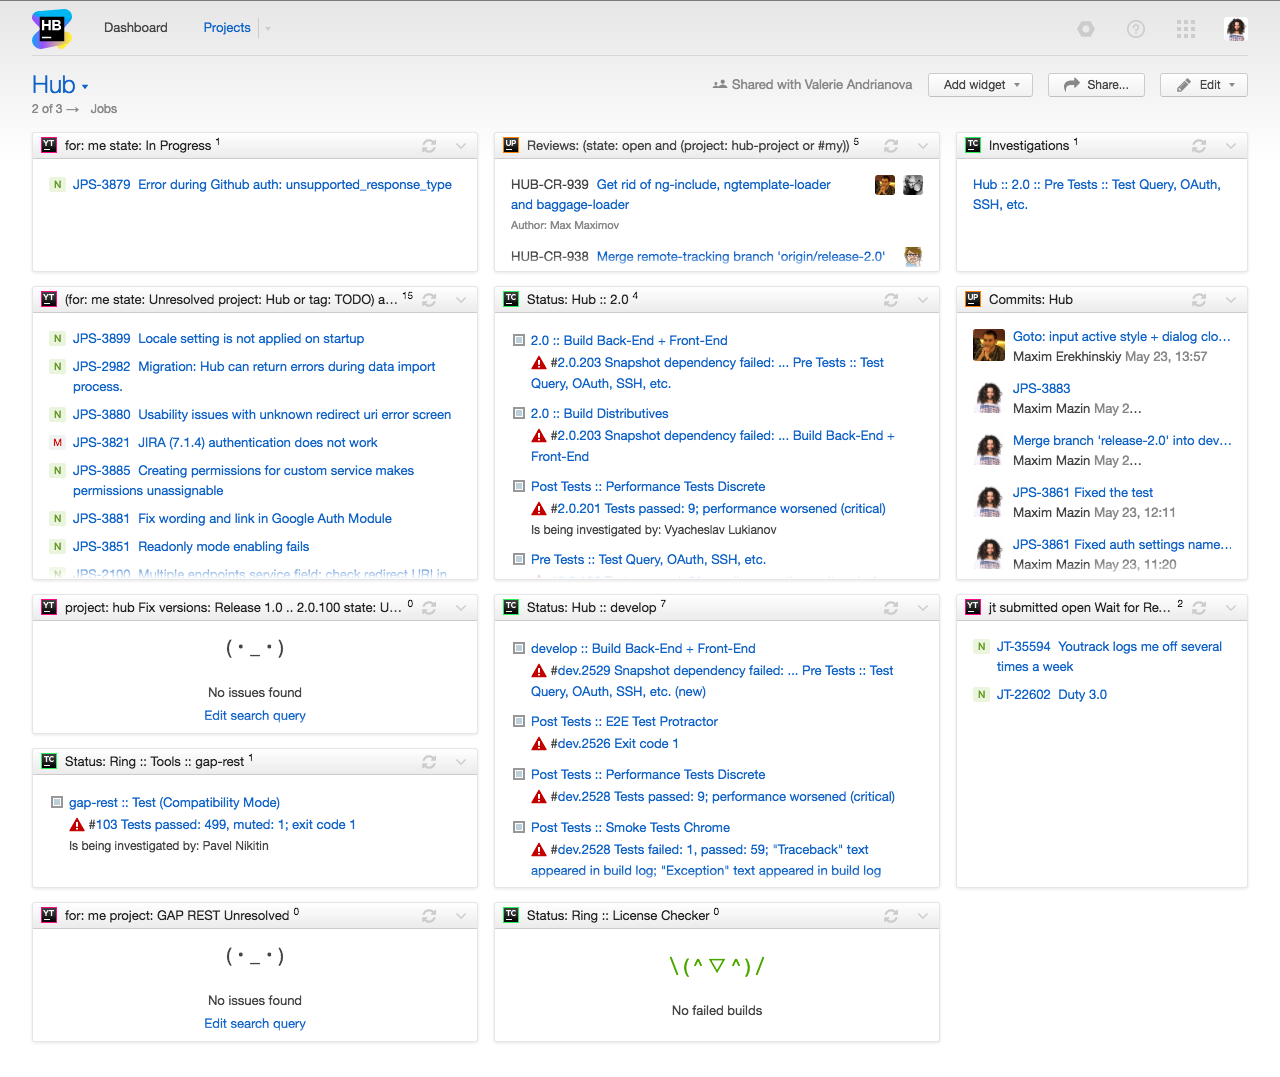
1. Hub Team Lead dashboard
The Hub Team Lead manages the team, combining it with some coding. He keeps an eye on the latest commits made by the team, development brunch builds status, as well as the 2.0 (release branch) builds status, checks the code reviews done by the team. He also watches his unresolved and in-progress tasks, investigations, and critical and show-stopper issues in the released version.
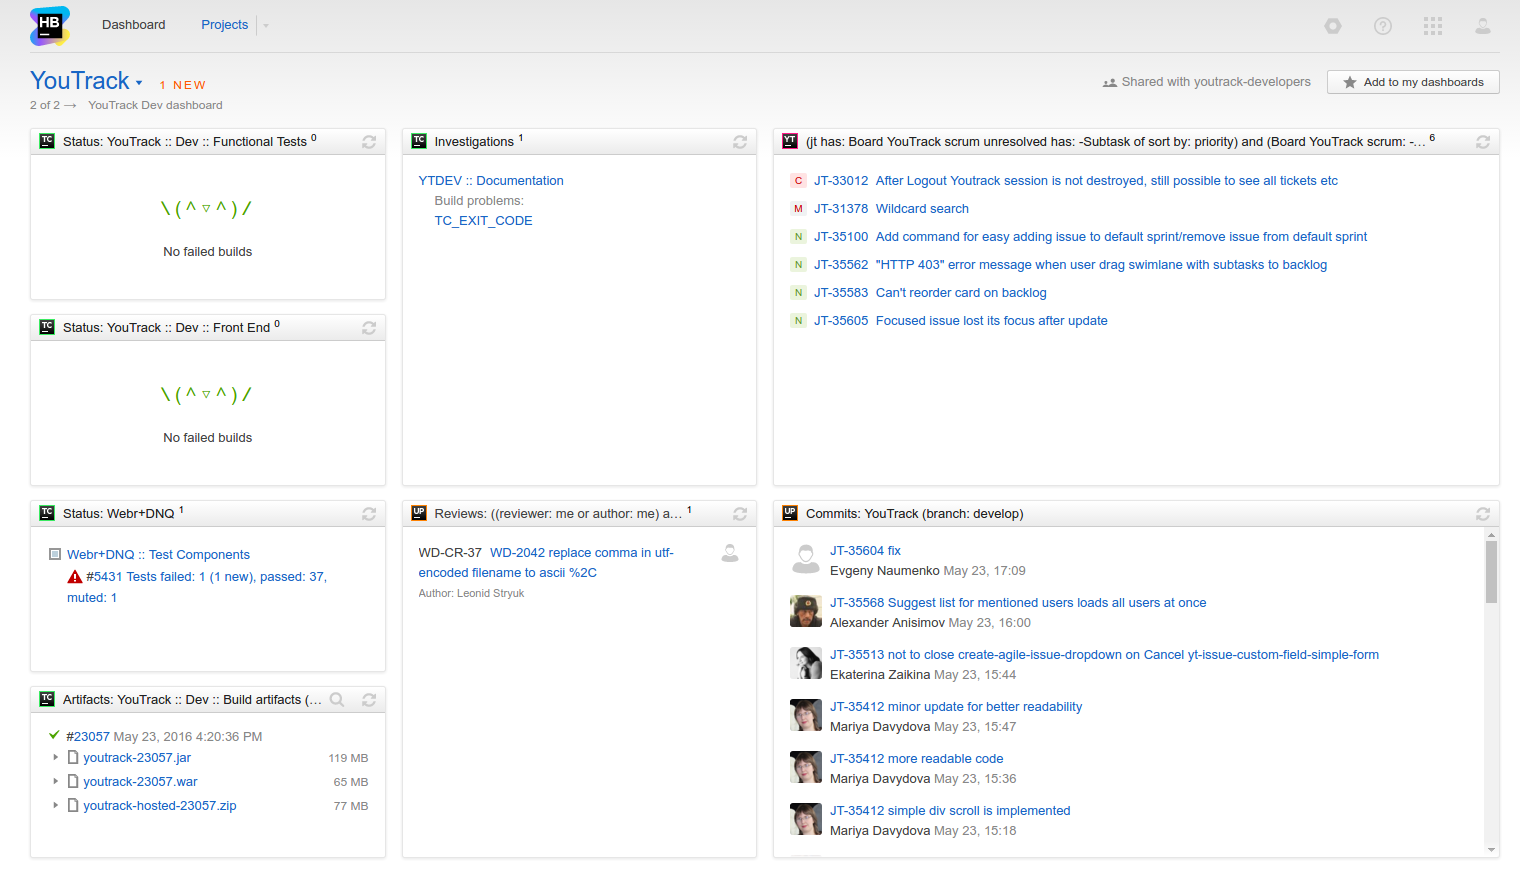
2. YouTrack Development team dashboard
This dashboard is shared across the whole development team. It shows unresolved orphan tasks for the current sprint, all the commits to the development branch, development branch front-end and back-end builds status, investigations and code reviews for each team member, and YouTrack 7.0 build artifacts.
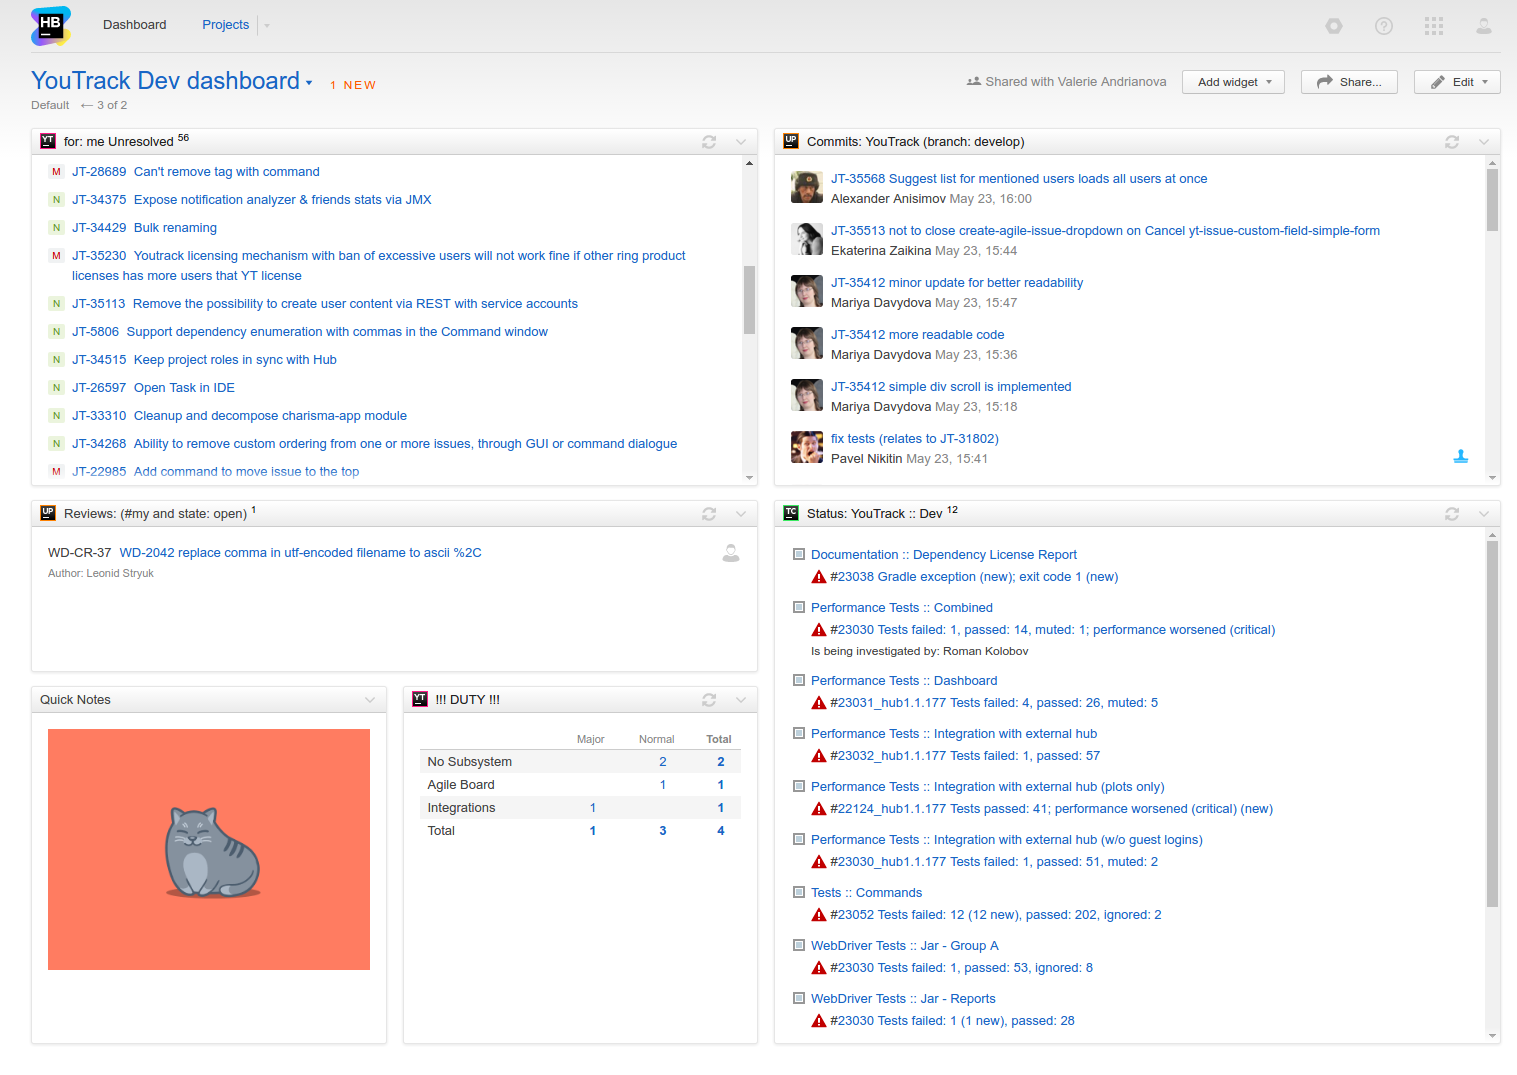
3. YouTrack Developer personal dashboard
This developer is watching the latest commits from the team, code reviews assigned to him, TeamCity tests status, all his unresolved issues, new issues reported by the customers every day, and of course self-motivating quick notes.
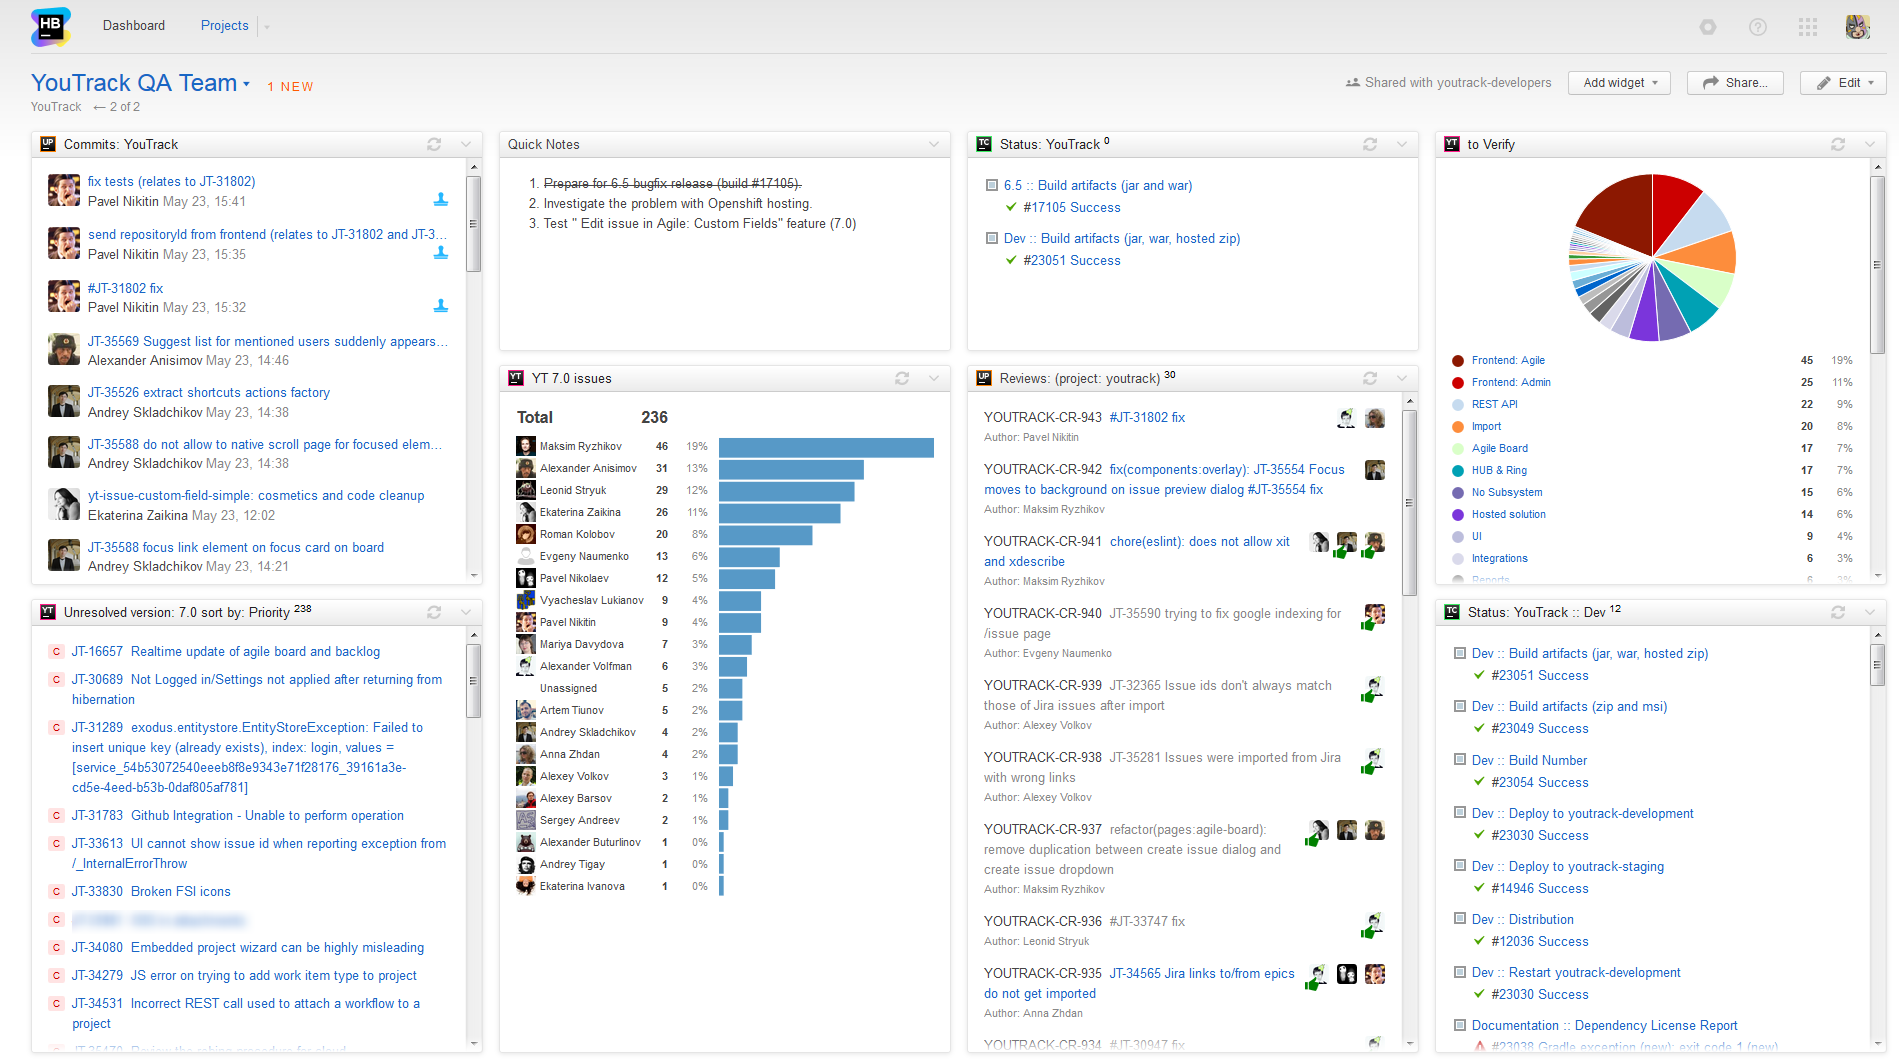
4. YouTrack QA team dashboard
Our QA team is interested in all the latest commits made by the developers, to be ready to test them. QA team also monitors all the issues assigned to the upcoming version, distributed by assignees; and all the issues they need to verify, distributed by subsystems. They also keep an eye on code reviews made by the team, the latest YouTrack builds status, of the current and upcoming versions.
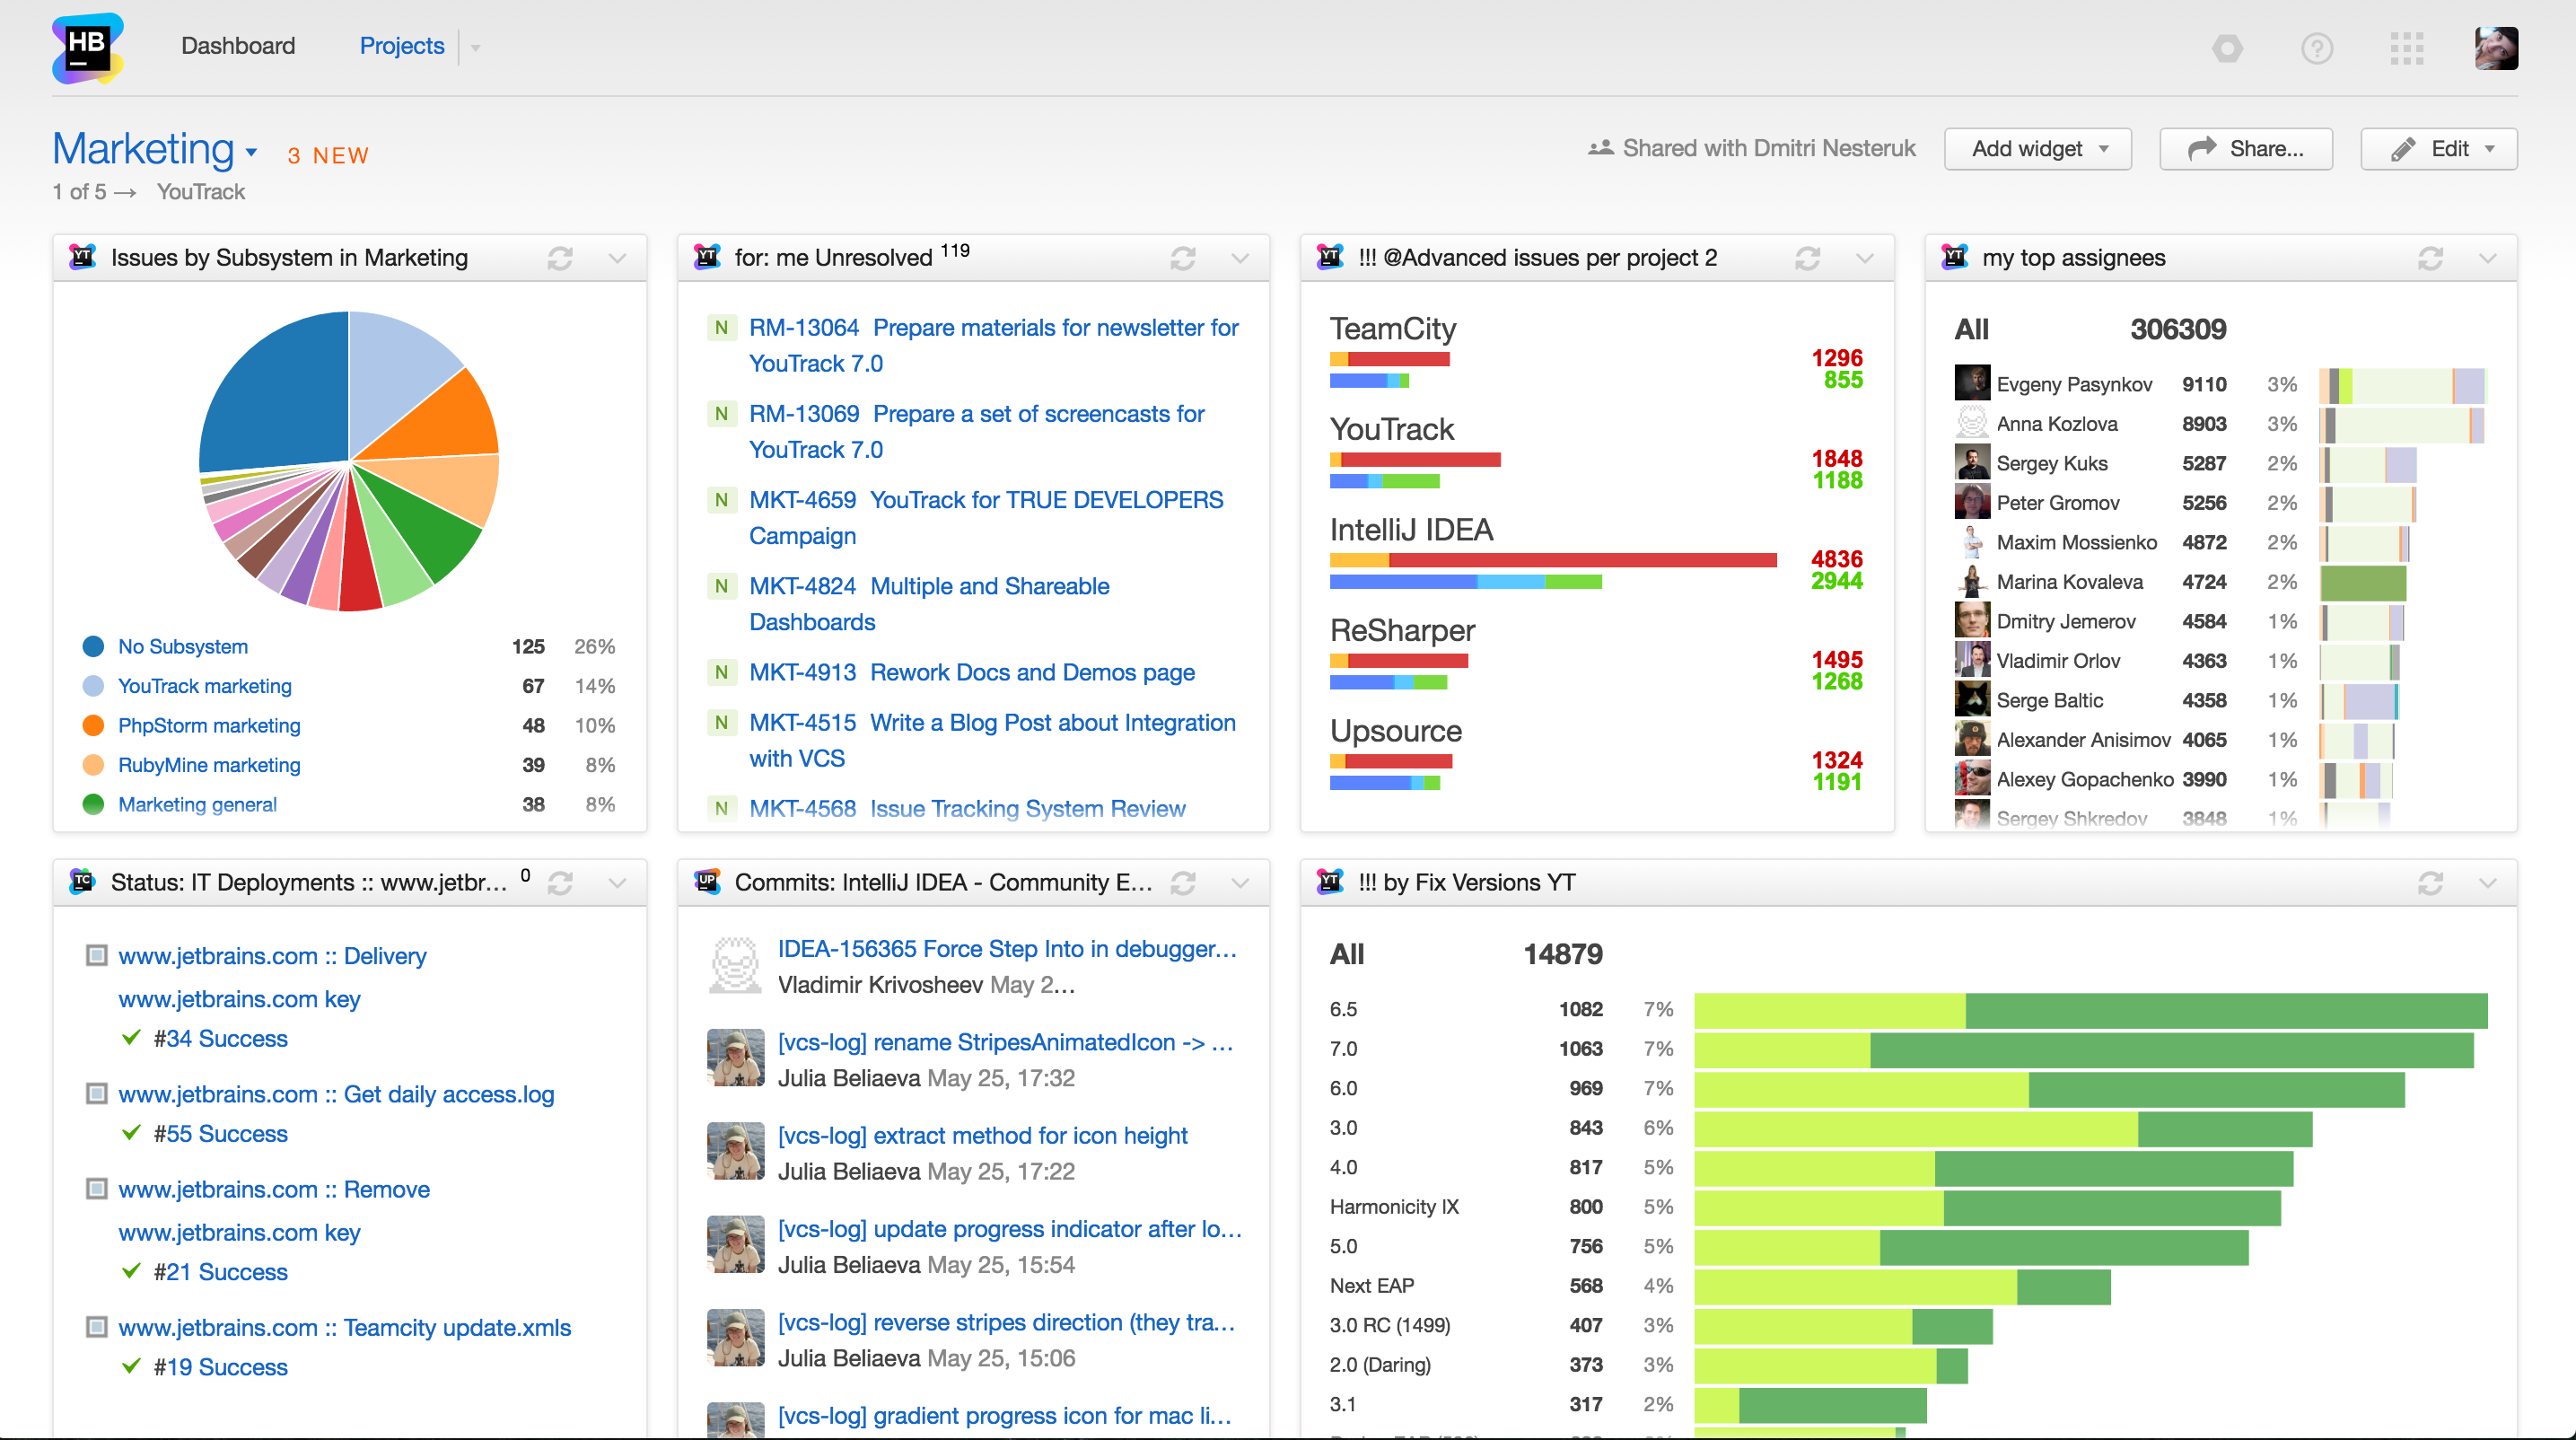
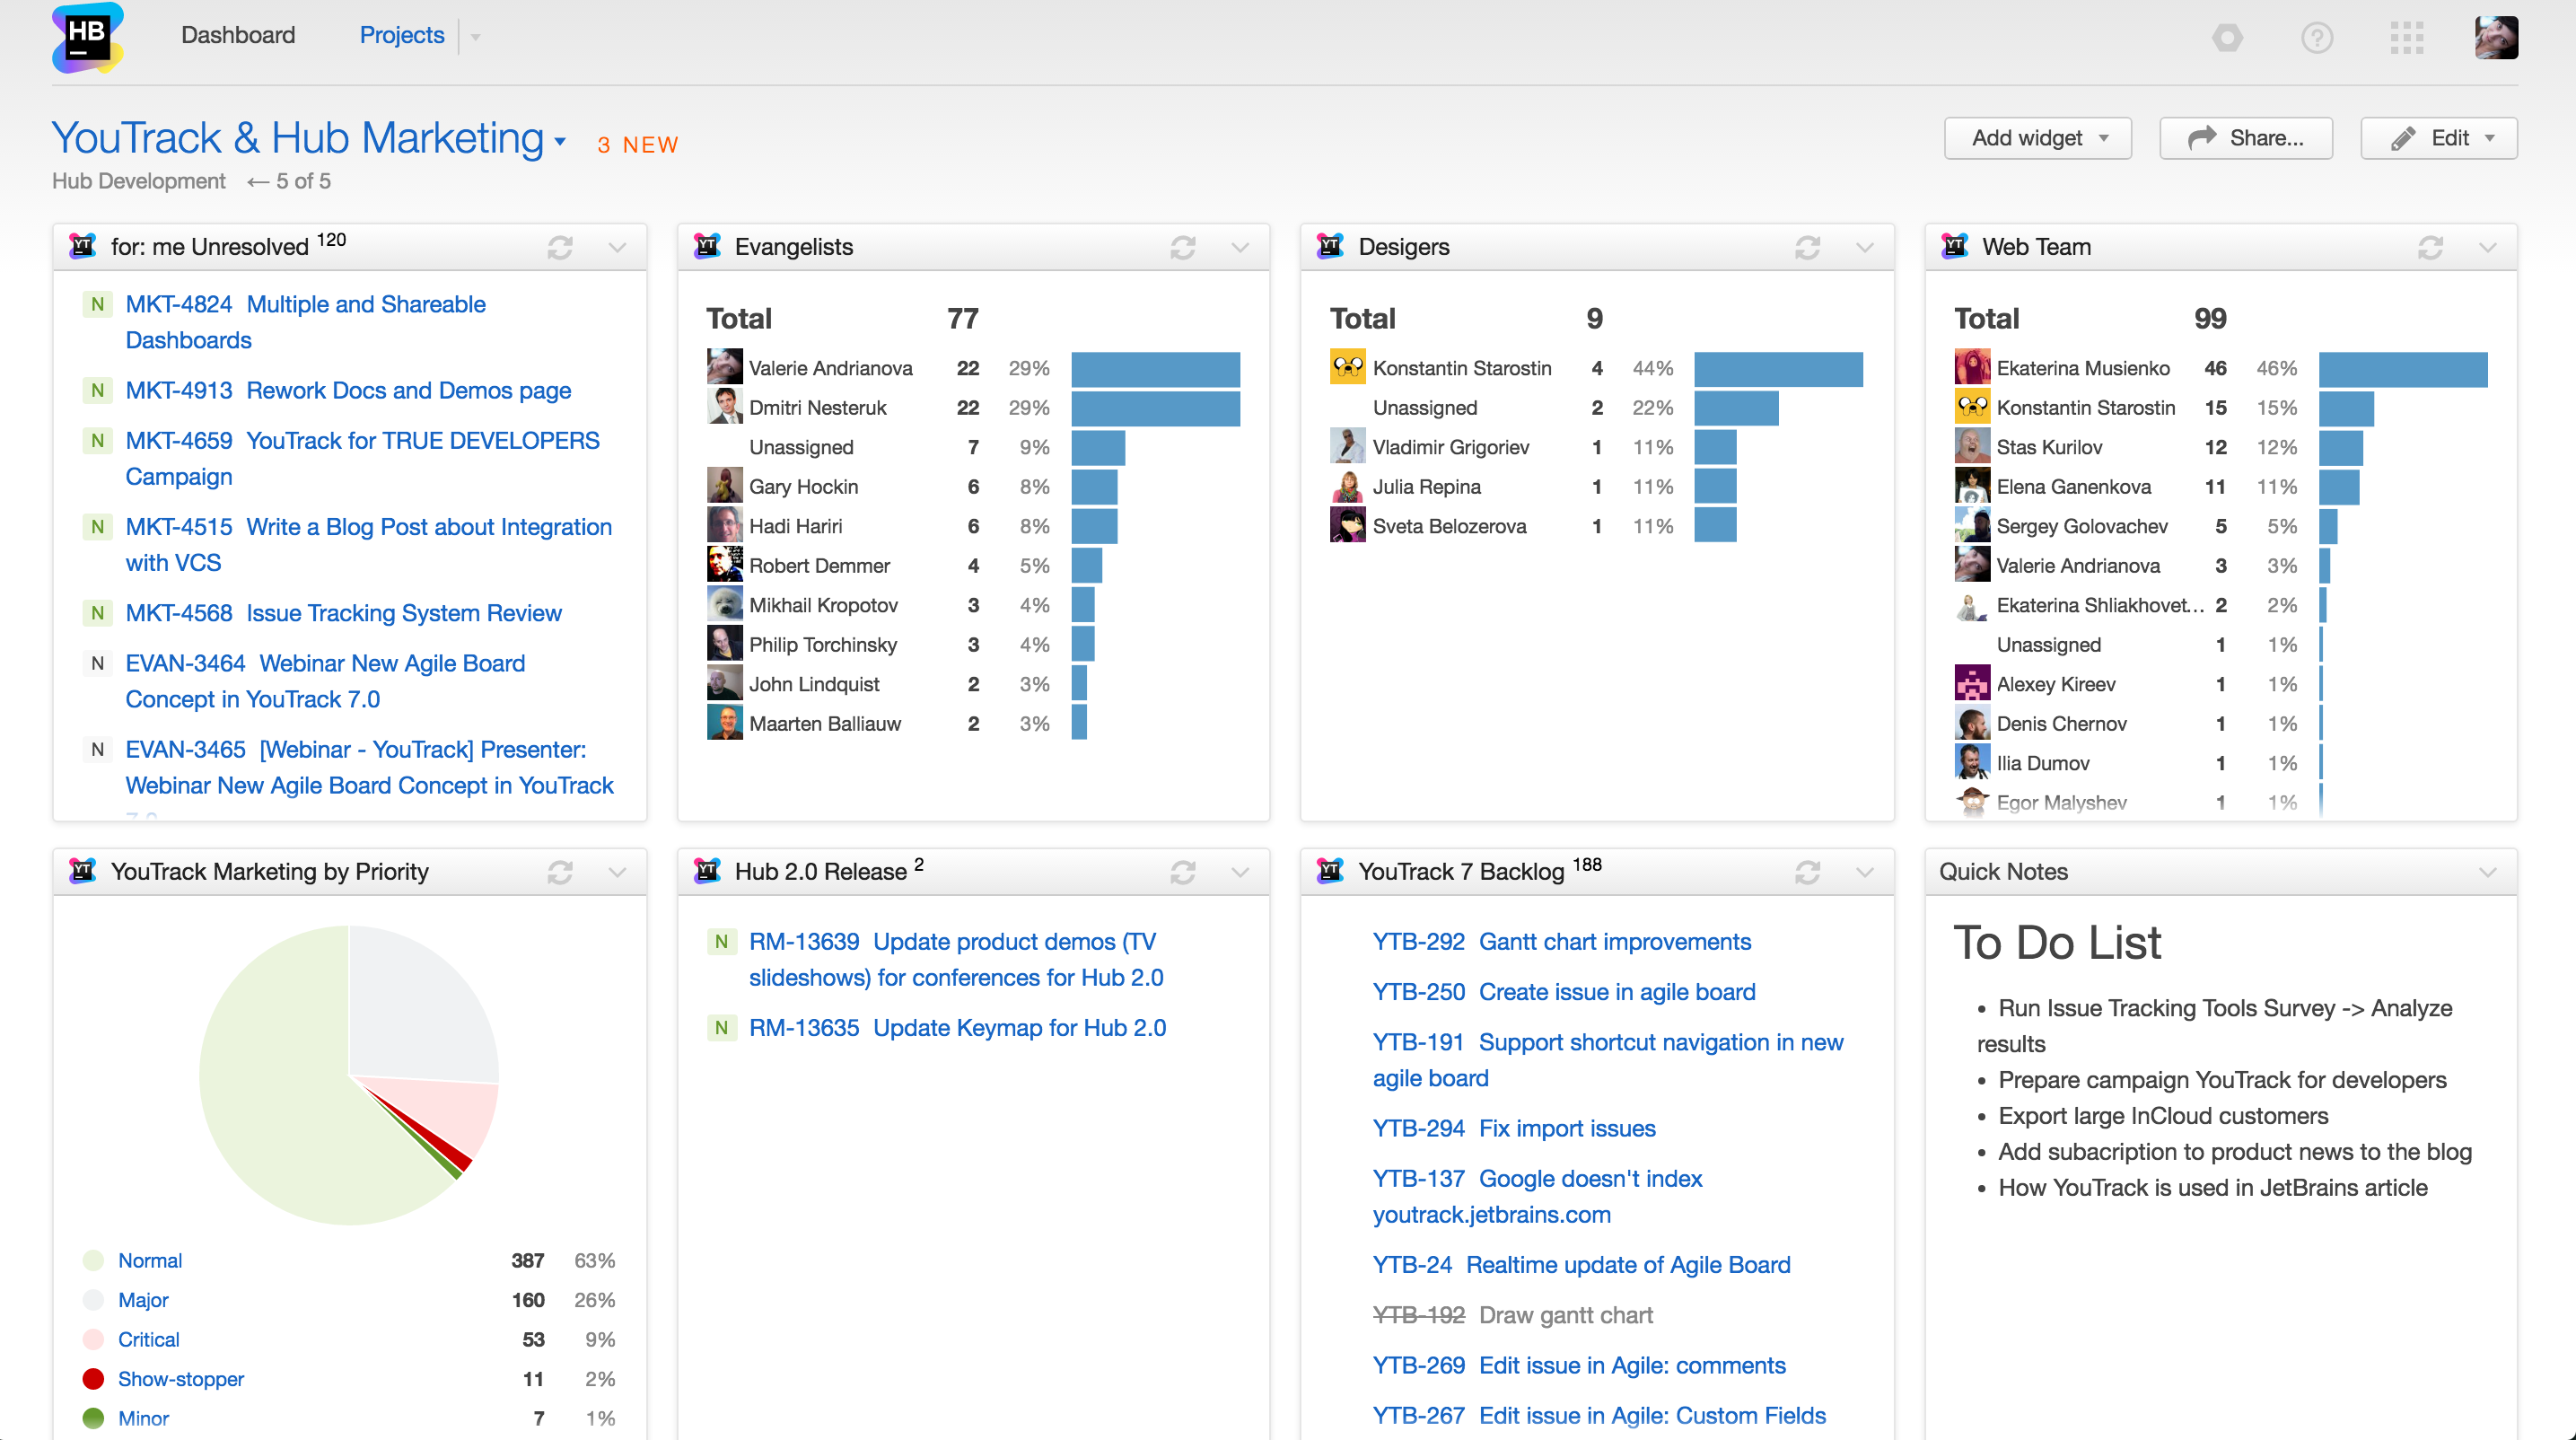
5. YouTrack & Hub Marketing dashboard
This is my personal dashboard. It contains the list of my tasks, and the tasks I’m interested in getting from various Operation teams, like Design, Web, and Evangelism teams. I’m also watching the development Backlog for the upcoming YouTrack version, as well as the release management tasks for Hub and YouTrack. I also keep my to-do list and update it weekly.
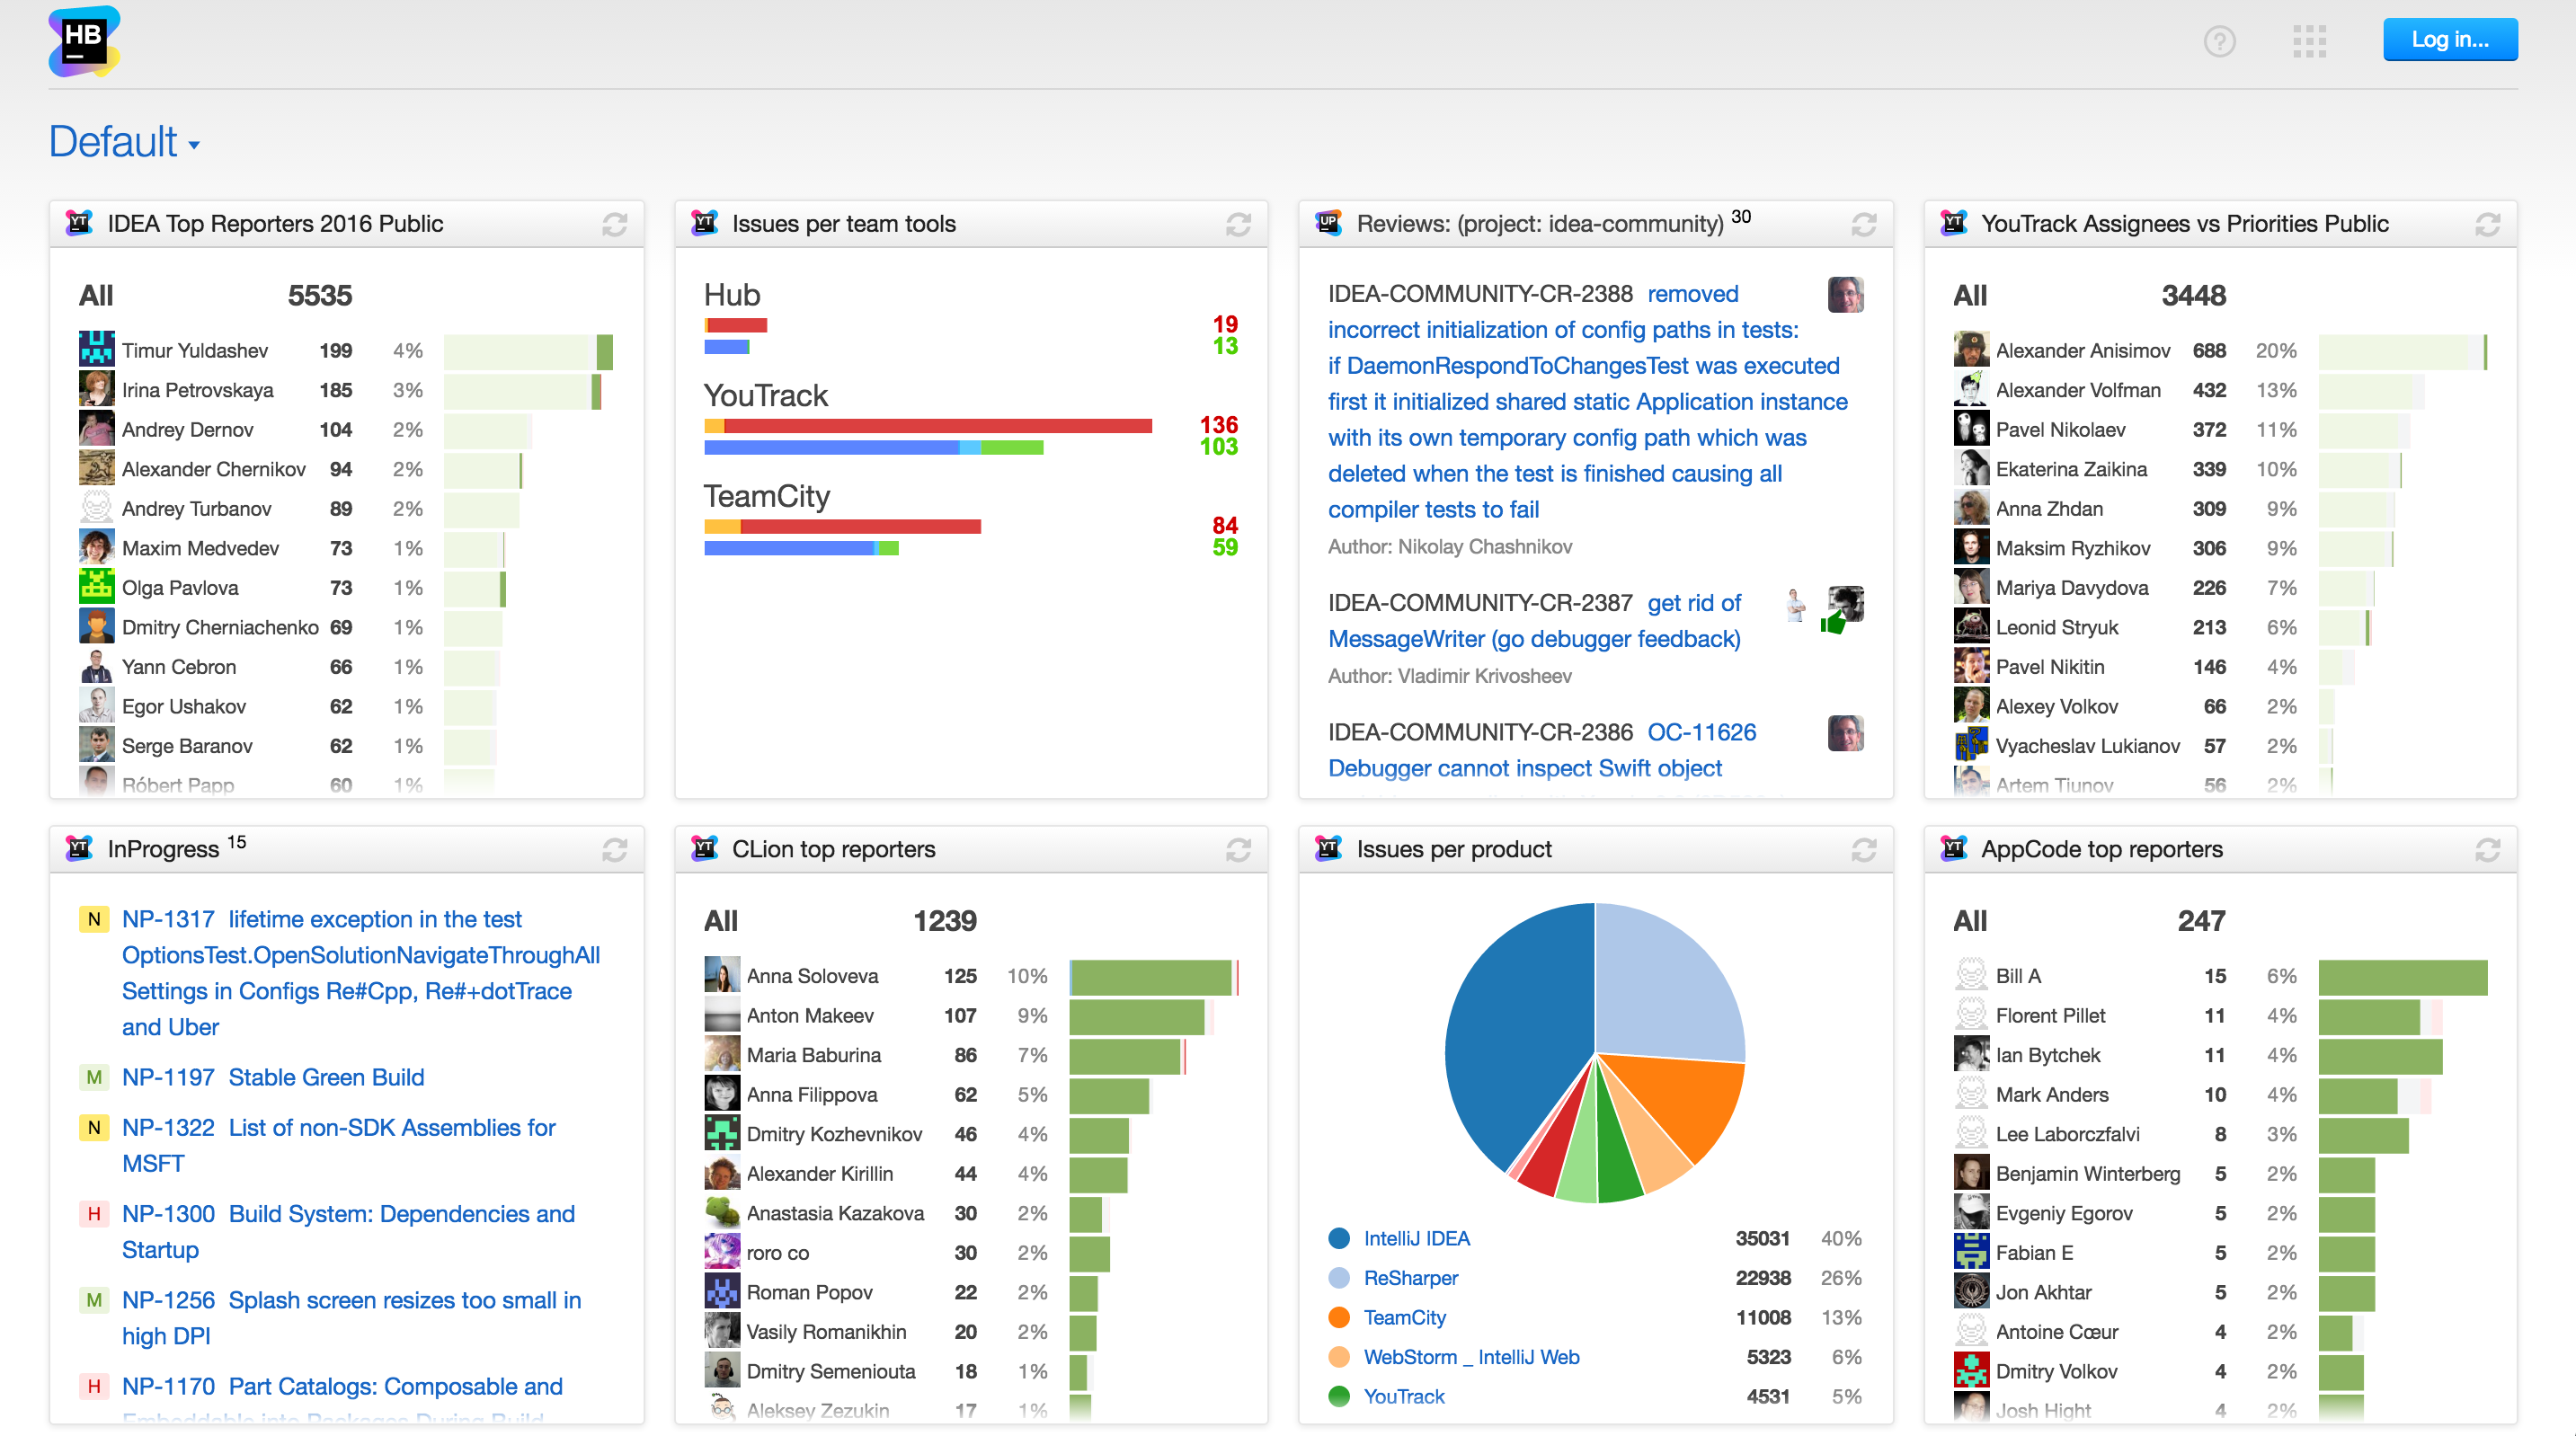
6. Default (Guest) dashboard
Tell newcomers, your customers and external users how your project(s) is doing. It’s very easy, you just need to configure the Guest Dashboard, which will be shown to everyone externally.
As an example, look at this Guest Dashboard configured on the JetBrains production Hub. A guest user can see a list of top issue reporters in IntelliJ IDEA, CLion and AppCode projects, see how issues are distributed in our products, how many new bugs and features are reported in our team tools vs. fixed and verified issues, see the latest code reviews in IntelliJ community project, and more.
Please follow this instructions to configure a Default dashboard.
Dashboard is the fastest way to get the crucial information you need at a glance. With Hub 2.0, there are so many ways to use and share data with your team, the whole company and your customers. Go for it! Download Hub 2.0 free, and connect your JetBrains team tools today.