Debug Decompiled Code with IntelliJ IDEA 14.1
Earlier this week we’ve announced the start of IntelliJ IDEA 14.1 EAP. Among the new features available in the preview build, this one you’re going to especially like: the built-in decompiler (introduced in IntelliJ IDEA 14) now has debugging capabilities.
This means that now you can use breakpoints anywhere in the decompiled code, with almost the same experience that you’d normally have when debugging with actual sources:
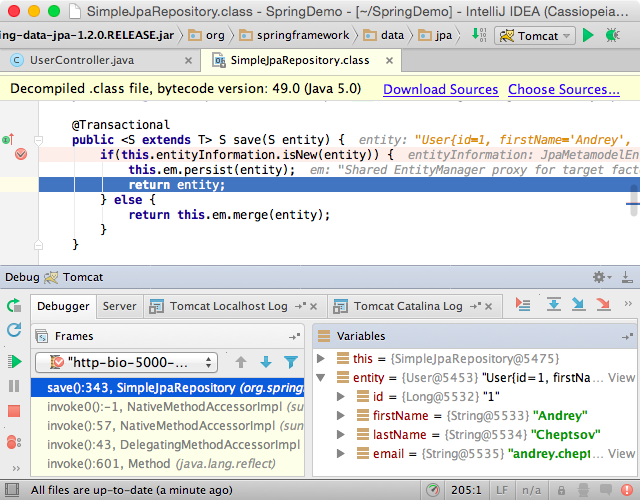
With IntelliJ IDEA 14.1 missing library sources is not a problem anymore, well, provided that it comes with the line number attributes.
Download the EAP build right away and tell us what you think in our discussion forum, or, in case you find a bug, in the issue tracker.
Develop with Pleasure!
erwann says:
February 5, 2015Hi,
Why default spring boot lib is not using the lastest 1.2.1 version? 1.1.9 is quite old
Yann Cébron says:
February 5, 2015Will update, thanks for notifying.
Rafal Magda says:
February 10, 2015Hi,
It would be great if decompiled code lines could be aligned with stacktrace results. It would help using the “Analyze stacktrace” feature.
rakeshd says:
March 30, 2015Why after decompiling the ide stop allowing to edit… even if I modify the settings.. ie., re-establishing file encoding from utf8 to windows 1252 and while also deactivate the decompiler plugin… still it restrict to edit… please help.
najax libaan ladane says:
May 12, 2015Yes this is
JGarrido says:
October 14, 2015Very nice!… now how do I turn it off? I don’t want to debug Spring.
Sanjeev says:
February 1, 2016Is this functionality broken in 15.0.2?
Andrey Cheptsov says:
February 3, 2016It should work in 15.0.2. Doesn’t it work for you? If that the case, could you please file an issue to our tracker? https://youtrack.jetbrains.com/issues/IDEA