JVM Debugger Memory View for IntelliJ IDEA
Every day we try to find new ways to improve developer experience with IntelliJ IDEA. It may be a bugfix, a performance improvement, or a new feature (usually in this order). Today we’d like to introduce a new plugin called JVM Debugger Memory View.
The plugin extends the built-in debugger with capabilities to explore objects in the JVM heap during a debug session. The Memory View shows you the total number of objects in the heap grouped by their class name.
To open the tool window, use the main menu: View → Tool Windows → Memory View.
When you’re stepping over the code, the Diff column shows how the number of objects changes between debugger stops. This way you can easily see how the code you’re stepping over affects the heap.
A double click on a class name, opens a dialog with instances of this class.
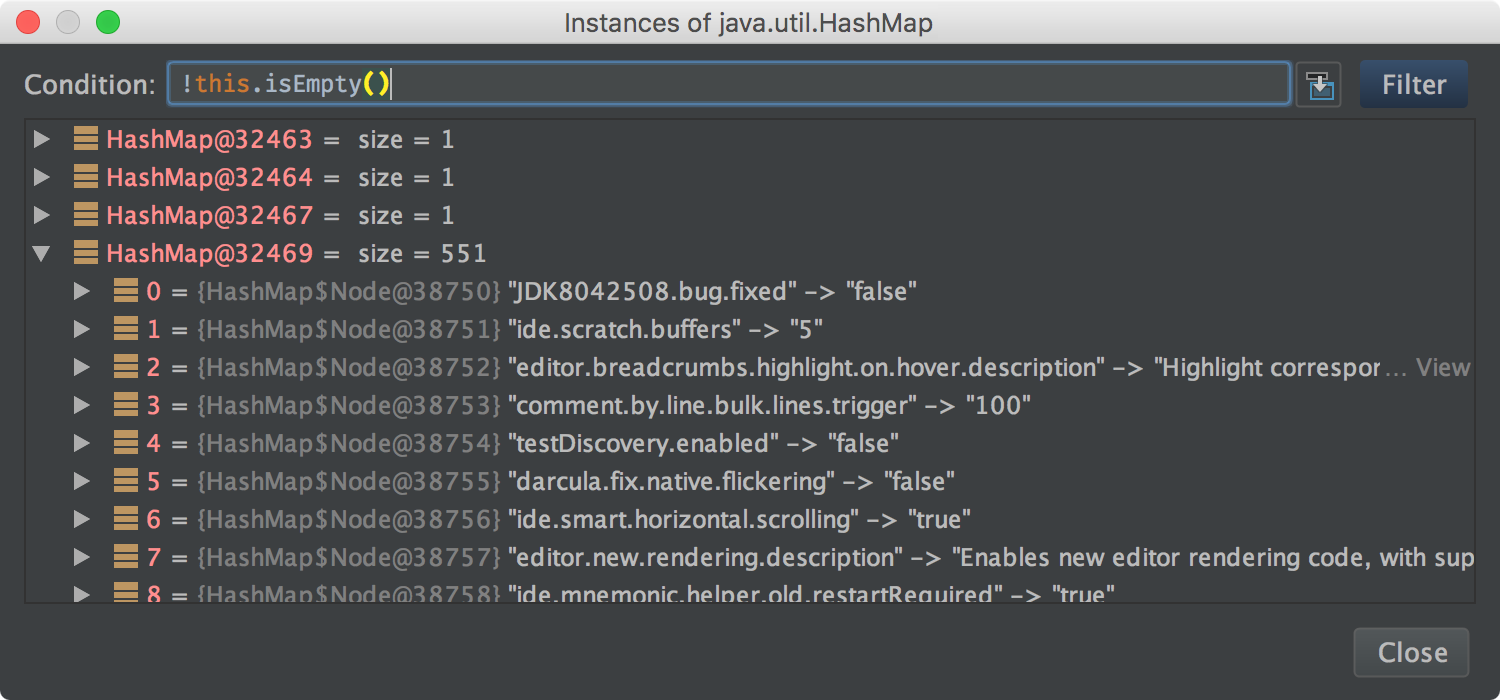
The dialog lets you filter instances by an evaluated expression. All debugger operations such as Inspect, Mark Object, Evaluate Expression, Add to Watches, etc can be applied to instances in this dialog.
To install the plugin, open Settings → Plugins, click Install JetBrains plugin and search for “JVM Debugger Memory View”.
UPDATE: The plugin is now available for IntelliJ IDEA 2016.1 and Android studio 2.2.
Found a bug or miss a feature? Your feedback is very welcome in the issue tracker.
Develop with Pleasure!
A Dev says:
August 19, 2016Please split screen in the Run and Terminal menu, it’ll make debugging client and server easier
http://i.imgur.com/R4J1UfO.png
David Sure says:
August 20, 2016There’s an open issue for this, go vote on it 🙂
https://youtrack.jetbrains.com/issue/IDEA-130374
I’m eager to see this implement myself!
nithin says:
August 19, 2016couldn’t find the plugin, is it not available on community edition?
Vitaliy Bibaev says:
August 19, 2016nithin, The plugin is available for Community Edition, too (starting from 2016.2). You need to install it with “Install JetBrains plugin” action from the plugins settings section.
piercena says:
August 23, 2016I also can’t find it in my “Install JetBrains plugin” section in preferences. I’m on 2016.1.2 if that matters at all.
Vitaliy Bibaev says:
August 24, 2016You need version 2016.2.+ (not 2016.1.2).
Please, install the latest version: https://www.jetbrains.com/idea/download/
Frederic says:
August 19, 2016Is the diff column per thread?!
For example I stop for some break point, is there a way to know allocated object for my current thread only?
Or maybe: do we have a way to filter diff object with a rule?
Vitaliy Bibaev says:
August 19, 2016Frederic, no, the ‘Diff’ column is one per JVM.
Currently, there is no way to see objects allocated from the current thread only.
Thanks for you questions.
Daniel says:
August 19, 2016I must be missing something obvious but I cannot figure out how to open the Memory View window. I installed the plugin. IntelliJ says that it is installed and enabled when I check using the Plugins section of the Settings window. I set a breakpoint in a fairly simple app at a point where there should be at least a few interesting things allocated and launched the app within the IDEA debugger. I’m now at the breakpoint and I simply cannot see _anything_ that lets me launch the Memory View window.
My Mac is is running Mac OS X El Capitan 10.11.6. The “About IntelliJIDEA” window reports
Any idea what’s going wrong or what I’m missing?
IntelliJ IDEA 2016.2.2
Build #IU-162.1628.40, built on August 16, 2016
Licensed to Daniel Boulet
Subscription is active until December 30, 2016
JRE: 1.8.0_76-release-b216 x86_64
JVM: OpenJDK 64-Bit Server VM by JetBrains s.r.o
Alex says:
August 22, 2016I have just the same issue, no Memory view.
http://imgur.com/a/RNfaN
OSX El Capitan 10.11.6
http://imgur.com/a/0k8zz
Ben says:
August 22, 2016I am experiencing the same problem. I have installed the plugin and restarted the computer (just to make sure) and when I hit a stop point I don’t see anything to indicate memory. Everything looks like it used too.
IntelliJ IDEA 2016.2.2
Build #IU-162.1628.40, built on August 16, 2016
Licensed to ##### / Ben #####
You have perpetual fallback license for this version
Subscription is active until November 20, 2016
JRE: 1.8.0_45-b15 amd64
JVM: Java HotSpot(TM) 64-Bit Server VM by Oracle Corporation
john says:
August 23, 2016There is nothing here either. Running Linux Mint 17.3 cinnamon 2.8.8
IntelliJ IDEA 2016.2.2
Build #IU-162.1628.40, built on August 16, 2016
Licensed to xxxxxxxxxxxxxxxxxxx
Subscription is active until February 8, 2017
JRE: 1.8.0_76-release-b216 amd64
JVM: OpenJDK 64-Bit Server VM by JetBrains s.r.o
Vitaliy Bibaev says:
August 24, 2016Discussion of this problem: https://youtrack.jetbrains.com/issue/IDEA-160078
Summary: need to open “Memory view” tool window. (View | Tool Windows | Memory View)
Matt says:
August 22, 2016How come `java.lang.` successfully filters and shows all the objects in java.lang , but once you type `java.lang.S` (if you were trying to show java.lang.String instances, for example) all the results disappear?
Anyways, this is pretty cool.
Vitaliy Bibaev says:
August 24, 2016Will be fixed in the next version, thanks a lot.
Nico says:
August 22, 2016Is there any chance to get this for other platforms too? I’d love to see it for PHP!
Vitaliy Bibaev says:
August 26, 2016We are not having such plans at the moment. Perhaps, it will be done later
popalka says:
August 23, 2016[82552352] WARN – openapi.wm.impl.ToolWindowImpl – ToolWindow icons should be 13×13. Please fix ToolWindow (ID: Memory View) or icon file:/home/ar/.IntelliJIdea2016.2/config/plugins/jvm-memory-view/classes/icons/main.png
Kenny says:
August 23, 2016Very cool, is this coming to Android Studio? I’m running version 2.1.3, and I don’t see it when I perform the search under “Install JetBrains plugin…”
Vitaliy Bibaev says:
August 26, 2016At the moment, plugin is not available for Android Studio.
We are planning to release a beta version (with some restrictions) for AS 2.2
Matt S. says:
August 24, 2016Has the plugin been removed due to all of the errors reported? I cannot seem to find it:
Settings → Plugins, click Install JetBrains plugin and search for “JVM Debugger Memory View”.
Vitaliy Bibaev says:
August 25, 2016No, plugin is available. This comment may useful for you https://blog.jetbrains.com/idea/2016/08/jvm-debugger-memory-view-for-intellij-idea/#comment-383643
Chris Britton says:
December 7, 2016Is there any way to show the shallow and deep (retained) heap usage for each instance?
Thanks.
Vitaliy Bibaev says:
January 10, 2017No.
Evaluation of the retained size for all instances works dramatically slow through the debugger API. Shallow size without retained is not very useful, therefore the plugin does not provide this feature
Venkat says:
December 29, 2016In the memory view window I could see nothing. My application is running in debug mode
Vitaliy Bibaev says:
January 10, 2017Memory view shows classes only when the debugger is paused (at breakpoint, for example).
If memory view tool window still empty, please report a bug: https://youtrack.jetbrains.com/issues?q=project:%20%7BIntelliJ%20IDEA%7D%20Subsystem:%20%7BDebugger.%20Memory%20View%7D%20%23Unresolved%20
Forrest Barnes says:
January 5, 2017Can other extensions for the built in jvm debugger be developed by non-jetbrains developers?
Vitaliy Bibaev says:
January 10, 2017Yes, everybody can make a plugin which reuses the code of the JVM debugger
Mohsen Mirhoseini Argi says:
January 16, 2017This plugin is awesome and I write an article about using it with Android Studio:
https://medium.com/@m_mirhoseini/a-useful-memory-debugger-plugin-for-android-studio-2d9d95bddc24#.2oi3cv5hw
Scott S says:
May 3, 2017Would be great to see the actual size of the collections/objects in the Memory View.
Andrey Cheptsov says:
May 3, 2017Might not be very easy to do. Submitted to our issue tracker: https://youtrack.jetbrains.com/issue/IDEA-172317
Alexandr says:
June 8, 2017couldn’t find the plugin, is it not available on 2017.1.2?
Andrey Cheptsov says:
June 12, 2017It has been bundled with IntelliJ IDEA since 2017.1.
Victor says:
June 15, 2017Andrey, is it bundled with IntelliJ Idea community edition?
It does not appear under “File->Tool Windows” for me.
Andrey Cheptsov says:
June 16, 2017I believe it’s now a part of the Debugger tool window. Please check.
Russell Gonsalves says:
September 29, 2017I’m on 2017.2.4. I did something to cause a standalone (undocked) Memory View window to pop up each time I debug an application. It’s not listed in my Tool windows. You say it’s now “a part of the Debugger tool window”. However, I don’t see it mentioned in the doc at https://www.jetbrains.com/help/idea/debug-tool-window.html. I want to get rid of the window (not have it pop up each time I debug) but can’t seem to find where it’s configured to pop up. Ideas?
Vitaliy Bibaev says:
November 2, 2017You need to attach this undocked Memory view window anywhere in the “Debug” tool window or just use the “Restore Default Layout” action.
Peter Roth says:
July 18, 2017Is there any way to use this tool to analyze a heap dump taken from another JVM instance that the debugger is not currently connected to? E.g. load a heap dump from a file?
Vitaliy Bibaev says:
November 2, 2017No, this is impossible at the moment.
Carlos says:
October 20, 2017Is this available in the latest community edition?
This is my version and I cannot find it.
IntelliJ IDEA 2017.2.5
Build #IC-172.4343.14, built on September 26, 2017
JRE: 1.8.0_152-release-915-b12 amd64
JVM: OpenJDK 64-Bit Server VM by JetBrains s.r.o
Linux 4.4.87-25-default
kozaka says:
October 30, 2017Idk! We could not find it either!
Vitaliy Bibaev says:
November 2, 2017Carlos, Yes, this is available. The view was integrated with the “Debug” tool window since 2017.1. See this screenshot to find it https://plugins.jetbrains.com/files/8537/screenshot_16824.png.
Andreas Wederbrand says:
February 15, 2018Can this tool, or is there another tool that can, open saved heap dumps?
wang says:
March 14, 2018The new IDEA integrates the memory view, but it will stop the memory activity. If the debugging starts the h2 in-memory database, the debugger will not be able to access the h2 database when it reaches the breakpoint.
wang says:
March 14, 2018I would like to know if IDEA can develop plug-in that can view database schema Erm
Android Studio插件整理 | wyBlog says:
June 12, 2018[…] 63.JVM Debugger Memory View […]
Brian Thorstad says:
June 15, 2018Using IntelliJ 2018.1, I cannot find this plugin. Is it still available?
Serge G says:
October 4, 2018Same Problem
Victor says:
October 6, 2018Same here. Quite a useful plugin I might add.
Running MacOS 10.13.6
Alex Dvoretsky says:
January 9, 2019Same problem IntelliJ 2018.3
Sinh says:
July 9, 2019Same problem with IntelliJ 2019.1. I can see Memory tab but there are nothing in this panel
Ofir Bar says:
December 18, 2019Same problem, on Android Studio 3.5.1