IntelliJ IDEA
IntelliJ IDEA – the Leading IDE for Professional Development in Java and Kotlin
What’s New in IntelliJ IDEA 2017.3 EAP?

Last week we announced the opening of the EAP for IntelliJ IDEA 2017.3, the upcoming IDE update which will be released this fall. In the announcement we briefly mentioned some of the major changes the update will deliver. Let’s talk about them in a bit more detail.
Java
First of all, we continue enhancing our data flow analysis for Java code.
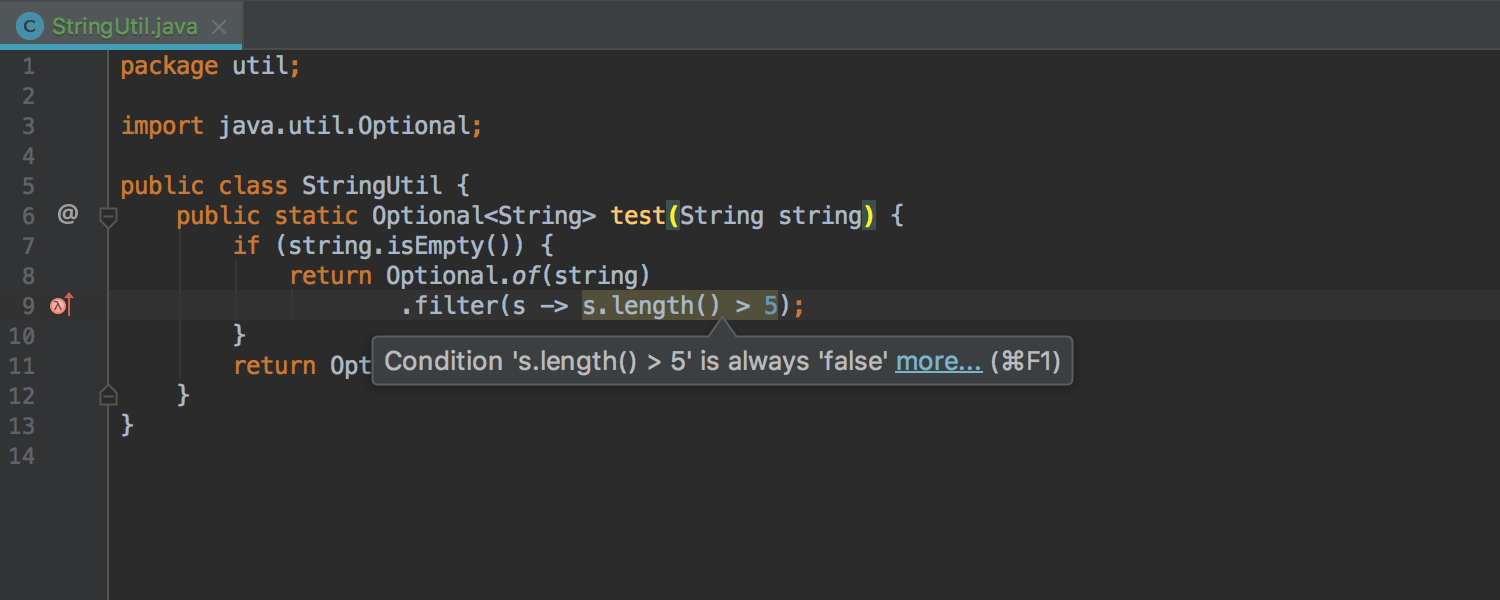
IntelliJ IDEA 2017.3 now detects possible nullability issues even in Stream API call chains:
The quick-fixes that help migrate plain for loops to Stream API have been extended to cover a few more sophisticated but quite common cases.
Usages of StringBuilder can now be replaced with Stream.collect and Collectors.joining:
Code that iterates to find a maximum or a minimum can now be automatically replaced with Stream.max and Stream.min:
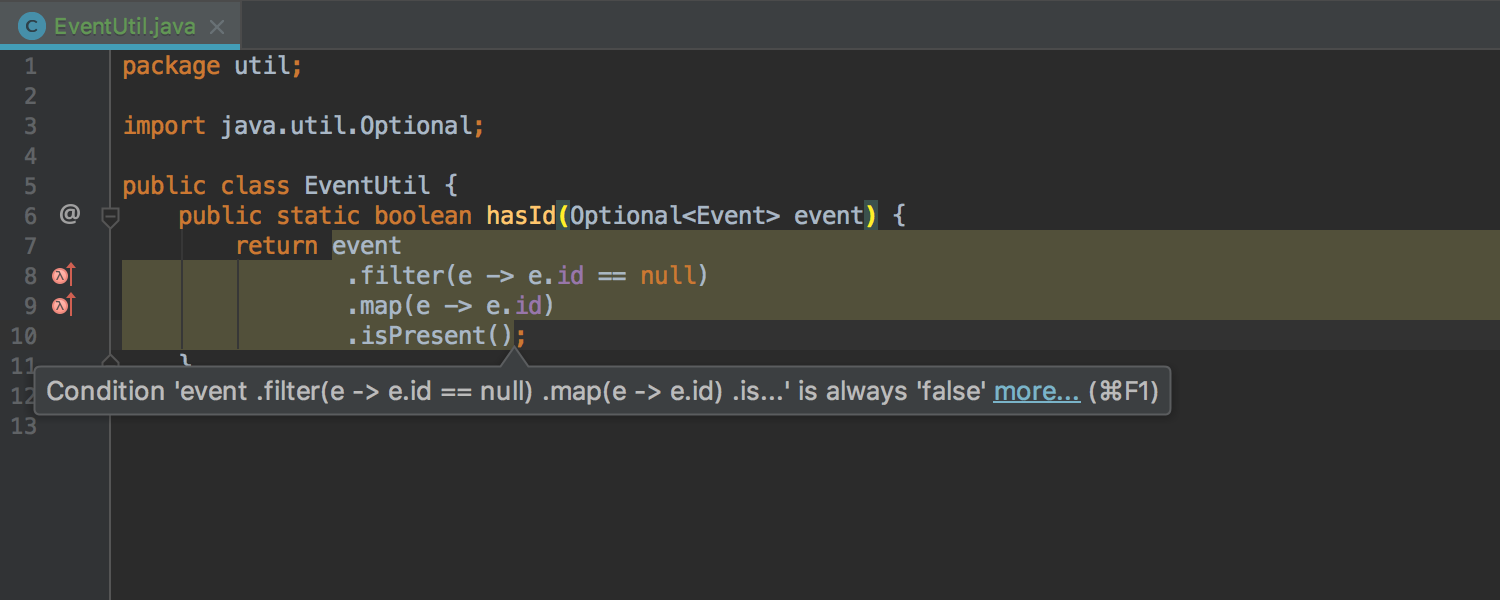
The data flow analysis for the Optional type has also become smarter:
Now, it reports even non-obvious issues:
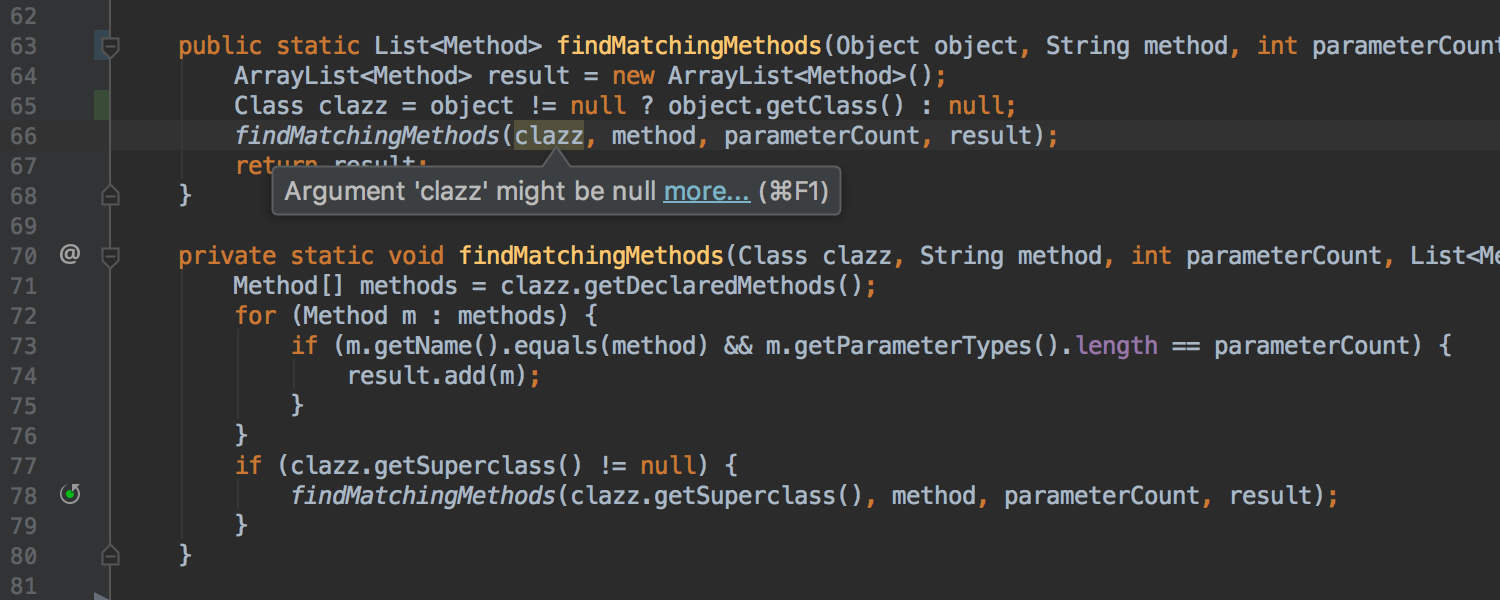
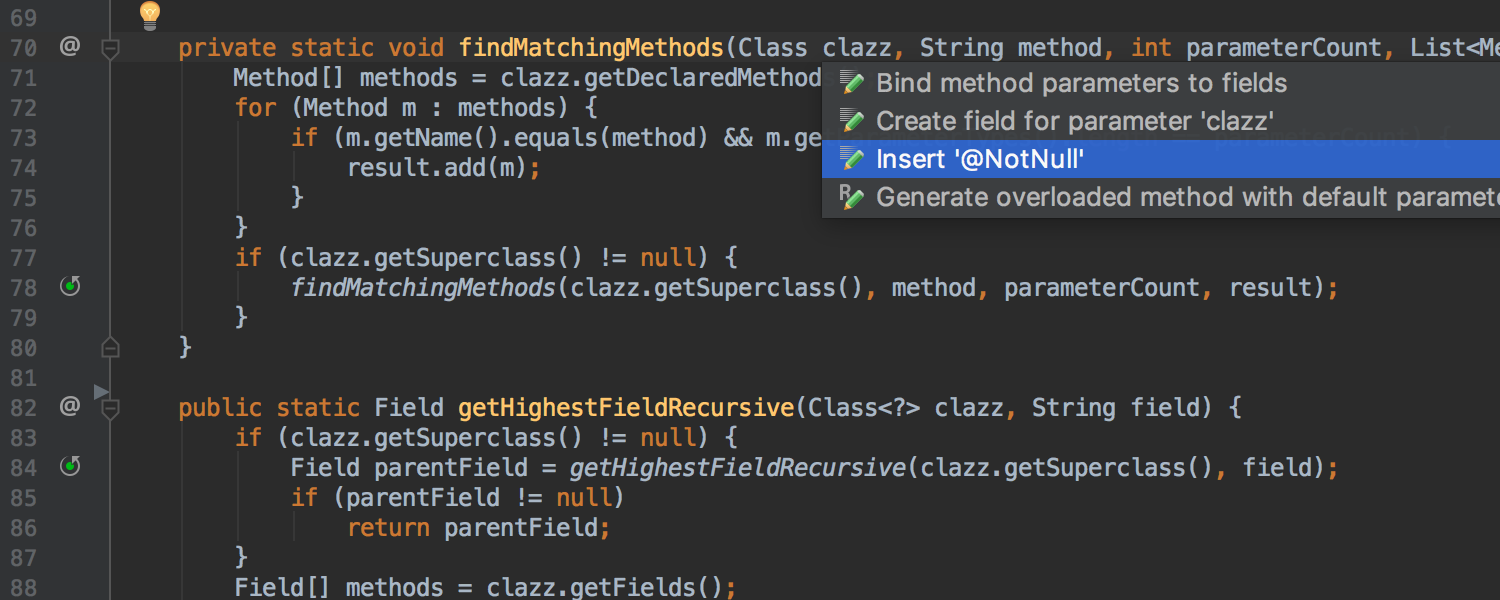
We’ve improved the way nullability annotations are inferred. Earlier annotations were inferred only for library methods’ parameters and for any methods’ return types. Now it also infers nullability annotations for parameters of sealed and private methods:
The IDE shows the inferred annotations in Parameter Info and Quick Doc popups. When the caret is at such a parameter, the IDE offers a quick-fix to explicitly declare the inferred annotation:
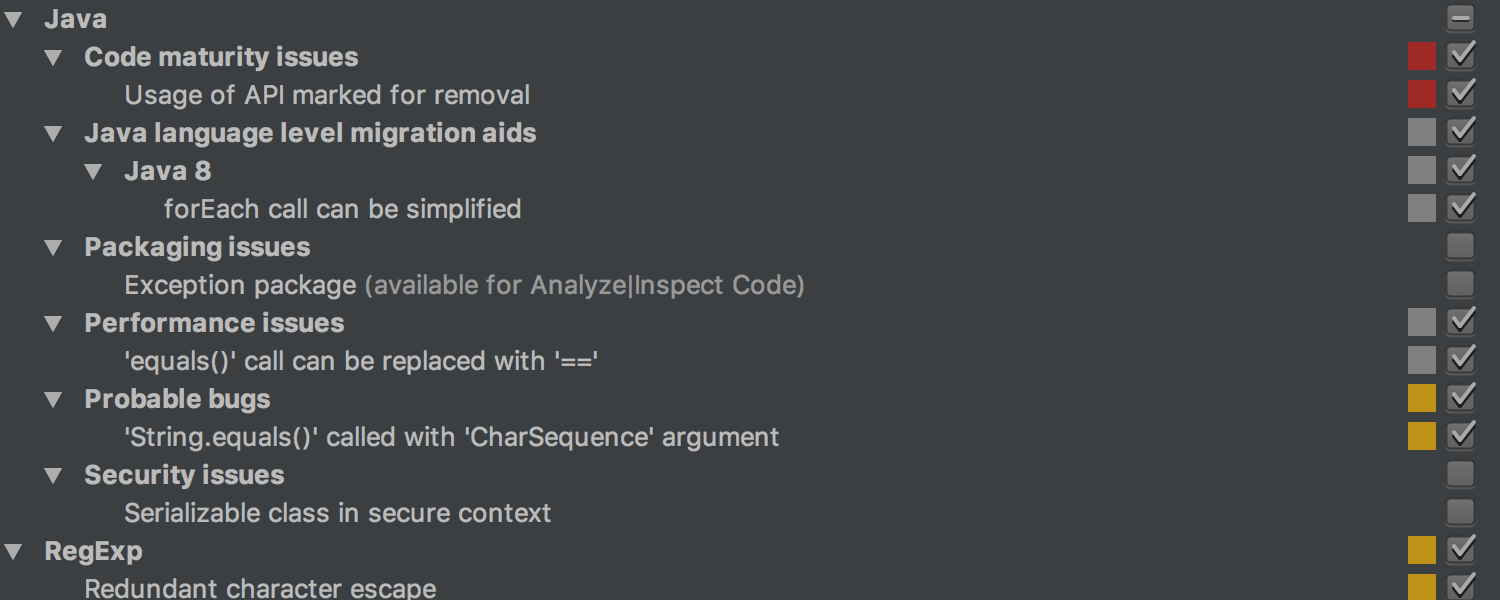
Finally, there are many brand new inspections, which you can easily see in Settings by typing “2017.3” in the Search field:
JVM debugger
Just like data flow analysis, the Debugger is another area we’ve constantly been enhancing in recent releases, and IntelliJ IDEA 2017.3 is no exception.
First, the Debugger tool window adds a new Overhead tab:
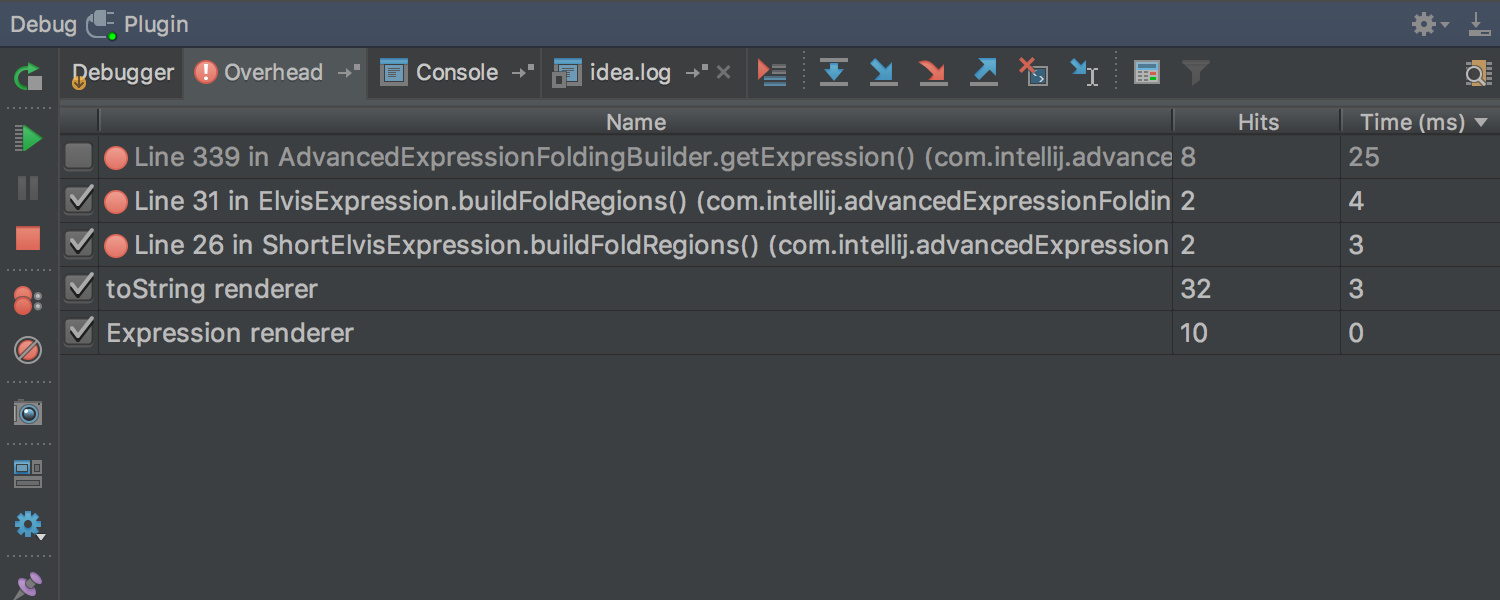
As its name suggests, this tab shows you the overhead added either when stepping over the code or when Data Renderers evaluates values to display them in Variables, Watches, or other places.
When not needed, the tab can be easily hidden and restored later.
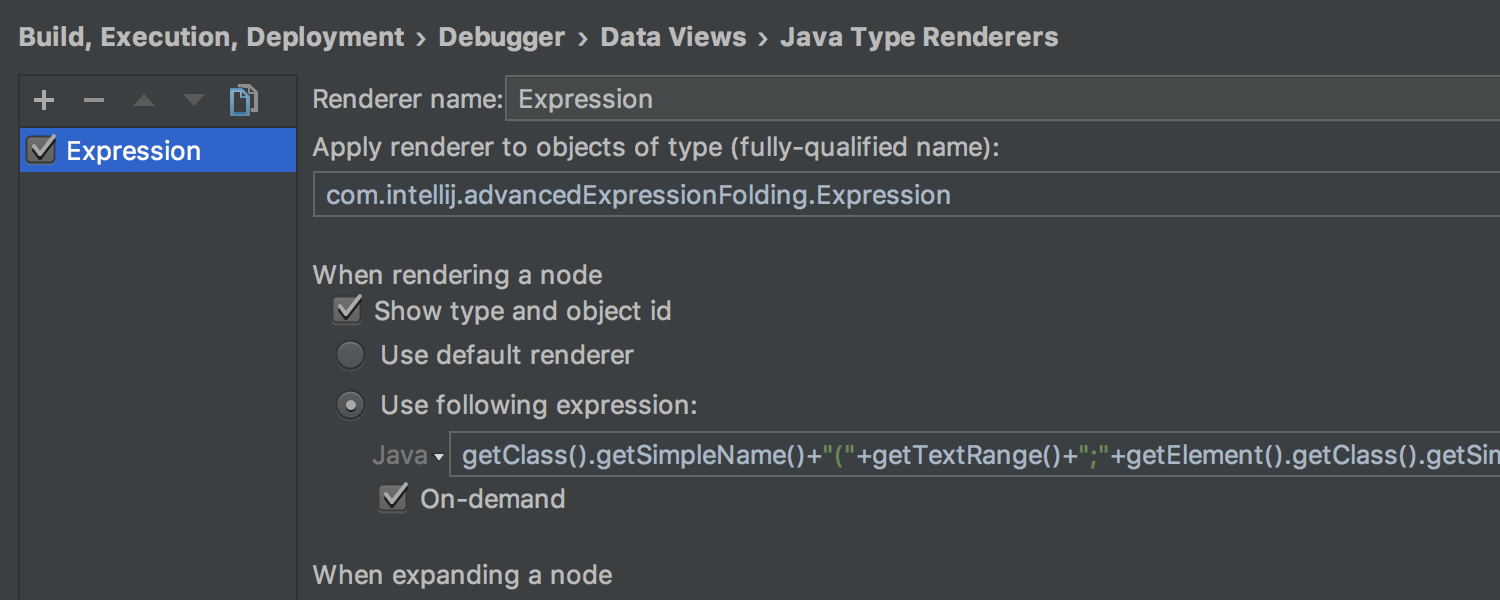
Speaking of possible overhead, the Debugger now lets you reduce it – by using the On-demand Data Renderers. Now evaluation of values in Variables, Watches, or other places can be done on click when needed, rather than automatically.
This new feature can be enabled in the Data Renderers settings for each renderer:
Then, in Variables, Watches, and other places, simply click the renderer’s expression placeholder to see the value:
Any renderer can be “muted” from the context menu: this will enable the On-demand setting for the selected renderer:
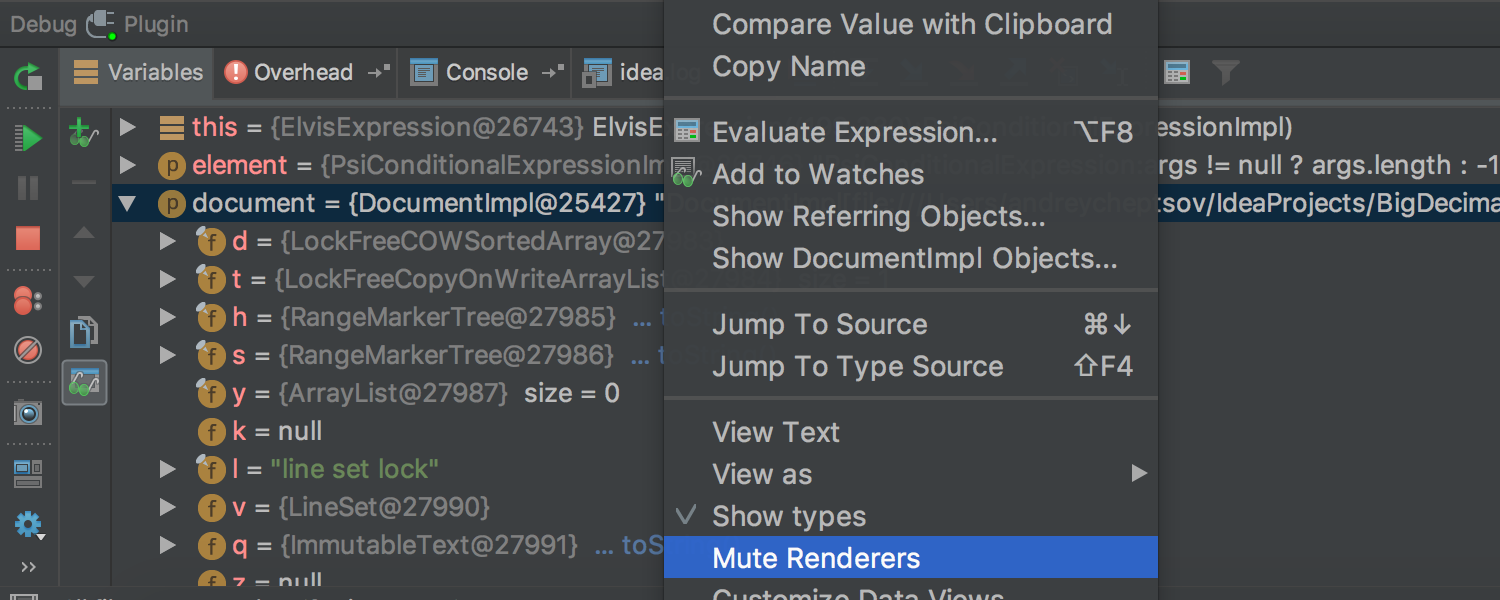
Same functionality is automatically enabled for any object if you disable the default toString renderer.
Spring
Support for Spring and Spring Boot is also getting better with each update. First of all, we’ve introduced initial support for auto-configured MVC web applications, already available in the EAP.
Another thing related to Spring, and project configuration in particular, is auto-detection of Spring facet and context. We hope this will make your life much easier, since facet configuration is always a painful process required to have Spring-dedicated coding assistance.
Git
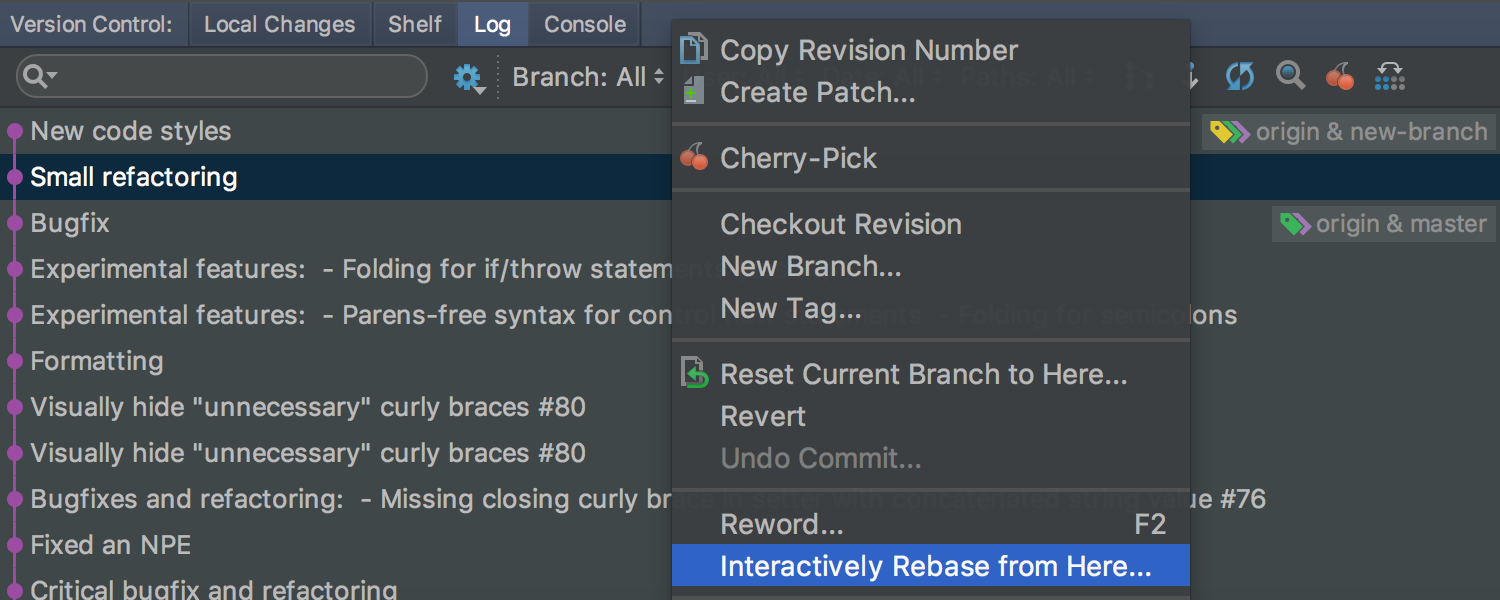
In Git integration, we’ve sped up branch operations (especially for large projects) and added slight UX improvements, such as the Interactively Rebase from Here action in the Log viewer. In addition, Compact References View and Show Tag Names settings are now project-level instead of global.
Tools
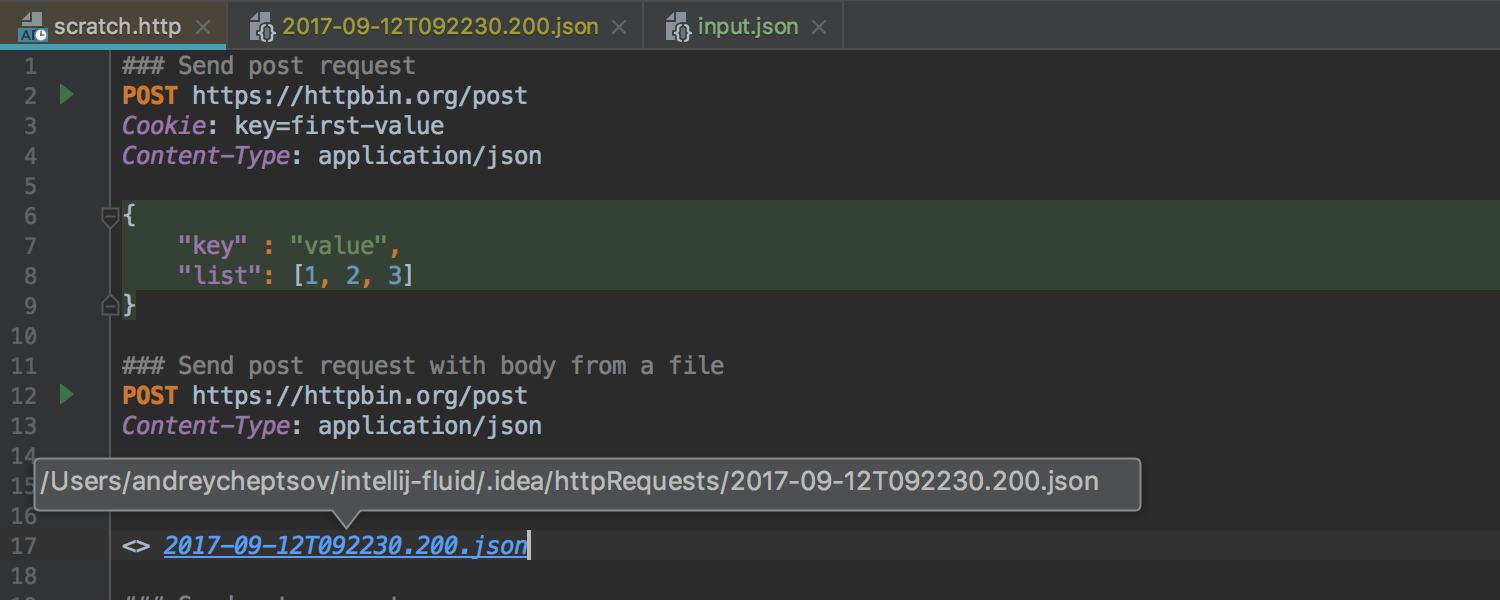
The biggest highlight here is the brand new editor-based REST client. This new client reuses the approach from VS Code and Emacs for testing HTTP requests:
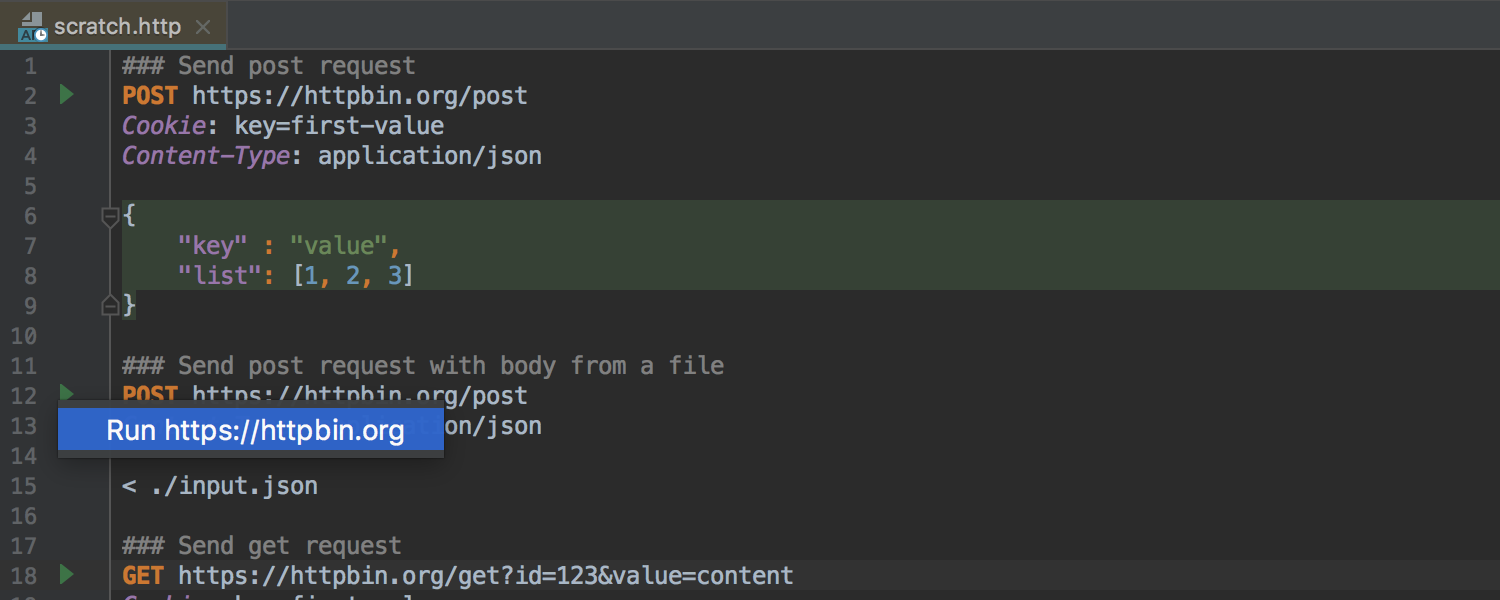
To use the new client, simply open a new Scratch File and select ‘HTTP Requests’ as its type. This will create a scratch file with the “.http” extension. The file format is basically a mixture of HTTP RFC and custom injections, similar to what VS Code uses.
To run a request, use the icon on the left-hand panel of the editor:
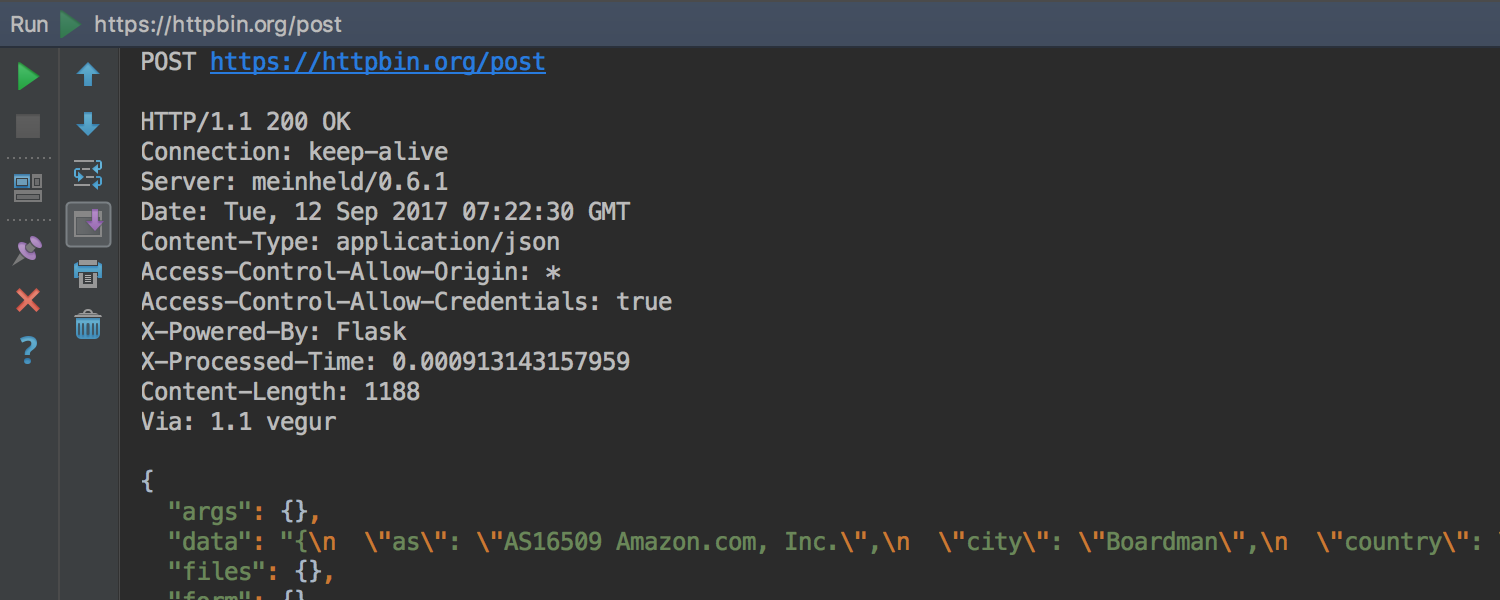
Once the IDE has run a request, it will embed a link with the results to the file for easier navigation:
In other news, the Docker plugin now supports alternative names for docker-compose.yml files.
JavaScript
Support for Vue.js has gotten a lot better with the update, adding automatic closing of curly braces, and coding assistance for props (including props as arrays) and data properties/methods.
The Change Signature refactoring now also works better for ES6 methods: the IDE correctly updates all usages of the method across the project.
The Extract Parameter refactoring now uses the ES6 parameter syntax. Speaking of ES6, when possible, import statements are now added automatically when code is pasted from the clipboard.
The TypeScript support additions include the Extract Type Alias refactoring and
Convert type to interface intention. Also, the TypeScript compiler can now be used by the IDE to report problems in JavaScript (this requires you to set allowJs to true in tsconfig.json).
Finally, code styles are now imported automatically from ESLint and TSLint when a project is opened.
Miscellaneous
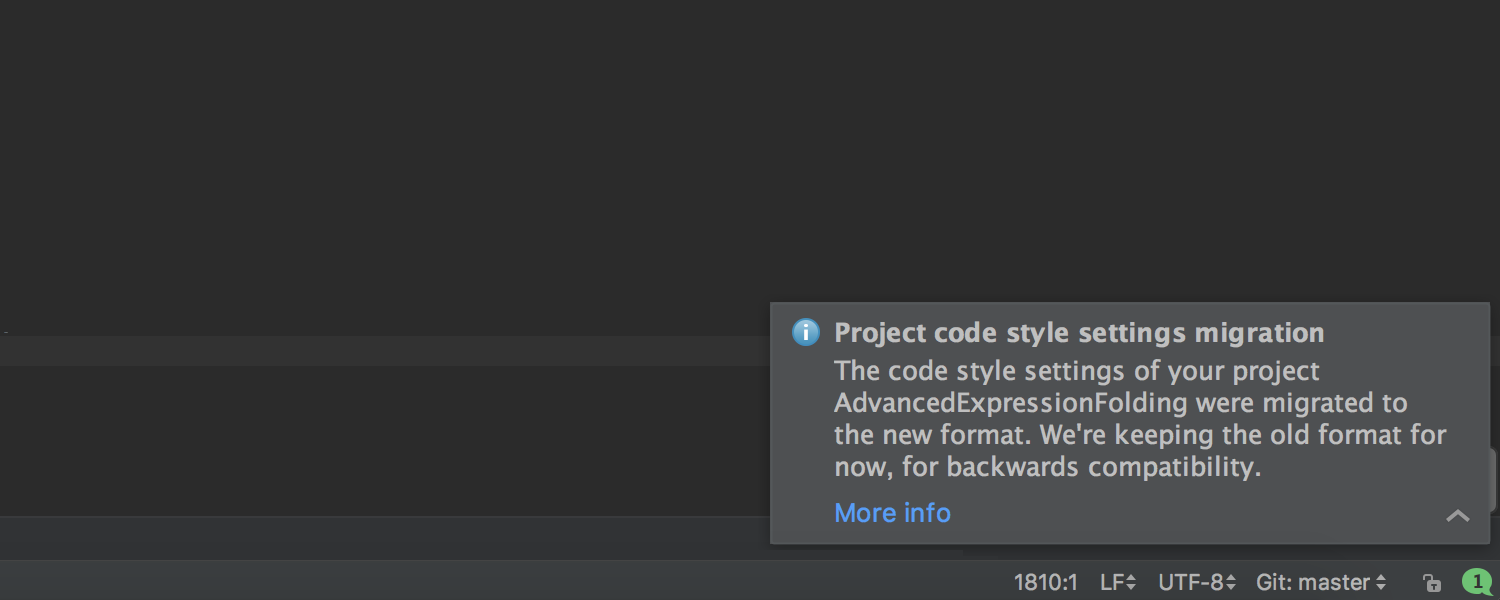
One more notable change in this update is the new code style settings format. Now all code style settings are located under “<PROJECT_ROOT>.idea/codeStyle” directory. The ultimate intention is to support multiple project code styles linked to different scopes. The new format is also cleaner and contains all code style settings properly grouped by language.
The old “.idea/codeStyleSettings.xml” is imported to two new files: “.idea/codeStyles/codeStyleConfig.xml” containing a link to preferred project code style, and “.idea/codeStyles/Project.xml” with code style settings for different languages. The latter is optional and created only if there are non-default settings. If the “.idea” directory is under version control, both files can be added to VCS too. The old codeStyleSettings.xml is kept for backwards compatibility.
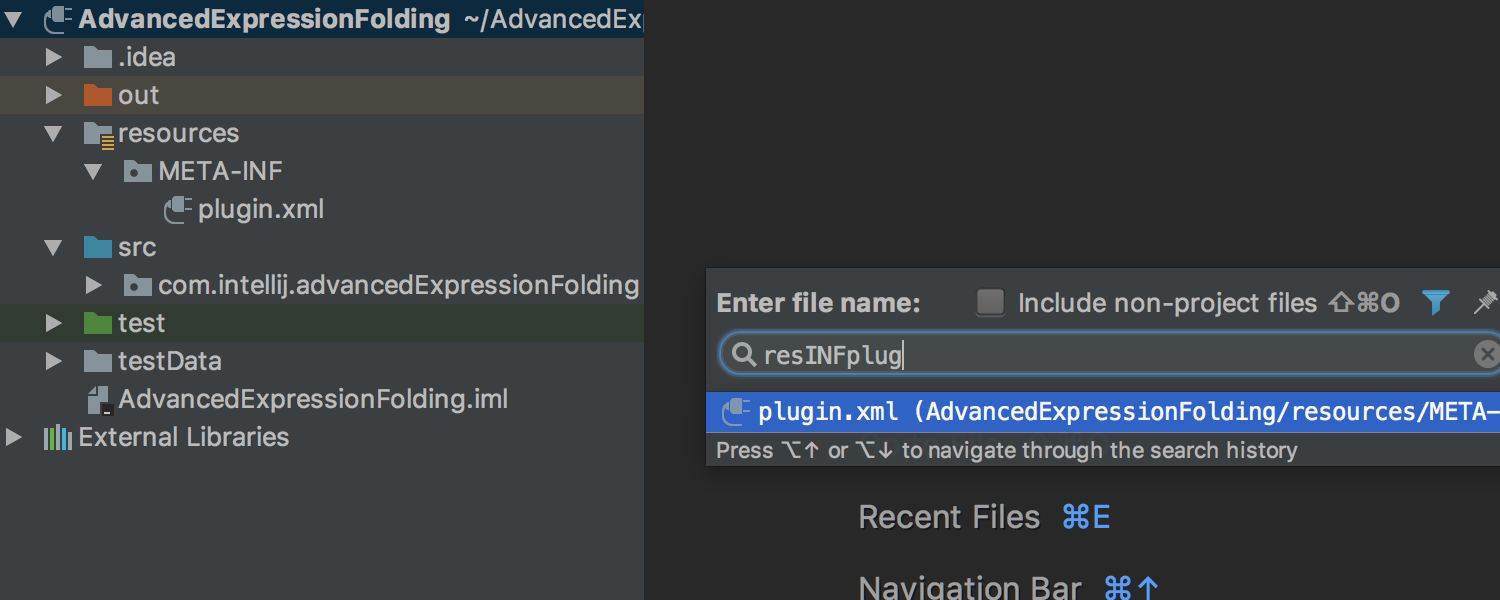
Last but not least, the Go to File action now doesn’t require slashes between folder names and before the file name:
That’s it for today. To try these new features, download the EAP build from the EAP page on our website, or even better, from Toolbox App.
Since this is an early build, things sometimes may not work as expected. If you come across anything that doesn’t work like it’s supposed to, let us know in our issue tracker.
Happy developing!