IntelliJ IDEA
IntelliJ IDEA – the Leading IDE for Professional Development in Java and Kotlin
IntelliJ IDEA 2018.3 EAP: Git Submodules, JVM Profiler (macOS and Linux) and more

Please welcome the new IntelliJ IDEA 2018.3 EAP build with all its exciting new features! Available from the website, via Toolbox App, or as a patch update from the IDE.
At last, it’s here! We’ve just added support for the most voted feature in our issue tracker – yes you’ve heard right – the upcoming IntelliJ IDEA 2018.3 has support for Git submodules. Now when you clone repositories with the submodules, IntelliJ IDEA will not only clone the root repositories but also all its submodules. Moreover, update project now correctly updates all the submodules according to their state. Oh, and Diff, History, and Conflict resolution now work for submodule folders too.
IntelliJ JVM Profiler
Just when you thought it had everything, the upcoming IntelliJ IDEA 2018.3 Ultimate edition brings in the JVM Profiler. Currently, it only works on macOS and Linux, but don’t worry, Windows support is on the way.
Update: In IntelliJ IDEA v2018.3 Ultimate edition, the JVM Profiler is available as an experimental feature. To start using the JVM Profiler go to the Maintenance dialog (Ctrl-Alt-Shift-/ on Linux, Cmd-Alt-Shift-/ on macOS), select the Experimental features option, and then select the idea.profiler.enabled checkbox.
The upcoming IntelliJ IDEA 2018.3 integrates a low overhead sampling profiler that can profile JVM and Native code – Async profiler. The async profiler doesn’t suffer from safe points bias, for more details please refer to the readme. It means that the IDE can now show the native parts of the execution stack, profile memory allocations, show Flame Graphs, and more.
For IntelliJ-based projects, you can start a Java (and Kotlin) run configuration with the profiler by using the profiler icon on the main toolbar. Gradle and Maven projects are not supported just yet.

You can if you want also profile every single test individually

You can attach the profiler to a process which is already running with the Run | Attach Profiler to Local Process… action.
You can also open plain text dumps, generated by an async profiler with Run | Import Profiler Dump.
The brand new CPU Profiler tool window displays: Flame Chart, Call Tree, and Method List. You can navigate from any of those tabs to the source code by using the Jump to Source context action( available for all JVM stack frames). Just so you know, you can also use a speed search in the tabs of the CPU Profiler tool window.
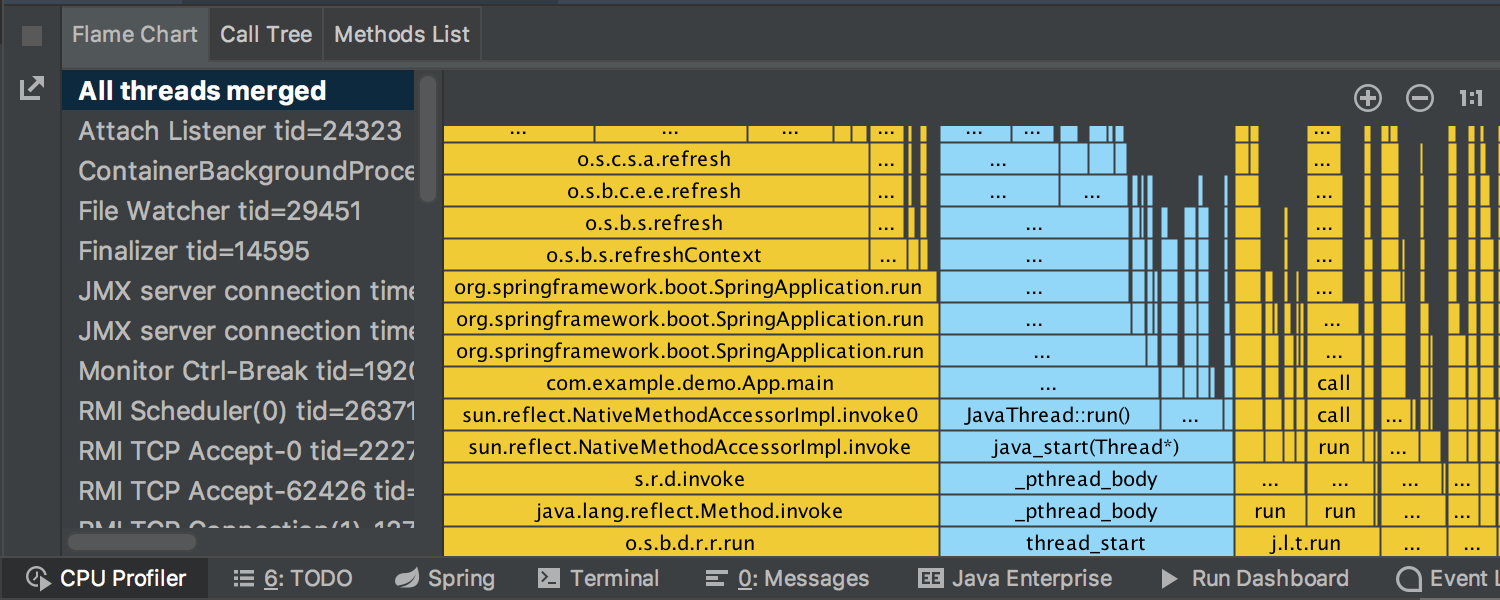
While you are in the Flame Chart, you can focus on any method by simply double-clicking on it, or you can use scrolling to resize the chart.
Activity Monitor
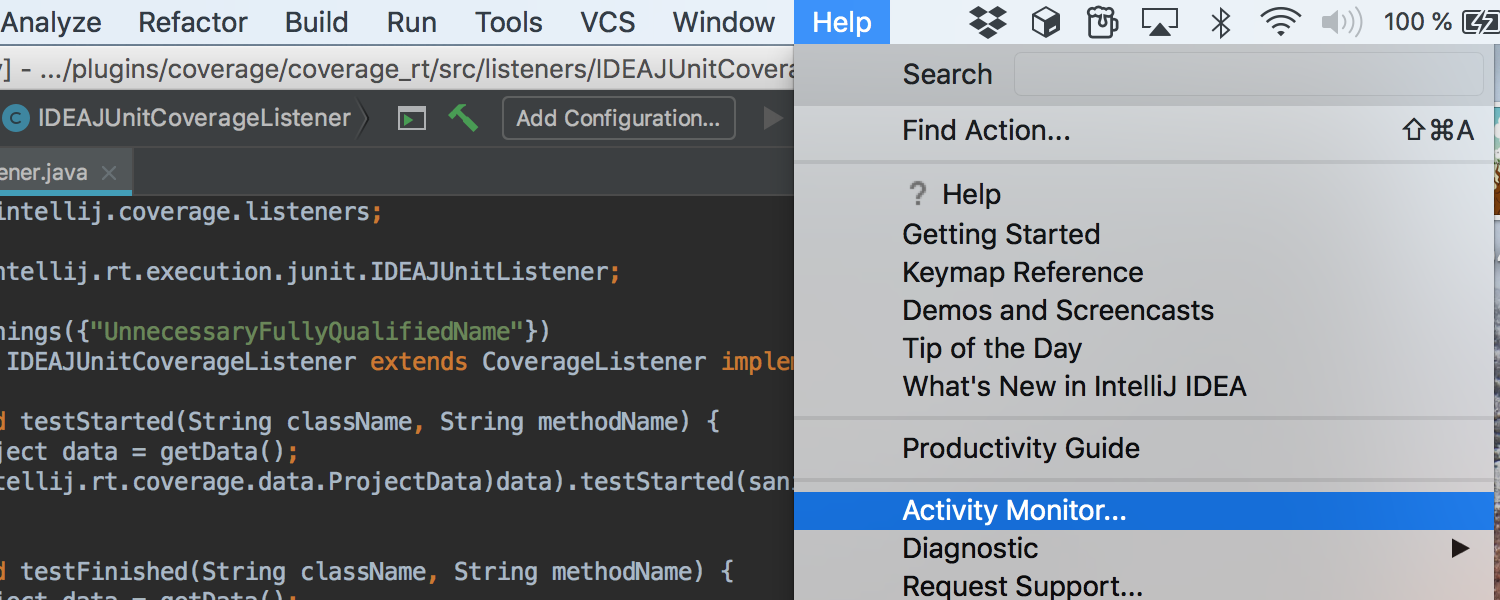
By the way, this EAP comes with a brand new Activity Monitor, so now you can see how much CPU the subsystems and plugins (both built-in and additionally installed) are consuming. The Activity Monitor arranges the subsystems, categories, and entries in the list by how much %CPU they are currently using; this may help you find slow plugins, slow subsystems, or other pain point areas. It’s available via Main menu | Help | Activity Monitor. This is currently only an experimental feature. When you report issues within the IDE, please don’t forget to attach CPU snapshots when applicable.

Java
IntelliJ IDEA now highlights in the editor redundant usages of @SuppressWarning annotation, or // noinspection line comment, or /** noinspection */ JavaDoc comment “Redundant suppression”. Previously the IDE reported such cases only in the Inspection Results tool window. In case a suppressed inspection no longer addresses any warnings in the associated method body, class, or statement, the IDE will not only warn you but it also provides a quick-fix to remove such unnecessary annotations and comments. Please note that in order for the IDE to detect redundant suppressions, it is important that the suppressed inspections be enabled.
And please also make sure that the Redundant suppression inspection itself is enabled in Preferences/ Settings | Editor | Inspections | General | Redundant suppression.

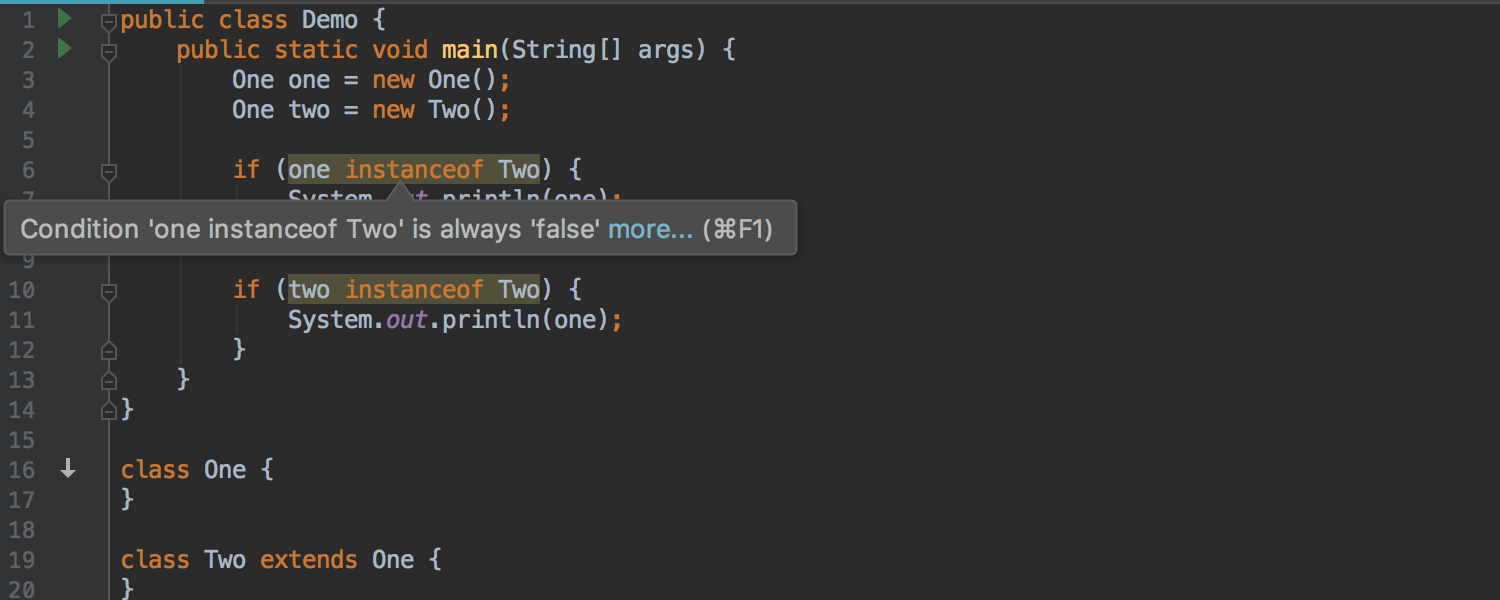
The dataflow analysis now tracks the exact type of value (not only instanceof), in case it’s the result of a “new Smth()” expression.
Kotlin
The Kotlin plugin bundled with the IDE has been updated to Kotlin 1.3 RC.
JVM debugger
In the first EAP build of IntelliJ IDEA 2018.3, we introduced a new debugger feature that allows you to attach to Java processes that were started without a debug agent.
With this fresh EAP build we extended this ability so now you can attach to the processes that have been started with JDK version 9+.
Editor
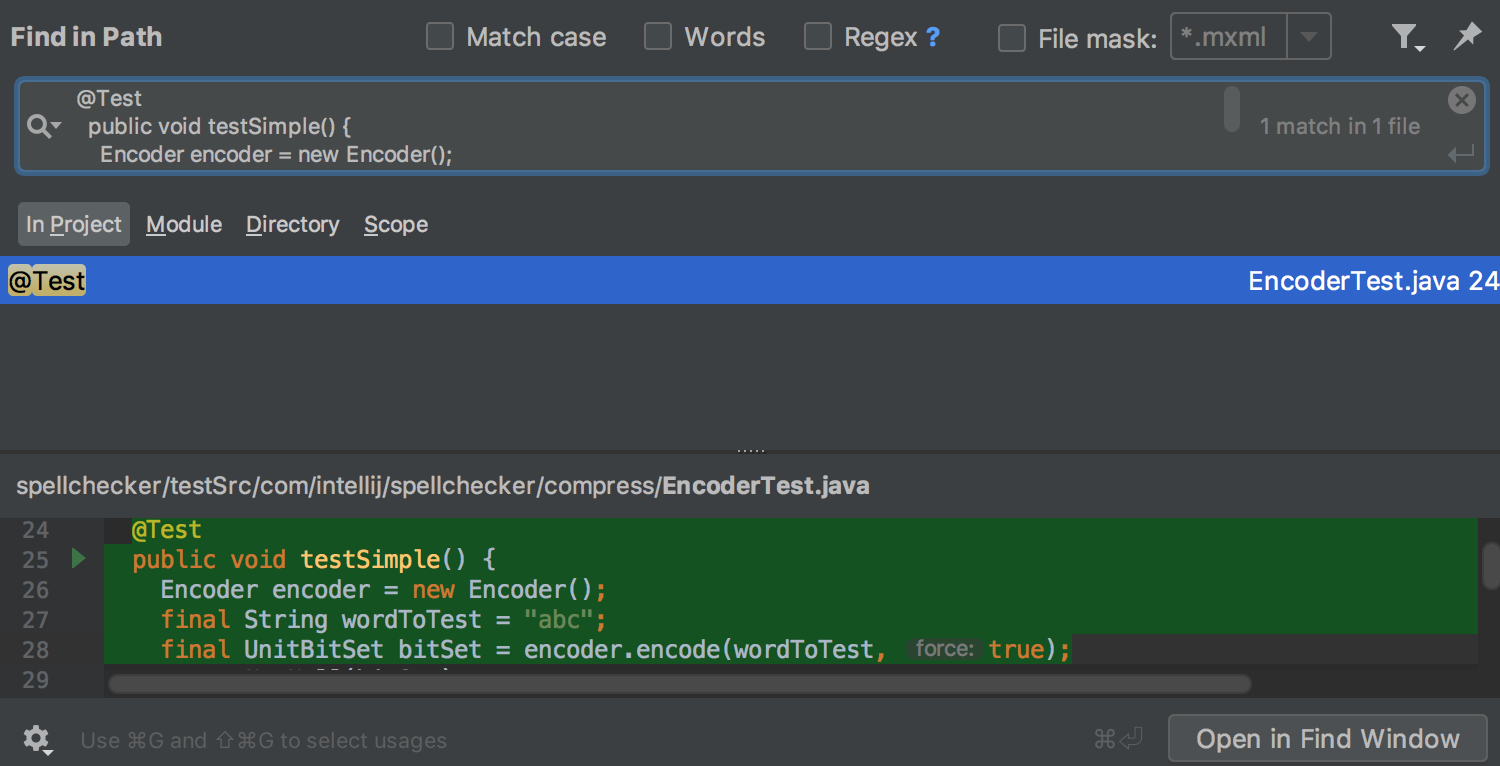
Now the search/replace for multi-line fragment works in Find in Path/Replace in the Path window. There is no need to use regular expressions to perform a multiline search, as a workaround anymore.
We’ve also updated JDK to the 1.8.0_152-release-1293-b14 x86_64 version. You’ll find the following important fixes:
- Drawing characters in Monospaced font was fixed ( JRE-847 )
- The issues with frames maximization in HiDPI were resolved ( JRE-938 , JRE-956 )
The full list of all the changes is available in the IDE release notes and the JRE release notes.
Download a fresh new IntelliJ IDEA 2018.3 EAP build now! Please don’t hesitate to submit any issues you find to our tracker. We appreciate any feedback!
Happy Developing!