IntelliJ IDEA
IntelliJ IDEA – the Leading IDE for Professional Development in Java and Kotlin
Big Data Tools Plugin for Apache Zeppelin

![]()
Zeppelin is a web-based notebook for data engineers that enables data-driven, interactive data analytics with Spark, Scala, and more.
The project recently reached version 0.9.0-preview2 and is being actively developed, but there are still many things to be implemented.
One such thing is an API for getting comprehensive information about what’s going on inside the notebook. There is already an API that completely solves the problems of high-level notebook management, but it doesn’t help if you want to do anything more complex.
That was a real problem for Big Data Tools, a plugin for IntelliJ IDEA that provides integration with Spark, Hadoop, and makes it possible to edit and run notebooks in Zeppelin.
The high-level API for creating and removing notebooks is not enough for the IDE. You need much lower-level access to do things like smart autocompletion or visual debugging.
This is why ZTools came to exist. It’s a tool that allows you to pull information from Zeppelin, even if it’s not present in the API. The server-side code is publicly available on GitHub under the Apache License 2.0. About 90% of the code is written in Scala, and the rest is in Java.
ZTools will actually work with any Scala REPL, so it is not just for Zeppelin, but for dealing with Scala in general.
To understand what ZTools can do, we’ll look at the Variables View panel and code editor in the Big Data Tools plugin. This plugin is a part of IntelliJ Ultimate Edition, and of course, its code is not open.
Nevertheless, this example shows how it might look like in your own product.
When you add a new notebook to Big Data Tools, there’s an option to enable ZTools integration.
Now you can observe the values of local variables:
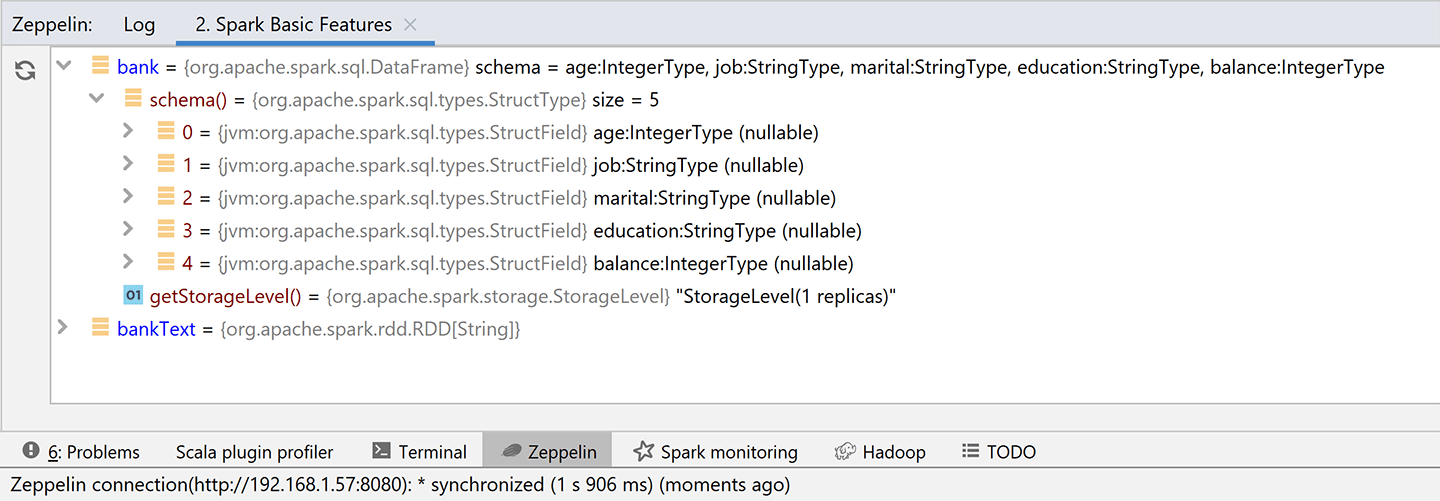
Wait, what? How is it possible to view the variables after the execution?
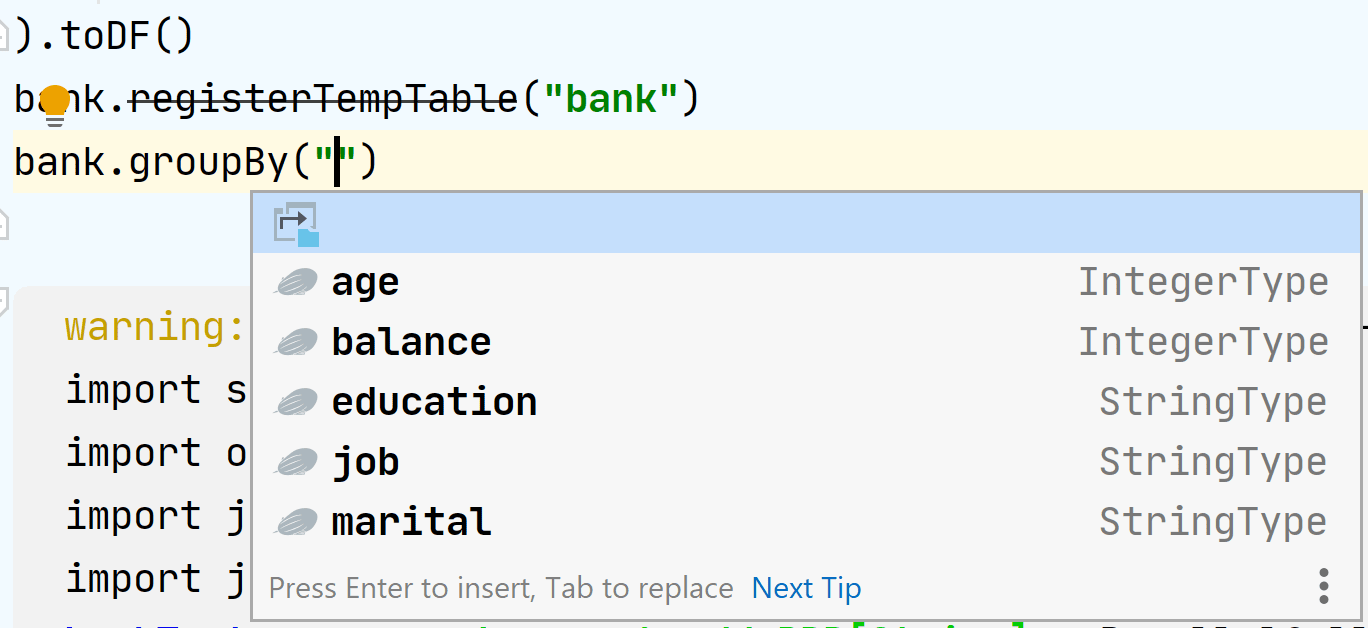
This simple feature is an alternative to the debugger and it’ll save you a lot of time. And if that’s not enough, you can now autocomplete columns of the sql.DataFrame in the editor.
It looks and feels like magic, and this is what ZTools provides us. At the time of the paragraph’s execution, it analyzes the context on the server and sends it to the client.
Part one: client-server communication
Let’s try to understand how Zeppelin finds a list of local variables and columns.
There are two ways. We can go from the server side (the open-source code for this is available on GitHub), or from the client side (a closed-source part of IntelliJ IDEA).
The latter method is easier than it sounds: you can intercept traffic and see requests and responses.
Let’s start with this and see how deep the rabbit hole goes. It might also teach us about an exciting hack on how to write clients for Zeppelin (spoiler: it does).
You can filter traffic in different ways, but I like to use a combination of mitmproxy and Wireshark. Sorry, I don’t have the time to go into the technical details of setting up these tools in this article.
Let’s run some paragraphs from the standard Zeppelin example, “Spark Basic Features”.
Let’s go to mitmproxy and see what a typical Zeppelin server response to its standard API /api/notebook looks like (see this gist for the full response).
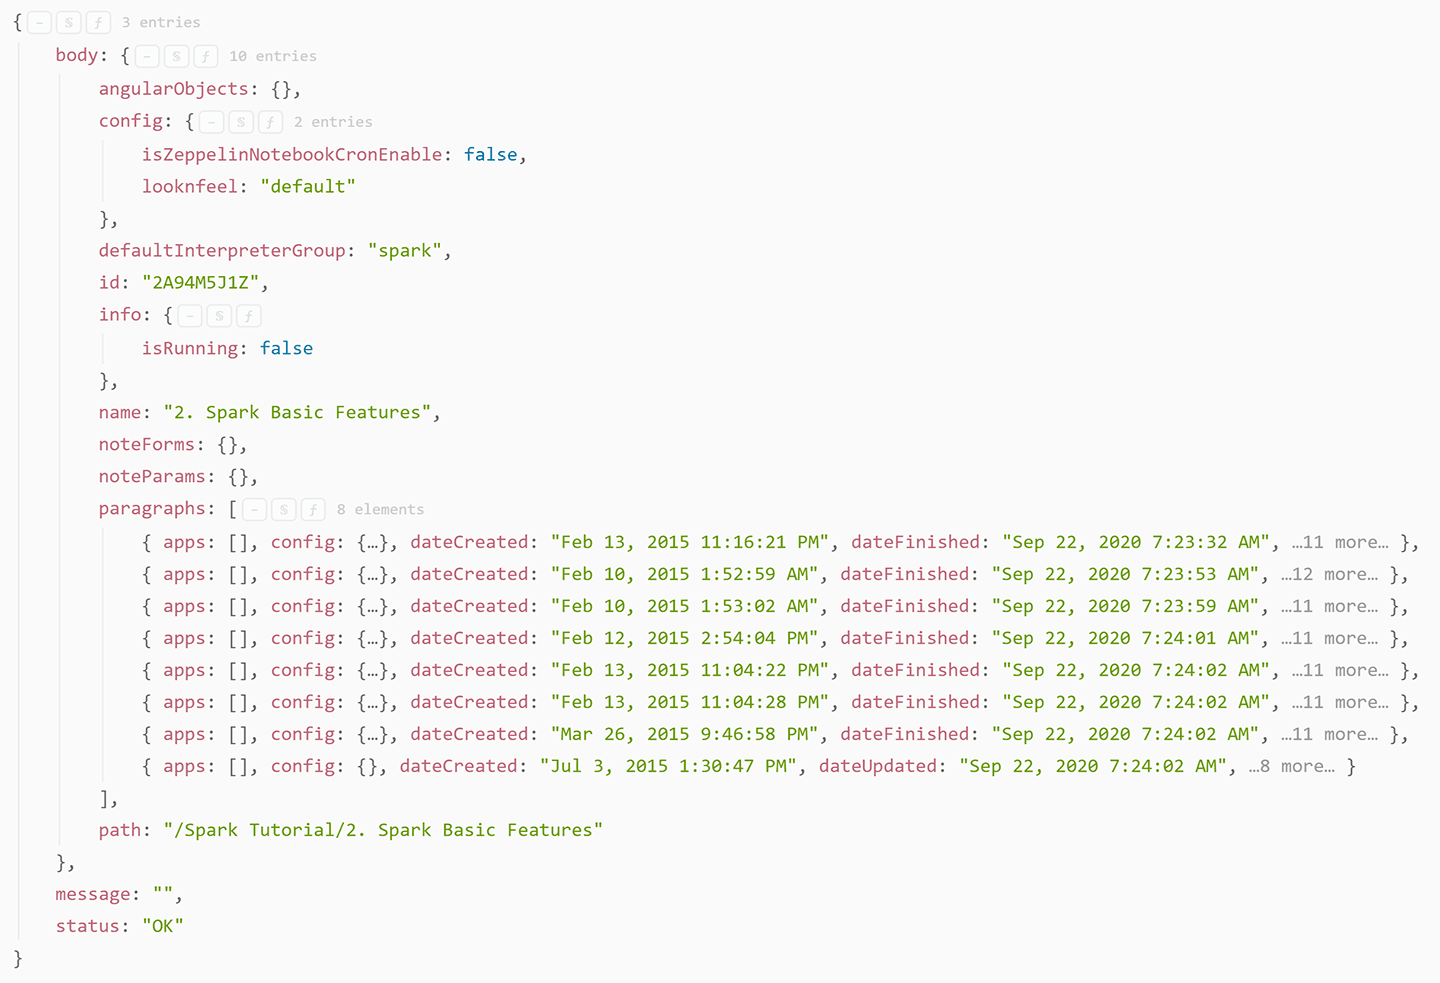
There is no interesting data here, as expected. But it does lead to some interesting questions: Where are our local variables? Could it be that they are transmitted via WebSocket?
Now let’s go into Wireshark and look closely at the traffic:
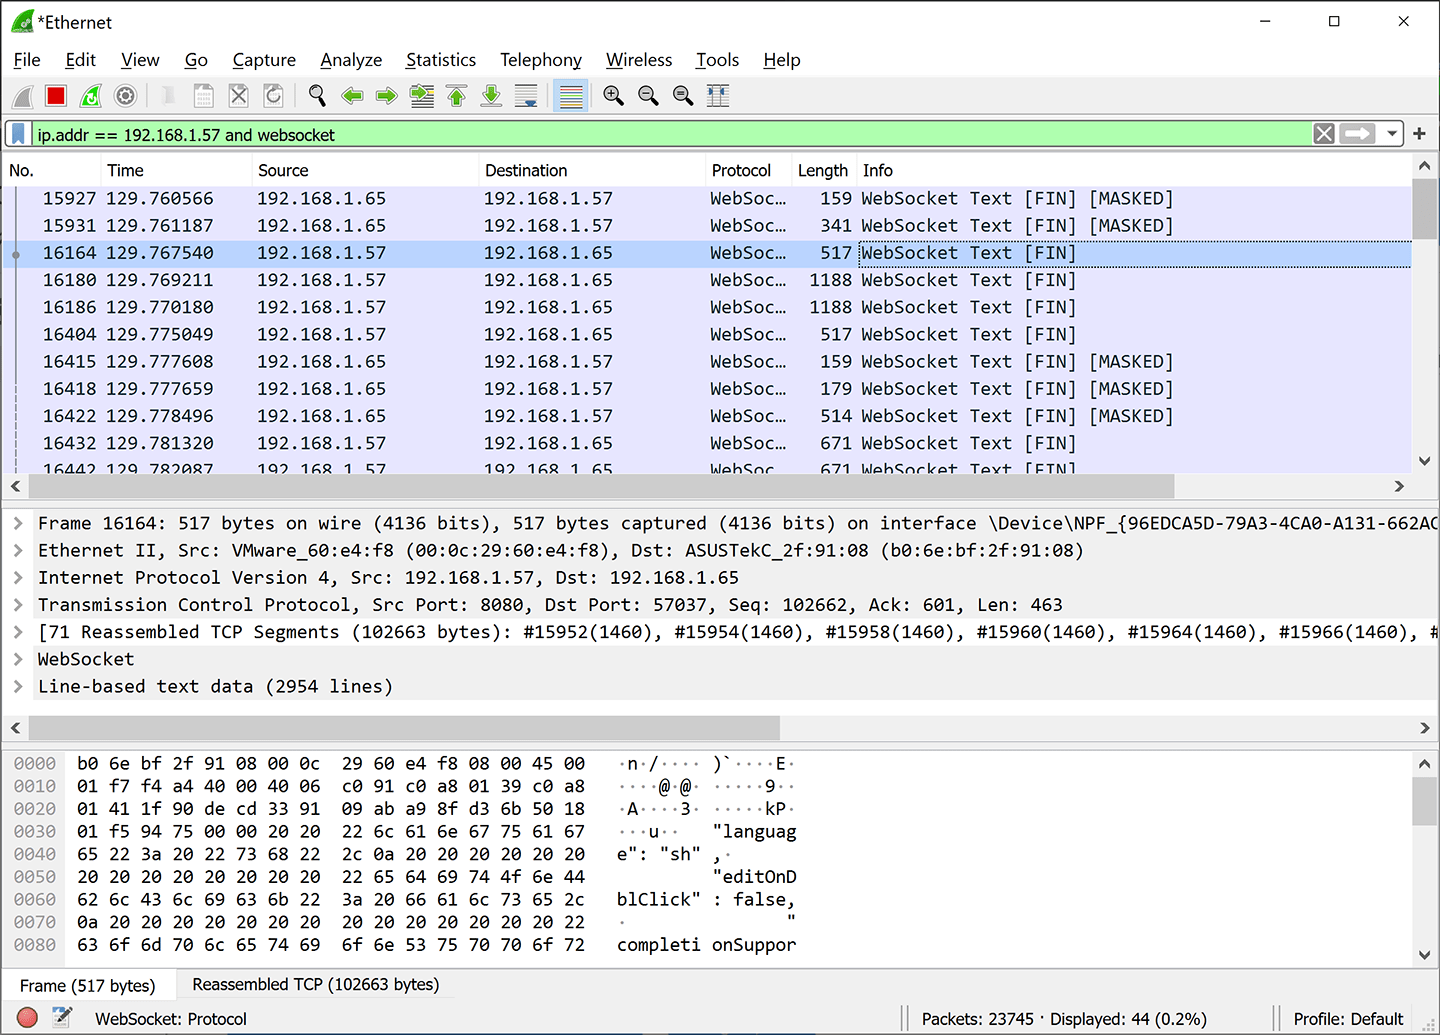
After a little digging in the traffic, we see that immediately after starting a paragraph, some JSON with the full text of the paragraph is sent to the server. This is expected.
Now if you don’t blink, you’ll notice something really weird.
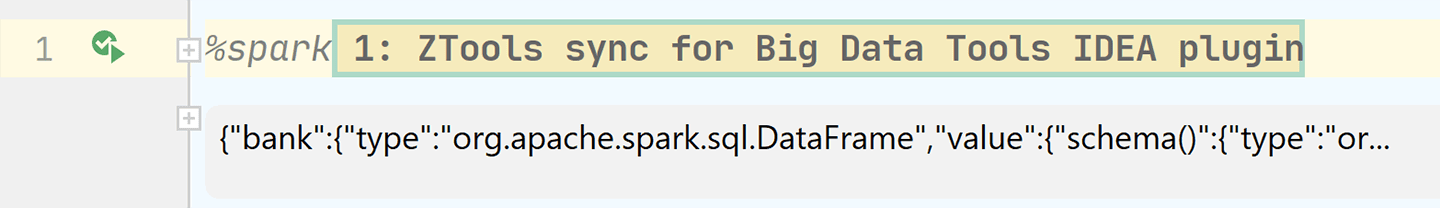
When you run a paragraph in Big Data Tools, for a split second an additional paragraph appears in your notebook in the IntelliJ IDEA interface, and then disappears:
Let’s take a look at how this affects traffic.
First, this temporary paragraph was sent to the server. The full text of the request is here, but we are only interested in this piece of it:
%spark
// It is generated code for integration with Big Data Tools plugin
// Please DO NOT edit it.
import org.jetbrains.ztools.spark.Tools

Tools.init($intp, 3, true)
println(Tools.getEnv.toJsonObject.toString)
println("----")
println(Tools.getCatalogProvider("spark").toJson)"
This is the code of that temporary paragraph that mysteriously appeared and then disappeared. This is where the call to ZTools comes in, and it gives us a clue as to which functions we need to examine first in the GitHub repository.
The server returns a lot of data chunks, but we’re only interested in two of them:
- One contains the complete structure and values of the `bank` and `bankText` local variables.
- The other contains the dataframe columns.
Now we’ve found everything we were looking for: client requests, server response, and how exactly the additional data is transferred.
Keep reading to find out whether we can apply the same technique to our own application (another spoiler: we can).
Summary of part one
- Thanks to traffic scanning, we learned an essential trick for writing Zeppelin clients using ZTools: you can add a temporary paragraph, call ZTools, and then immediately delete the temporary paragraph (before anyone notices it). This is how the Big Data Tools plugin works.
- Inside the temporary paragraph, we can see calls to the `Tools` class. That gives us a good starting point for examining the ZTools source code on GitHub.
Part two: ZTools source code
You can find ZTools sources on GitHub.
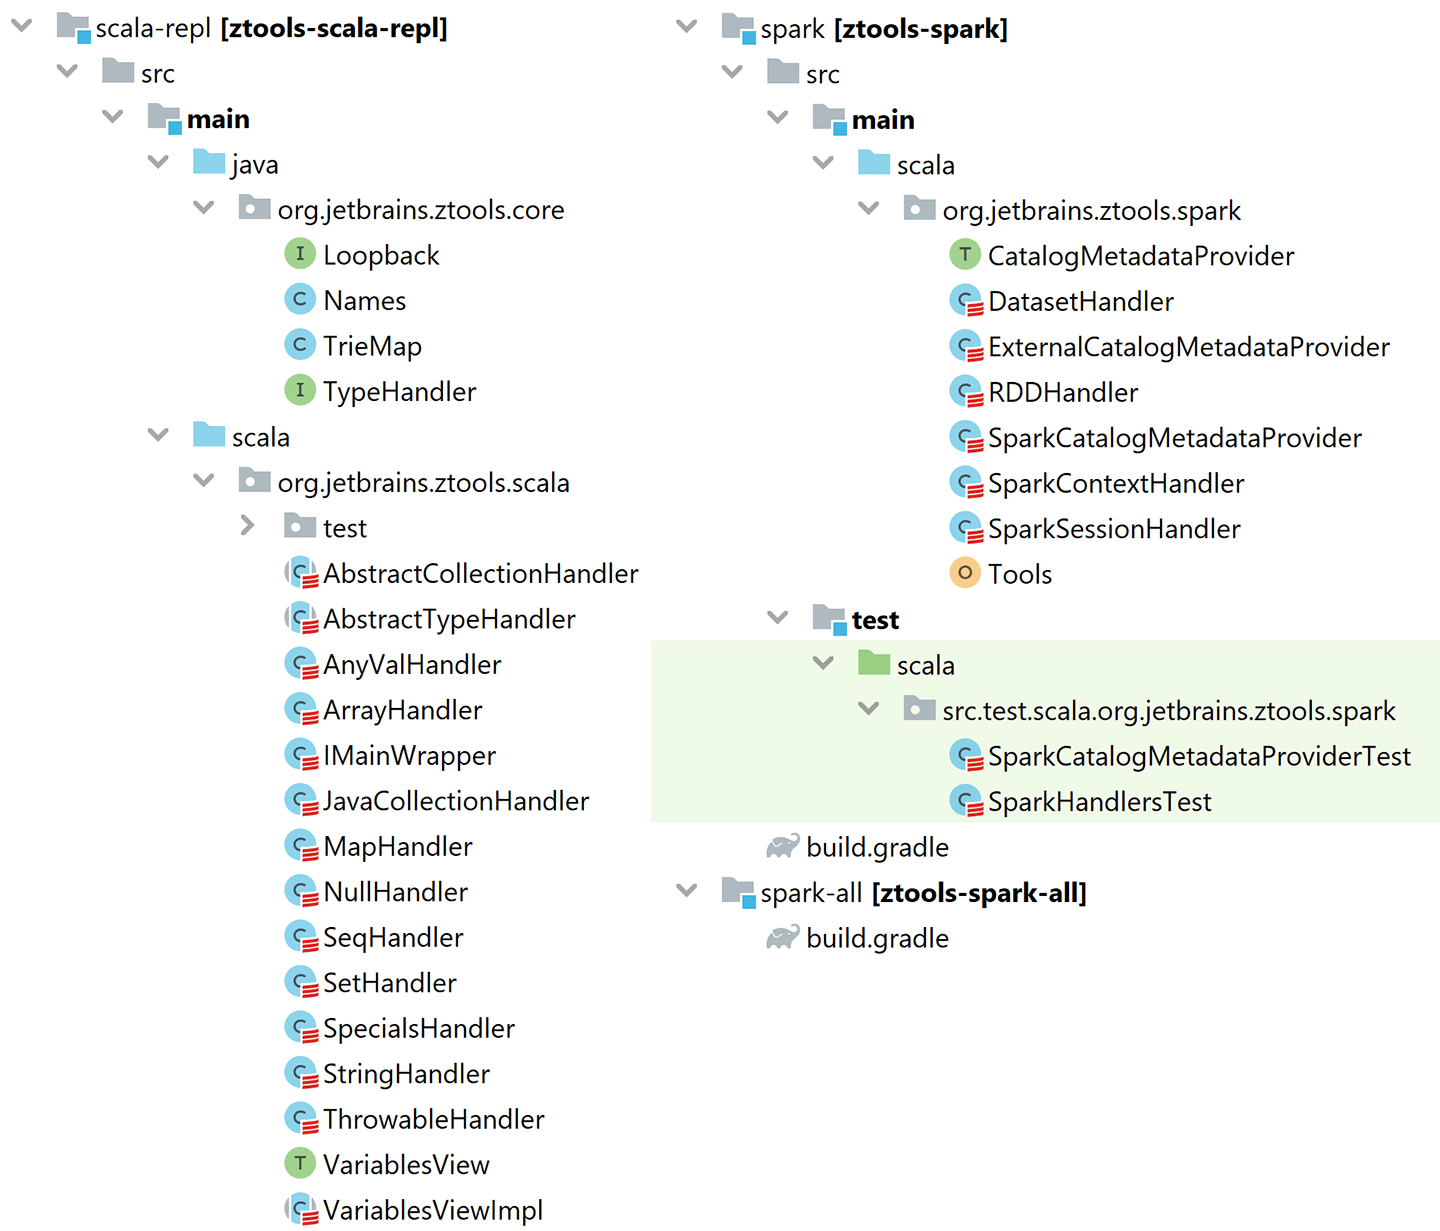
The repository consists mainly of two large parts: “scala-repl” and “spark”.
Let’s take a look at that temporary paragraph code again:
%spark
// It is generated code for integration with Big Data Tools plugin
// Please DO NOT edit it.
import org.jetbrains.ztools.spark.Tools

Tools.init($intp, 3, true)
println(Tools.getEnv.toJsonObject.toString)
println("----")
println(Tools.getCatalogProvider("spark").toJson)"
The last line lists columns in the dataframe using the Spark function `Catalog.listTables() and Catalog.listColumns() then` transforms them into JSON and sends them to the client.
Even more interesting is where the local variables come from. When `Tools` is initialized, something called VariablesView is created, and there’s a whole separate subproject dedicated to it. Let’s take a look inside the VariablesView subproject.
If you look at the tests, it should become instantly clear how to use it:
  @Test
  def testSimpleVarsAndCollections(): Unit = {
    withRepl { intp =>
      intp.eval("val x = 1")
      val view = intp.getVariablesView()
      assertNotNull(view)
      var json = view.toJsonObject
      println(json.toString(2))
      val x = json.getJSONObject("x")
      assertEquals(2, x.keySet.size)
      assertEquals(1, x.getInt("value"))
      assertEquals("Int", x.getString("type"))
      assertEquals(1, json.keySet.size)
}
It lets us interpret arbitrary Scala code and retrieve information about the variables in it.
The actual interpretation of the code is carried out by the standard Scala compiler, or to be more precise, by the scala.tools.nsc.interpreter package.
 def withRepl[T](body: Repl => T): T = {
    // ...
    val iLoop = new ILoop(None, new JPrintWriter(Console.out, true))
    iLoop.intp = new IMain(iLoop.settings)
    // ...
  }
First, the ILoop is created, this is the main loop of the interpreter. Inside it is IMain – this is the interpreter itself. Now we call `interpret(code)` and that’s it.
Information about variables is obtained through the following trait:
trait VariablesView {
  def toJson: String

  def toJsonObject: JSONObject

  def toJsonObject(path: String, deep: Int): JSONObject

  def variables(): List[String]

  def valueOfTerm(id: String): Option[Any]

  def registerTypeHandler(handler: TypeHandler): VariablesView

  def typeOfExpression(id: String): String
}
Of all these methods, the most important is the one that gets the list of variables. There’s nothing supernatural going on here at all, it’s implemented by a direct request to the Scala interpreter, iMain:
override def variables(): List[String] =
  iMain.definedSymbolList.filter { x => x.isGetter }.map(_.name.toString).distinct
The function that renders the JSON of the “temporary paragraph” is much more interesting. Inside toJsonObject() is some complex dark magic that allows you to wander through the links between dependent variables and limit the number of collections and strings that are sent.
By default, the maximum collection size is 100, and the maximum string length is 400 characters. So you don’t have to worry that a terabyte of commas will be sent over the network to the client (the Big Data Tools plugin or your own app), and make everything hang forever. These limits are currently hardcoded, but if I had my way, I would move them to the settings.
If you use ZTools through the `Tools` class, some variables are unavailable to you. Things like $intp, sc, spark, sqlContext, z, and engine are banned. If you are writing your own launcher, you should also consider creating a similar filter.
Summary of part two
- With ZTools, you can get a variety of data from Zeppelin without cluttering up the public API.
- Currently, only the data that exists during the lifetime of our temporary paragraph is available.
- When you are inside Zeppelin, interpreting Scala code is easy. Especially when you already have a REPL binding from the ZTools project. You don’t have to limit yourself to ideas from ZTools, and you can add things on your own.
- The data is limited: 400 characters per line, 100 elements per collection, and some stoplisted variables that will never get into your JSON.
Part four: writing your own client
Let’s take advantage of the fact that ZTools can work without IntelliJ IDEA and write our own client app. A working example can be found in this GitHub repository.
To prove it doesn’t depend on Java, let’s write everything in JavaScript (TypeScript, to be more precise) and Node.js. We will use Axios as a library for HTTP requests – as it has a pretty nice interface with promises.
First, let’s find a specific notebook on the server. I really like the “Spark Basic Features” notebook from the sample library.
const notes = await axios.get(NOTE_LIST_URL);

let noteId: string = null;
for (let item: Object of notes.data.body) {
   if ( item.path.indexOf('Spark Basic Features') >= 0 ) {
       noteId = item.id;
       break;
   }
}
Now let’s create our temporary paragraph:
const PAR_TEXT = `%spark
import org.jetbrains.ztools.spark.Tools
Tools.init($intp, 3, true)
println(Tools.getEnv.toJsonObject.toString)
println("----")
println(Tools.getCatalogProvider("spark").toJson)`;
And new let’s create the temporary paragraph create on the server side:
const CREATE_PAR_URL = ${Z_URL}/api/notebook/${noteId}/paragraph;
const par: Object = await axios.post(CREATE_PAR_URL, {
   title: 'temp',
   text: PAR_TEXT,
   index: 0
});
And run it:
const RUN_PAR_URL = ${Z_URL}/api/notebook/run/${noteId}/${parId};
await axios.post(RUN_PAR_URL);
Получим ответ:

const INFO_PAR_URL = ${Z_URL}/api/notebook/${noteId}/paragraph/${parId};
const { data } = await axios.get(INFO_PAR_URL);
Then we will delete it, because it’s useless now:
const DEL_PAR_URL = ${Z_URL}/api/notebook/${noteId}/paragraph/${parId};
await axios.delete(DEL_PAR_URL);
The received response needs to be cut into two parts and parsed as JSON:
const [varInfoData, dbInfoData] = (data.body.results.msg[0].data)
   .replace('\nimport org.jetbrains.ztools.spark.Tools\n', '')
   .split('\n----\n');
const varInfo = JSON.parse(varInfoData);
const dbInfo = JSON.parse(dbInfoData);
Now, let’s list all the variables:
for (const [key, {type}] of Object.entries(varInfo)) {
   console.log(${key} : ${type});
}
And here is our schema:
for (const [key, database] of Object.entries(dbInfo.databases)) {
   console.log(Database: ${database.name} (${database.description}));
   for (const table of database.tables) {
       const columnsJoined = table.columns.map(val => ${val.name}/${val.dataType}).join(', ');
       Logger.direct(${table.name} : [${columnsJoined}]);
   }
}
See how easy that was? You can write this code faster than I can finish my third cup of morning coffee.
Part five: distribution
It’s not enough just to write a client for Zeppelin – you also need to change the Zeppelin server settings to install ZTools.
But on a big production server, you probably don’t have the permissions you need to do this. You’ll have to beg ask the system administrators. There’s absolutely no way to avoid this, and that makes me sad.
As for the installation process itself, if you use vanilla ZTools without any patches, you can use our public repository. You can add it as a Maven artifact or a separate JAR file.
- Repository: https://jetbrains.bintray.com/zeppelin-dependencies
- Artifact: org.jetbrains.ztools:ztools-spark-all:0.0.13
- JAR file: https://dl.bintray.com/jetbrains/zeppelin-dependencies/org/jetbrains/ztools/ztools-spark-all/0.0.13/ztools-spark-all-0.0.13.jar
If you want to extend ZTools yourself, you can build a project from sources using Gradle. You will get a JAR file, and then you’re free to deploy it as you like under the open-source Apache License 2.0.
Big Data Tools automatically installs ZTools on the connected Zeppelin servers. We strongly recommend that you take this route.
Summary
- With ZTools, you can get a variety of data from Zeppelin without cluttering up the public API.
- The code that does that is quite simple and straightforward, and is distributed under the open-source Apache License 2.0.
- If your security folks need to monitor traffic this article shows that the traffic content is quite understandable even for people without special skills.
- Writing client code can be complicated. But now you know the “temporary paragraph” trick and can get some inspiration from the Big Data Tools user interface.