IntelliJ IDEA
IntelliJ IDEA – the Leading IDE for Professional Development in Java and Kotlin
Early Access Program for Qodana, a New Product That Brings the “Smarts” of JetBrains IDEs Into Your CI Pipeline


JetBrains IDEs are well known for their ability to understand code. They can track declarations, check references and types, and collect possible execution paths. Thanks to all this static analysis, you are able to rename and move things around safely, get appropriate code completion, and get warned with a message saying “hey, this won’t run” from the code inspection if you are adding something that won’t work into your code.
Having all this while you are working in the editor is extremely helpful, but modern CI-centric workflows require having a reliable quality gate in your build pipeline. The multitude of tools being actively developed and used in this area clearly support this statement.
It was technically possible to run JetBrains IDE inspections for the whole project in headless batch mode well before the CI era. However, integrating an IDE into the CI pipeline as a typical linter proved difficult.
Qodana is the solution
Qodana comprises two main parts: a nicely packaged GUI-less IntelliJ IDEA engine tailored for use in a CI pipeline as a typical “linter” tool, and an interactive web-based reporting UI.
It makes it easy to set up workflows to get an overview of the project quality, set quality targets, and track progress on them. You can quickly adjust the list of checks applied for the project and include or remove directories from the analysis.
The example above shows how to exclude a source directory or inspection category from the analysis. Another way to configure this is to use the qodana.yaml file. See the details in our user guide.
Demo of popular projects
We’ve created a playground for you to see Qodana in action for popular projects: OkHttp, Guava, ZXing, and a couple of others. Although the code in these projects may run on millions of machines daily, with the help of Qodana you can easily see what can be improved. It doesn’t mean that the code is bad, it just means that the technologies are evolving, the surroundings are changing, and we need to keep up.
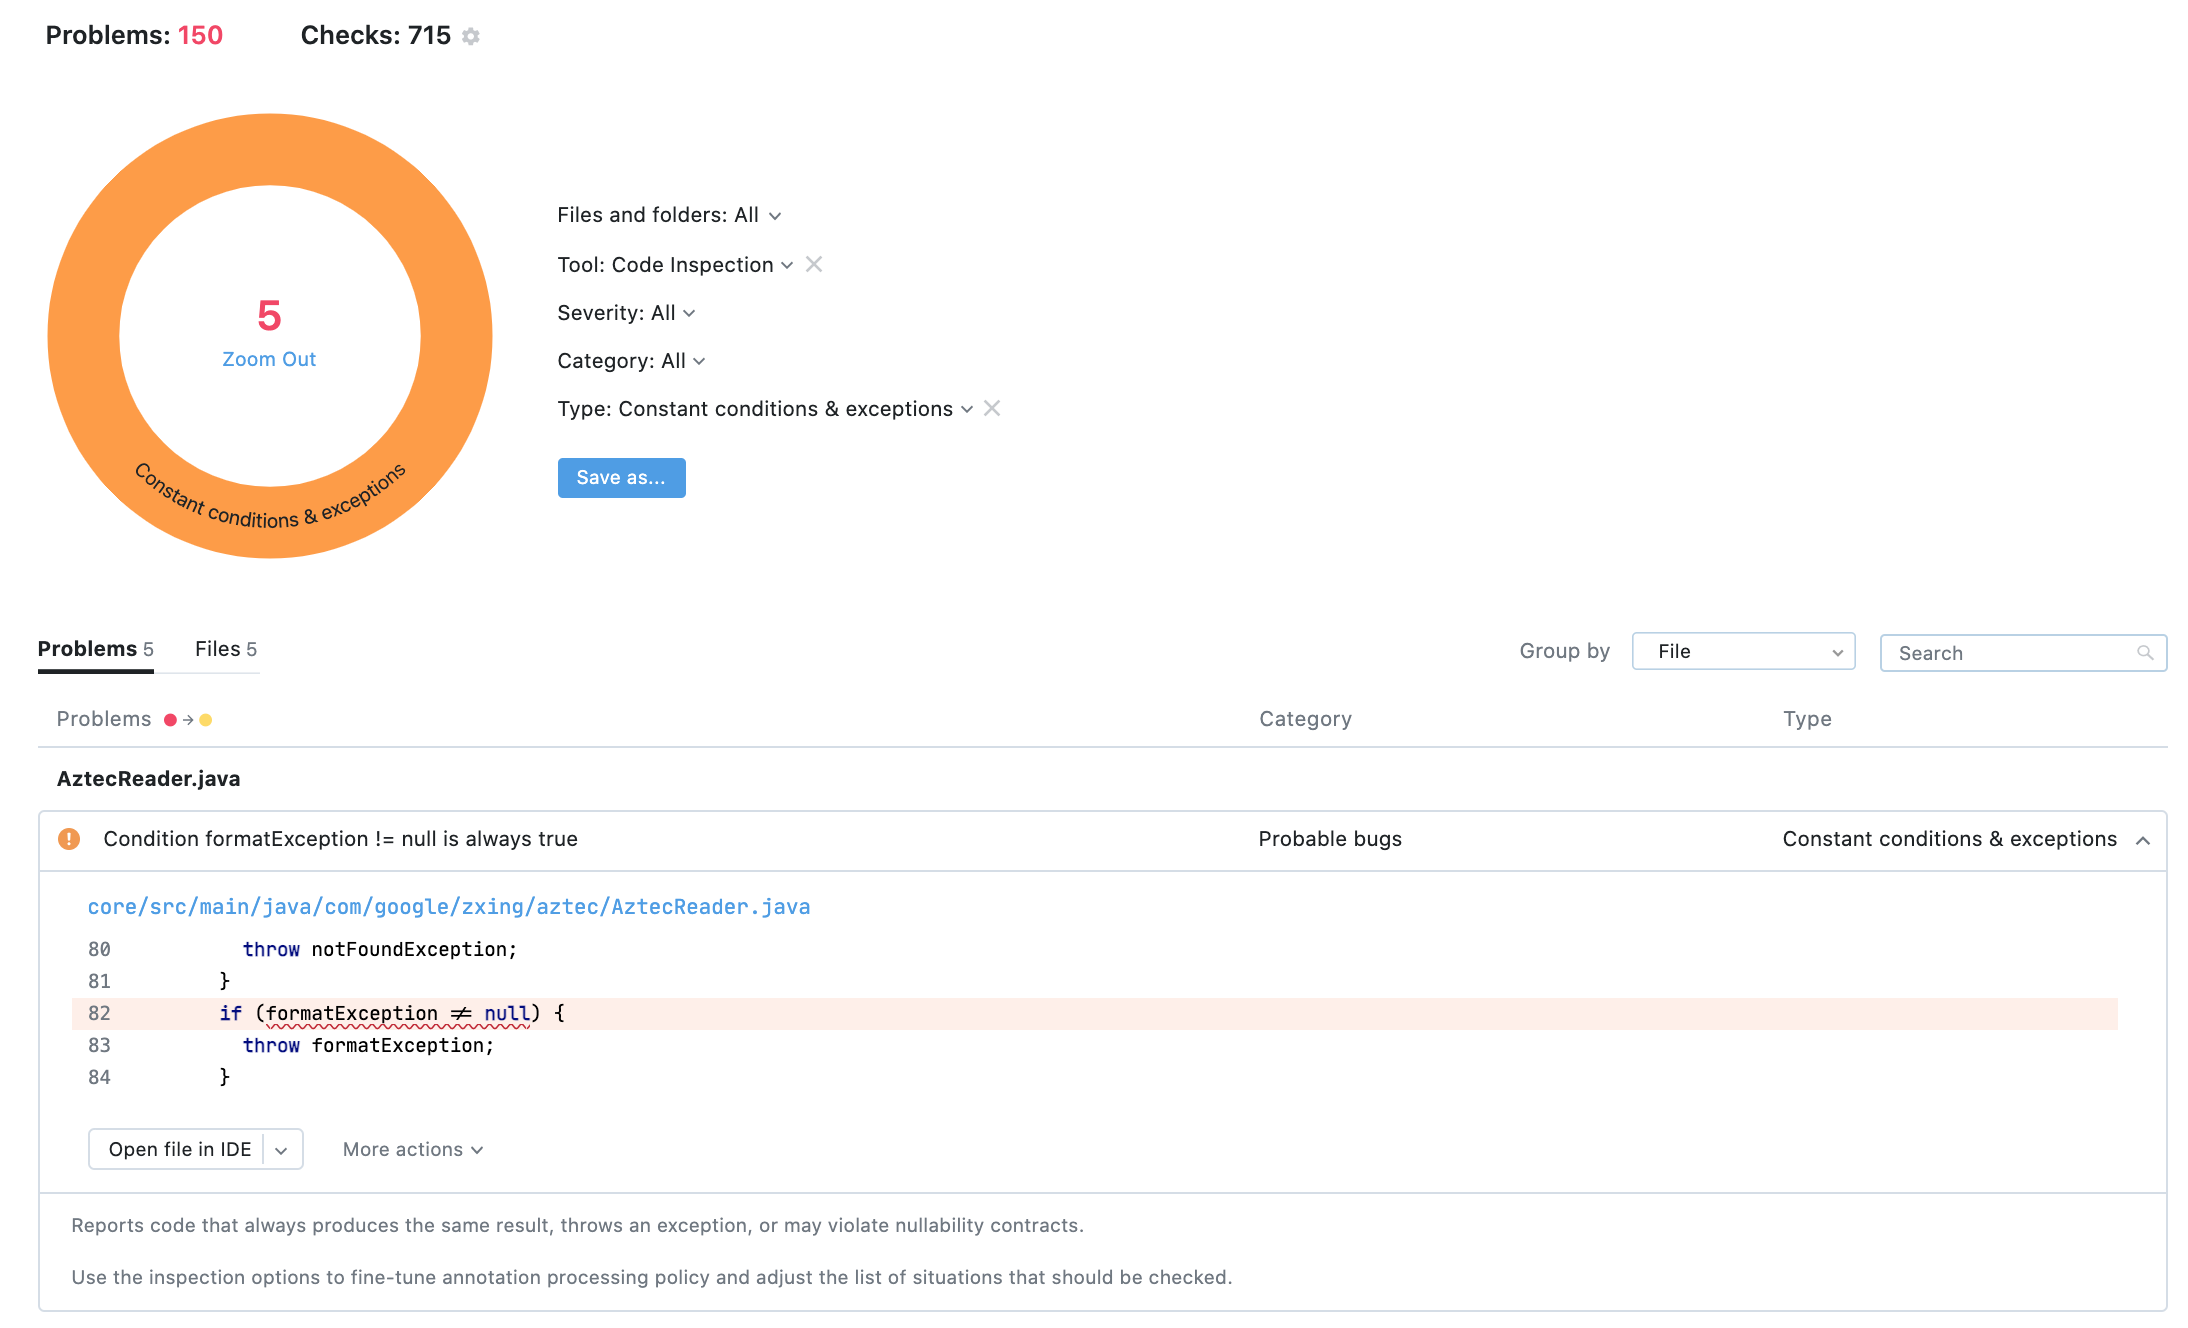
In the example report above that was run on the ZXing project, you can see that there are 5 cases in 5 files where the condition has always the same result. You can click Open in IDE and apply quick-fixes to this code. As a result, the next developer who works with these files will be able to spend less time trying to work out why this condition is included and whether it is redundant or not.
To open the sandbox playground, use the following link https://qodana.teamcity.com/login.html and select the “login as guest” option to explore the UI integrated into the JetBrains cloud CI, TeamCity. You can use the Qodana tab to see what problems it found, browse the list of inspections that it ran, and try out the different options for yourself. Once you have an idea of how it works and what you can do with it, then it’s time to take the next step and try Qodana on your own project.
Using Qodana on your project
Qodana is packed into a ready-to-use Docker image. You can run it:
- By manually invoking it on your projects.
- By integrating it into your CI pipeline.
- Using GitHub Actions.
- Using GitHub Application.
- On JetBrains TeamCity standalone and Cloud.
Docker image
Pull the image from Docker Hub:
docker pull jetbrains/qodana
Run the command below, replacing source-folder with your project’s root path and open the URL printed in the command line output to view the report.
docker run -it -v <source-folder>/:/data/project/   \
-p 8080:8080 jetbrains/qodana --show-report
You can find more information about the Docker image here.
GitHub Actions
Qodana can run on any CI tool, but for simplicity let’s take a look at how you can use it with the Qodana – Code Inspection GitHub action, which you can find on the GitHub Marketplace.
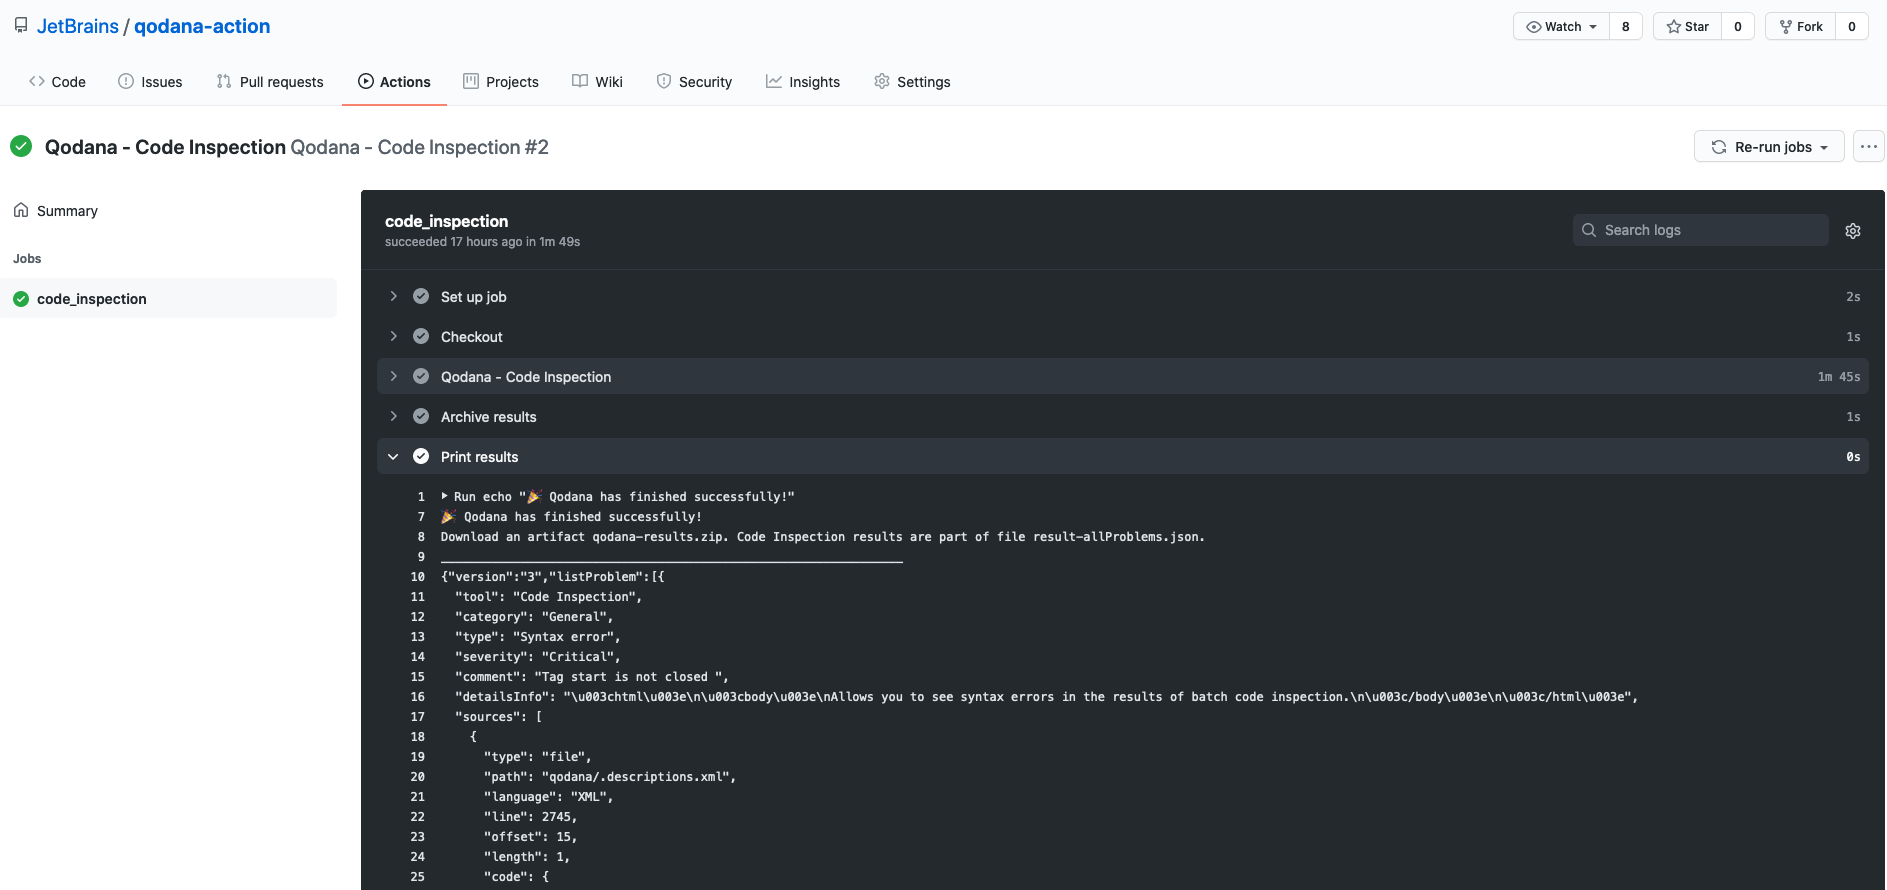
The user guide describes a simple, fully functional GitHub Actions workflow that uses the Docker image. Integration into other CIs can be achieved in a similar manner. You can control the execution by providing conditions via qodana.yaml and pass the results in JSON format to the next steps in your pipeline.
GitHub Application
We are working on a GitHub Application that will provide checks for pull requests in the repository where it is installed.
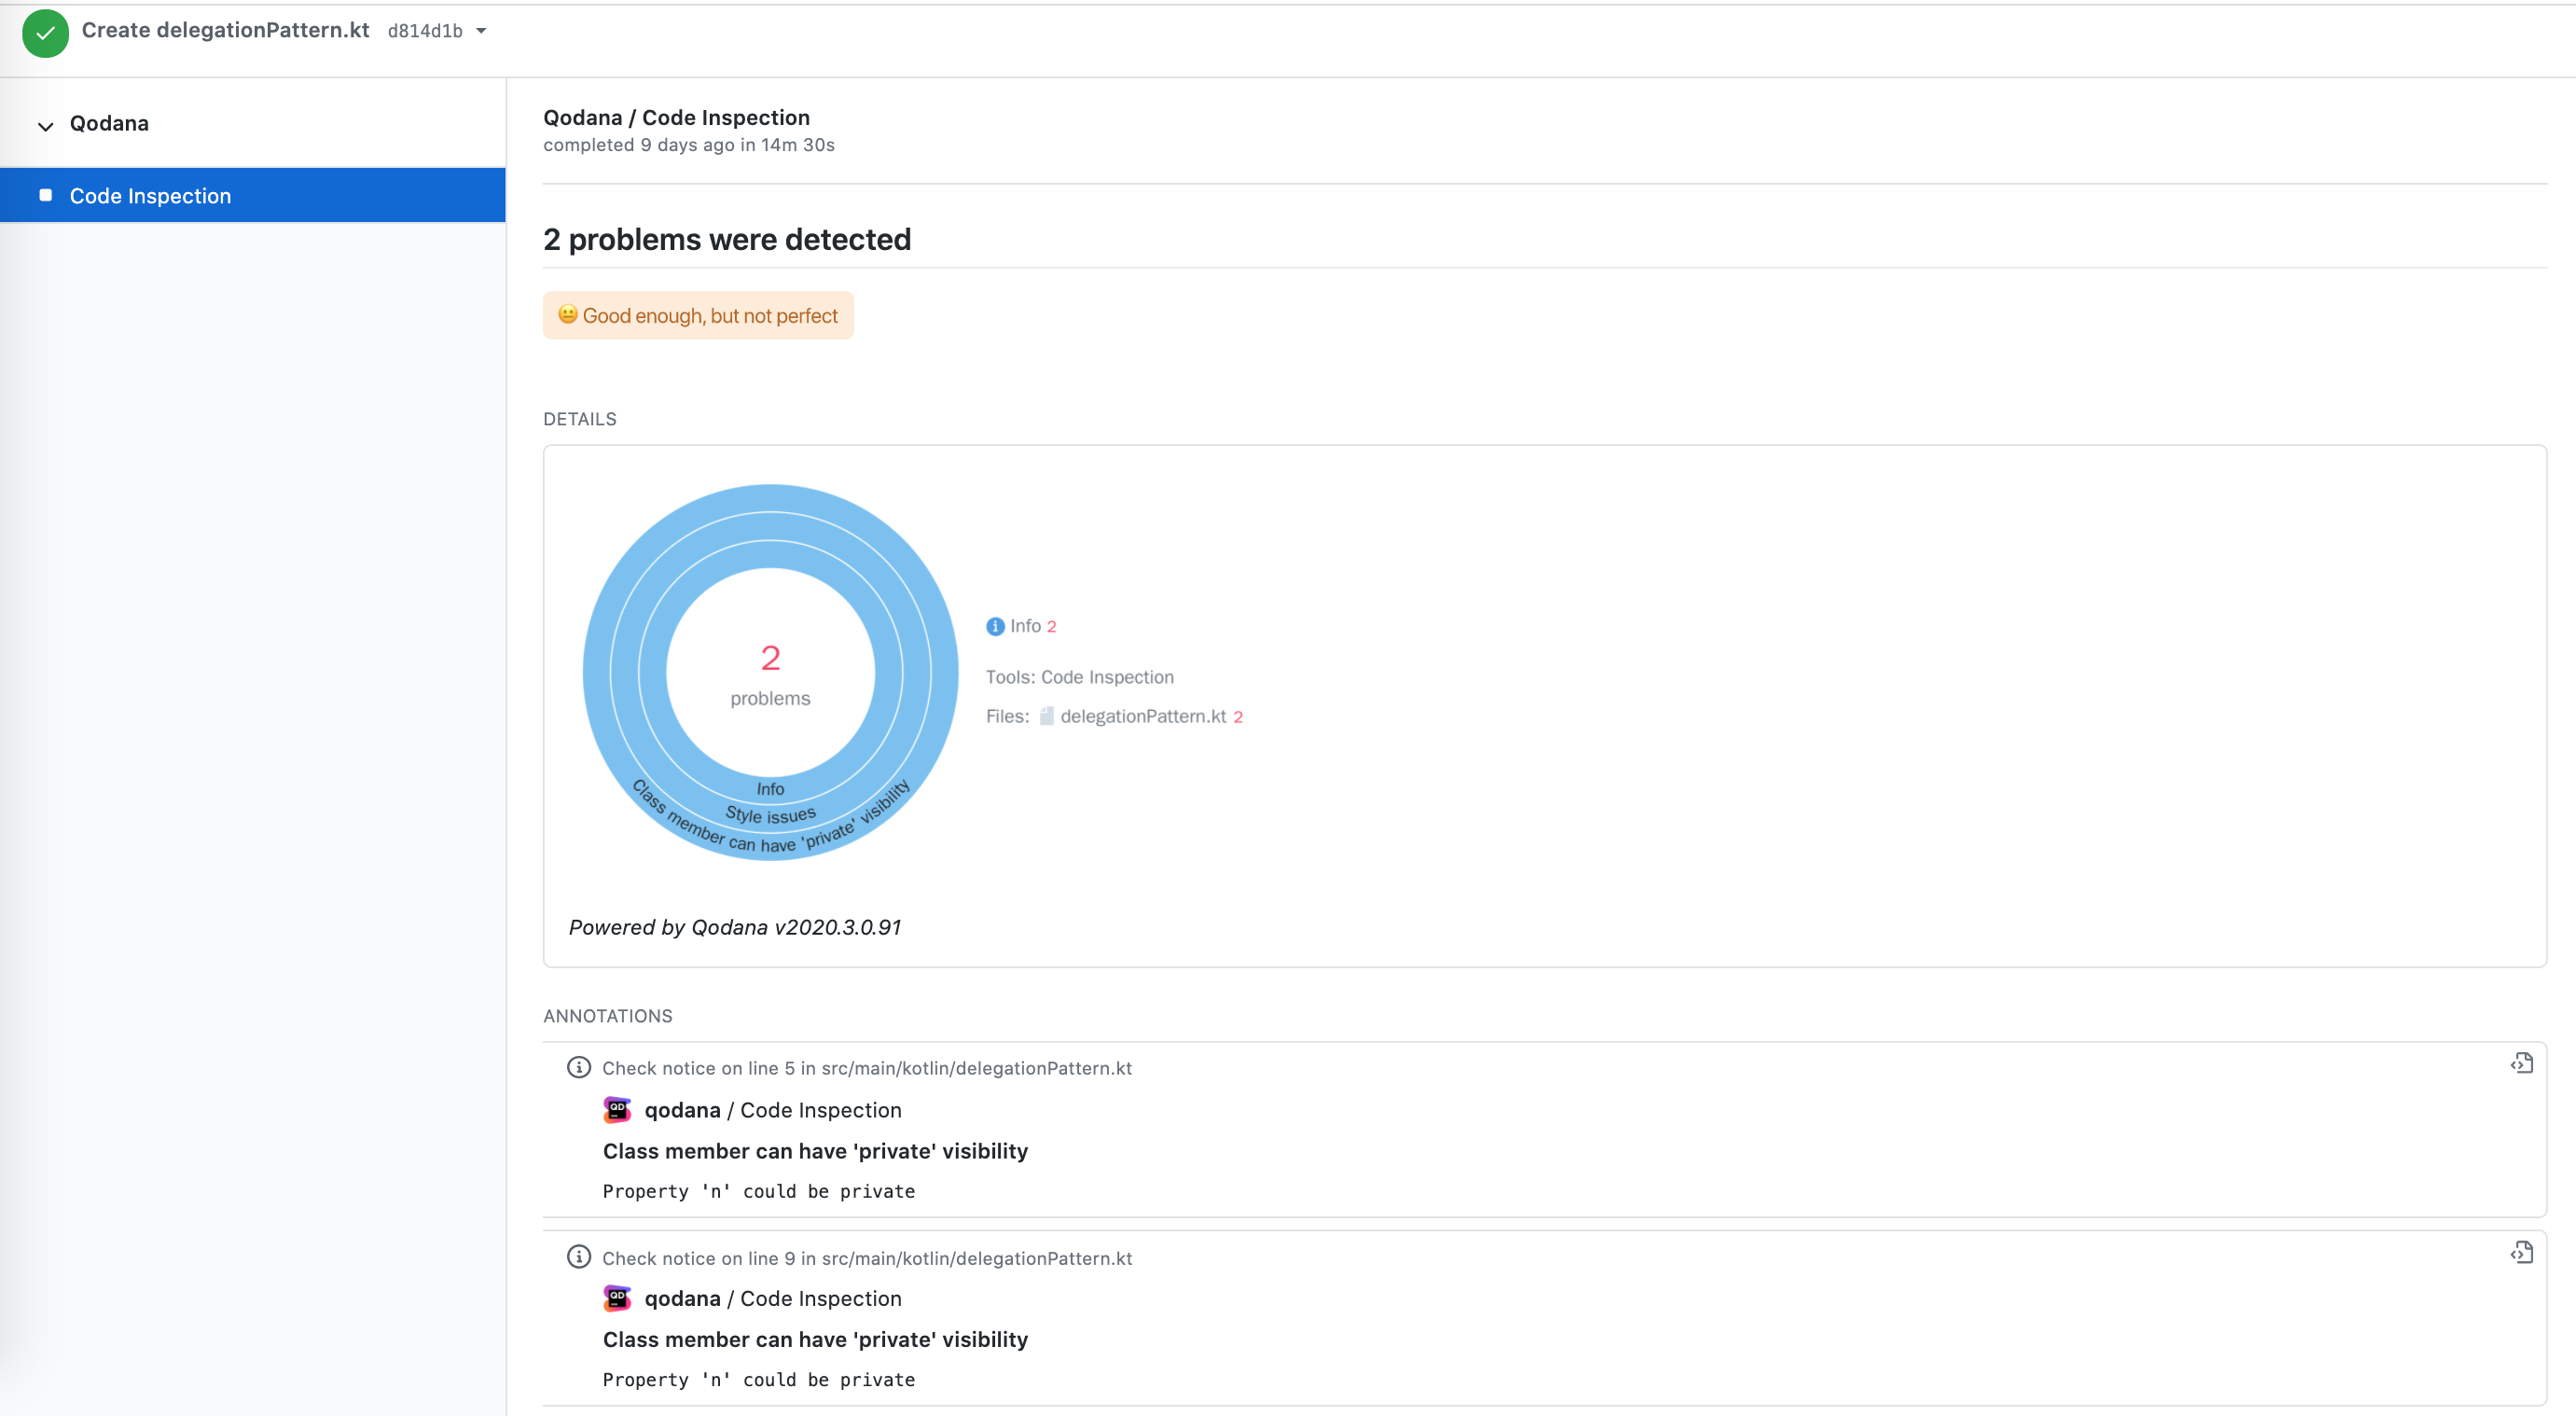
The screenshot above shows the Qodana result preview integrated in the GitHub checks sections.
At the moment the application is working in a couple of JetBrains repositories: IntelliJ IDEA Community and IdeaVim plugin. If you want to have Qodana checks in your own GitHub repository, you can read how to do so in our user guide.
TeamCity
If you have your own on-premises installation of TeamCity, you can install the Qodana plugin from JetBrains Marketplace. After extending your build with Qodana, you’ll get the following capabilities:
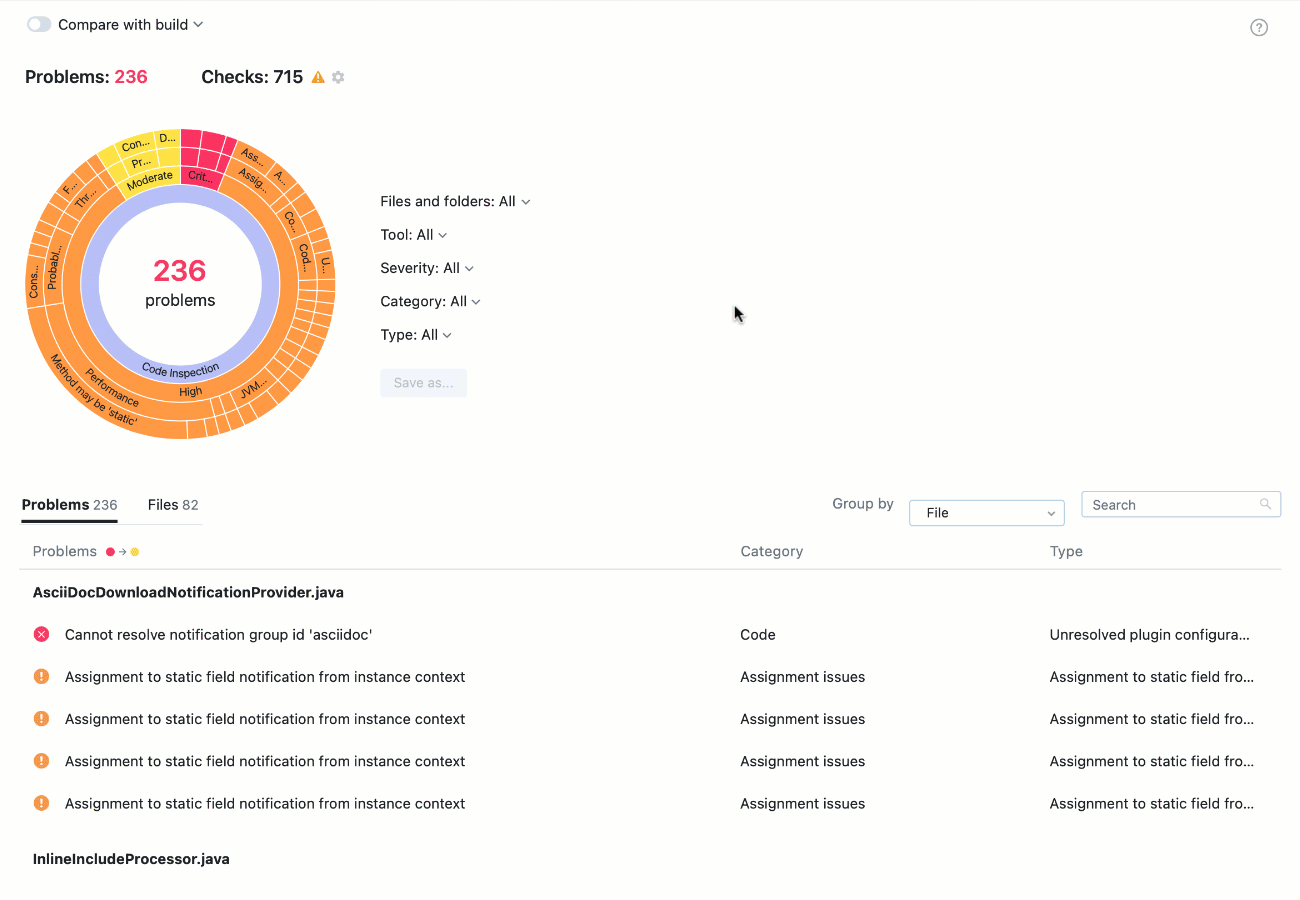
- An interactive report in a separate build tab.
- Compare problems and checks applied between builds.
- Report any problems discovered as standard TeamCity tests so that you can assign investigations to the appropriate team members.
- Use flexible build failure conditions.
- View aggregate statistics for static code analysis metrics.
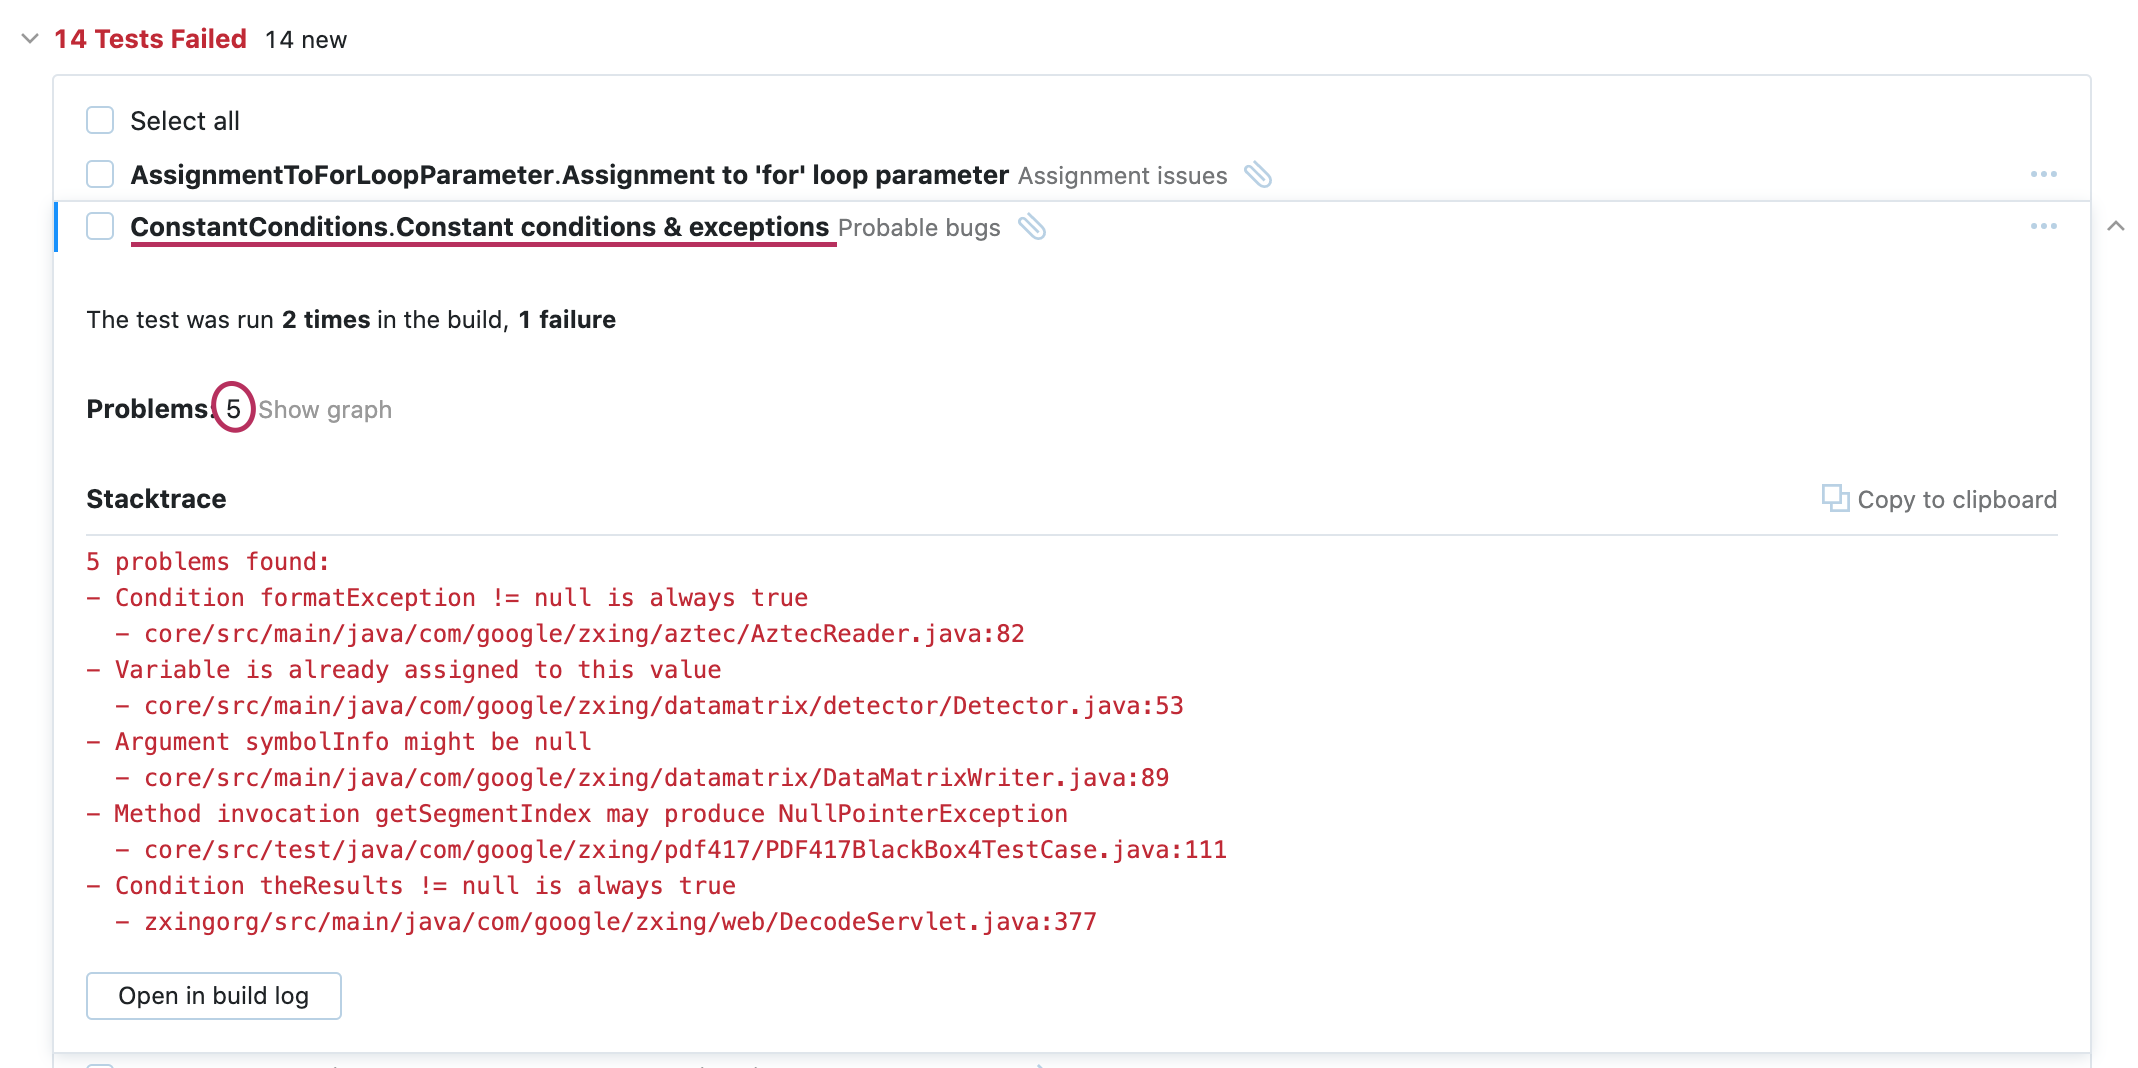
The screenshot above shows a report for failed inspections grouped by type. In this example, 5 problems related to Constant Conditions & Exceptions were grouped together. You can also choose grouping by file or module, or create a separate assignable failed “test” for every problem that is found.
Read more about the Qodana TeamCity plugin in the user guide.
TeamCity Cloud
If you don’t have TeamCity yet but would like to give it a try, you can quickly and easily create a TeamCity Cloud instance. Once you have one, contact us at qodana-support@jetbrains.com and we will install the latest version of the Qodana plugin in your instance.
What’s next?
We are working on a public roadmap to let you see in advance where things are going. Right now we’re working on polishing all the features described above and developing many more, for example, revision/branch comparison, high-level quality targets, an inspection profile exchange, cross-project analysis for code duplication, third-party license monitoring, and security checks including taint analysis.
Try it now
JetBrains Qodana is now available under an Early Access Program (EAP). During the EAP users will have full access to Qodana Docker, Qodana TeamCity Plugin, and Qodana GitHub Application free of charge. While we try to keep EAP releases stable, they have not undergone the same degree of testing as a full public release. There can be flaws and there will be rapidly evolving changes in the UI and configurations.
Detailed instructions on how to start using Qodana are available in our documentation. We will be grateful for any feedback, and any ideas are welcome! Contact us at qodana-support@jetbrains.com or via our issue tracker.
Your JetBrains Qodana Team
The Drive to Develop