IntelliJ IDEA
IntelliJ IDEA – the Leading IDE for Professional Development in Java and Kotlin
5 Best Features for Profiling Java Code in IntelliJ IDEA

When it comes to apps functioning efficiently, there is always room for improvement. Fast, lag-free, smooth operation – what else can a Java developer dream of?
However, when you aim for this level of perfection in your app, you will need a comprehensive toolset to monitor performance and identify problems for further analysis. That’s where profiling tools come in handy. IntelliJ IDEA has a built-in profiler – the IntelliJ Profiler, which combines the power of several of the most popular Java profilers. You can even run it on your project without leaving the IDE.
First things first
We advise that you get acquainted with the supported Java profiling tools with a general overview. The dedicated page describes:
- How to begin profiling
- What views to use for analyzing the profiling results
- How to share these results with your team
Also, it includes an introductory video that helps you get acquainted with the tools, demonstrates the configurations and various ways to run a profiler, and how to interpret the results.
Start profiling with IntelliJ IDEA
Top 5 supported features
We’ve already published some useful materials and how-to’s that can help you get started working with the integrated Java profiler. In this blog post, we’ve gathered together some of the most prominent features that will let you use the IntelliJ Profiler efficiently.
Easy run – fast results
Irritating issues, such as spikes in memory consumption, require troubleshooting as fast as possible. Fortunately, in IntelliJ IDEA you can start detecting such problems by running profilers with just one click. You can choose one of two equally simple ways to do so:
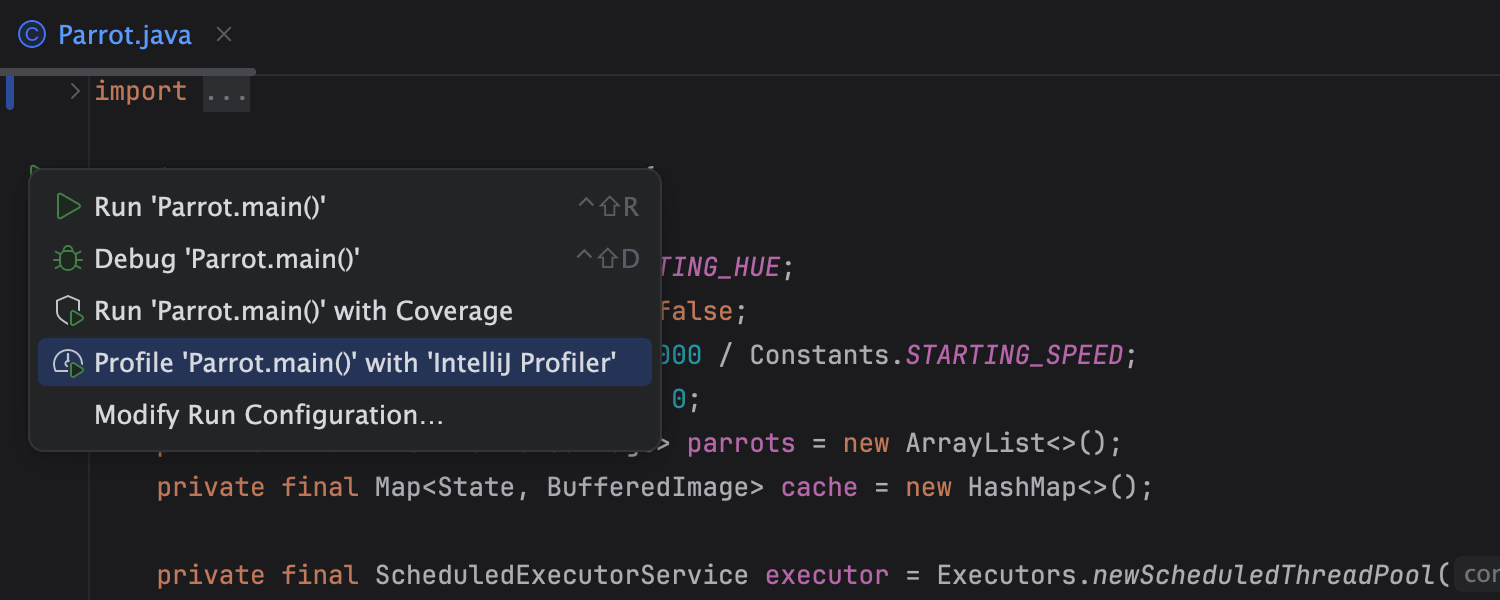
You can start the profiler by clicking the Run button in the gutter and selecting Profile with ‘IntelliJ Profiler’:
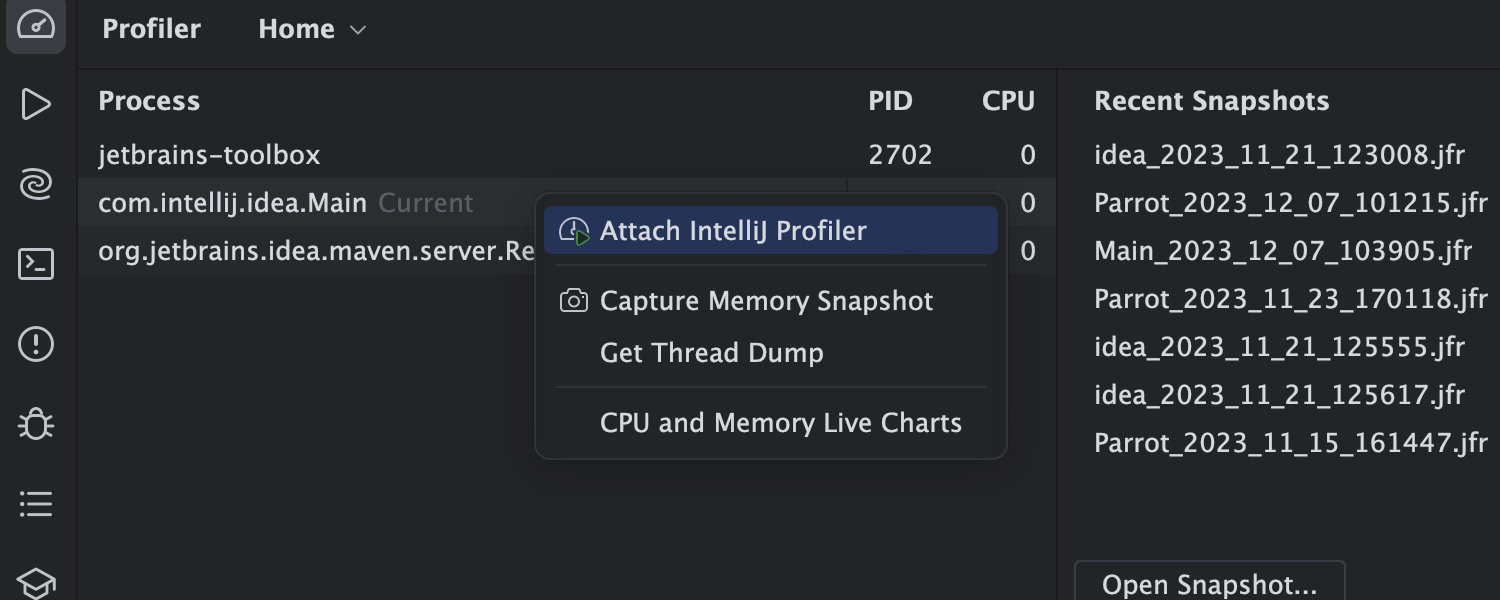
If you work in the Profiler tool window, you can pick the desired process, click on it, and select Attach IntelliJ Profiler:
Once you initiate the profiling process, you can stop it at any moment. The IDE will display the profiling results immediately and let you analyze the problems right in the editor.
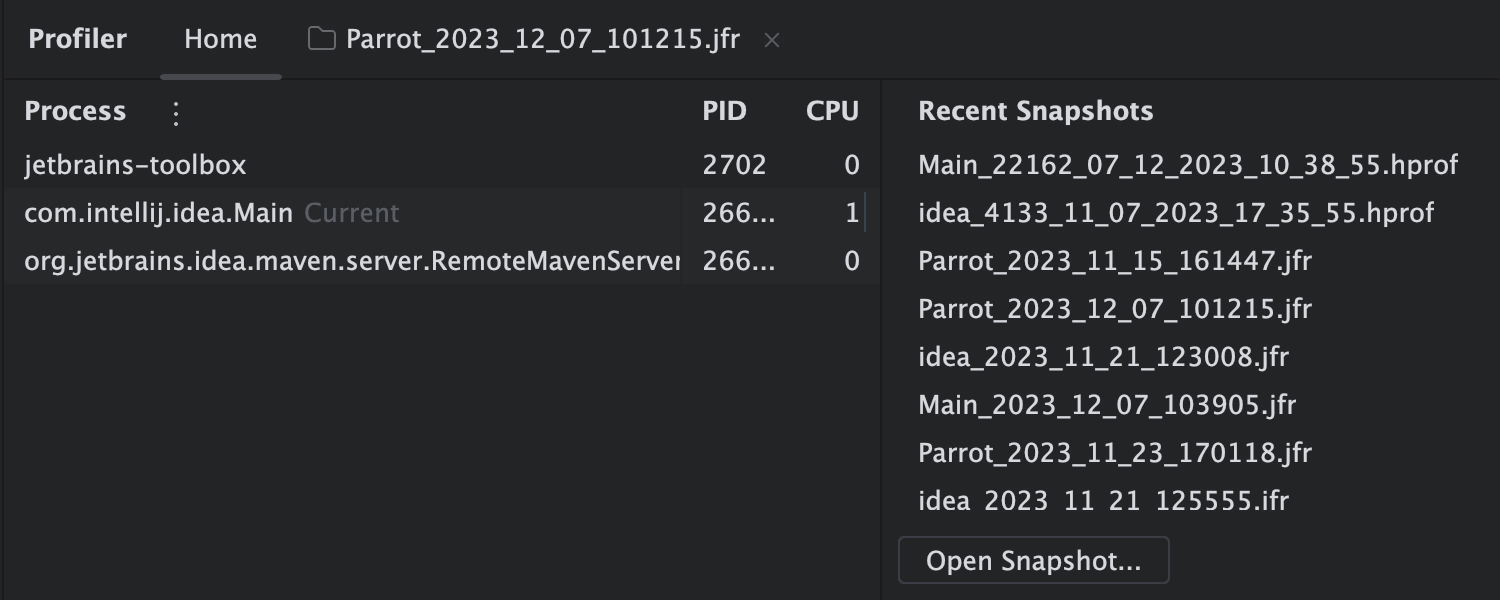
Revising the existing .jfr and .hprof files is very simple too. To open any file of these types quickly, drag and drop it in the editor, open it with File | Open, double-click it in the Project view, or select it among the Recent snapshots listed in the Home tab of the Profiler tool window.
Results visualization
We provide a range of tools that allow you to thoroughly analyze the profiling results that you get after attaching the profiler to a running process, including a flame graph, call tree, method list, timeline, and events.
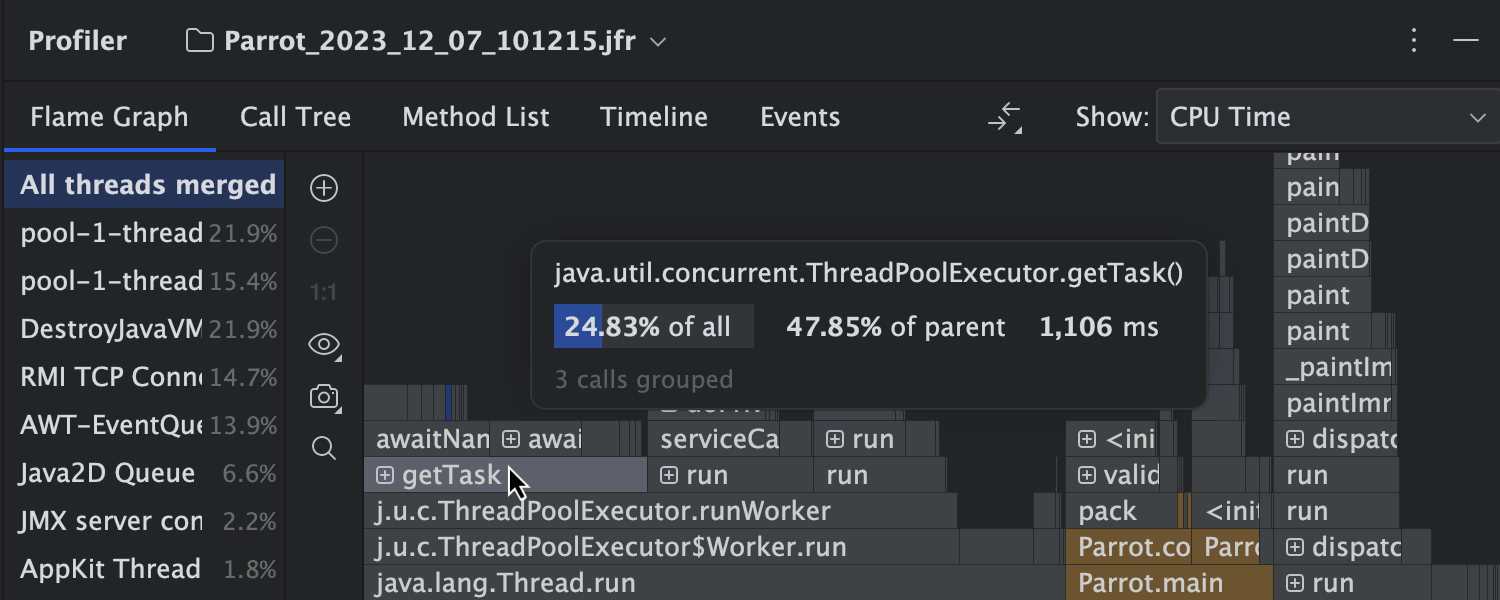
The flame graph is probably the most informative and convenient way to interpret your Java program’s CPU usage. Each rectangle stands for a stack frame. Colored blocks represent native, library, and project code. The more time a stack frame takes, the wider the dedicated rectangle becomes on the flame graph. This allows you to evaluate CPU usage and memory resources easily.
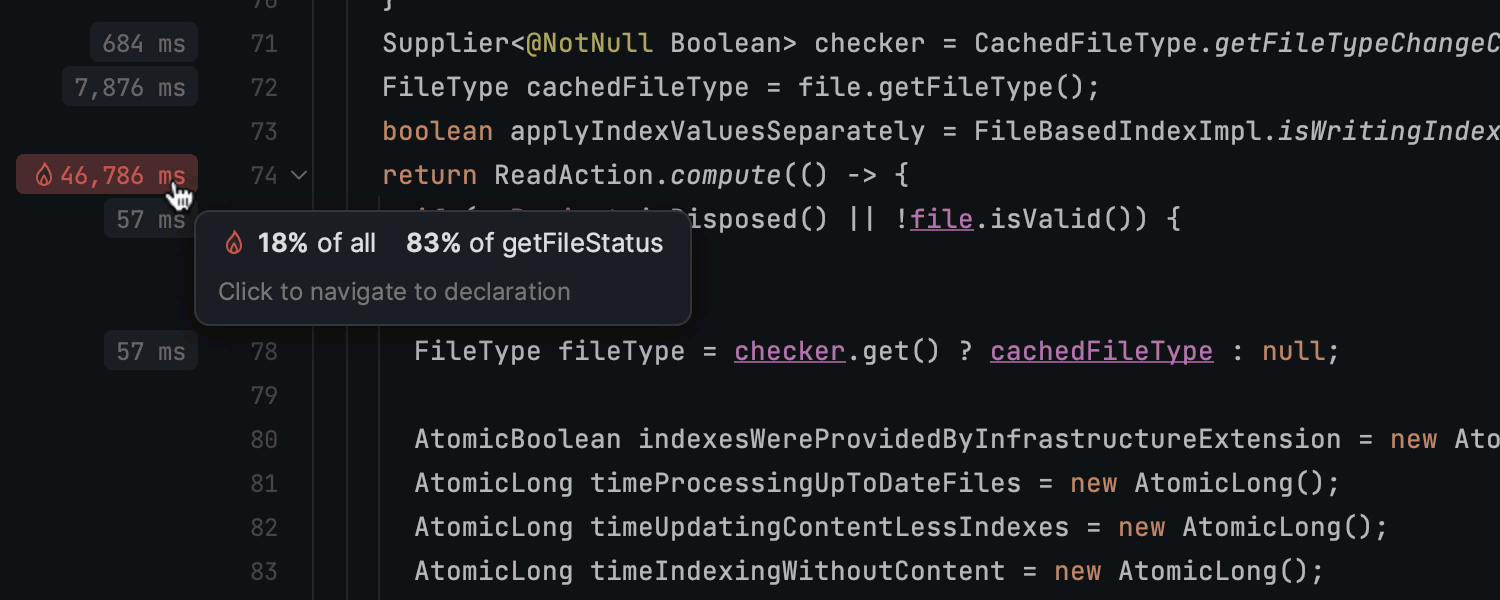
The flame graph comes with some options that simplify working with it. For example, once you hover a mouse over each stack frame, you see a tooltip that shows a method name, percentage of the parent sample time, and percentage of total sample time.
It is also possible to zoom the graph with the help of the plus and minus icons and drag it to move to the desired stack frame.
Among other handy options is fast navigation to a particular method on the flame graph. Just start typing its name in the search bar, and the IDE will highlight the relevant results. You can easily browse through all of them with the help of the up and down arrows. There is also a filter that allows you to search the whole flame graph or just in a specific subtree.
When you find the necessary method, you can review it in the editor. Just right-click on it and select Jump to Source.
.jfr snapshots’ comparison
You can compare .jfr snapshots right from the IDE. Why might you need this? It can be helpful to check whether the applied changes improve or degrade your app’s performance. This comparison is very convenient because it provides quick results and lets you make a fast yet reasonable decision to roll back the changes if your code improvement theory proves wrong.
To compare the .jfr snapshots, open two snapshots and navigate to the one you’ve taken after applying your changes. In the top-right corner of the top pane, click the diff icon and select the snapshot you’ll use as the baseline. You will then see the result in the form of a flame graph, call tree, or method list.
Combined power of the CPU and Allocation profilers
IntelliJ IDEA’s profiler has out-of-the-box support for Async Profiler. When you decide to profile your Java code with Async Profiler, it means that you simultaneously attach the CPU and Allocation profilers to the running process. And so, you combine the power of the two by clicking just one button!
After you run your program with the IntelliJ Profiler, the results in the Flame Graph, Call Tree, and Method List tabs are available both for CPU Time and Memory Allocations. To choose between the two, go to the new Show dropdown list and select the necessary option.
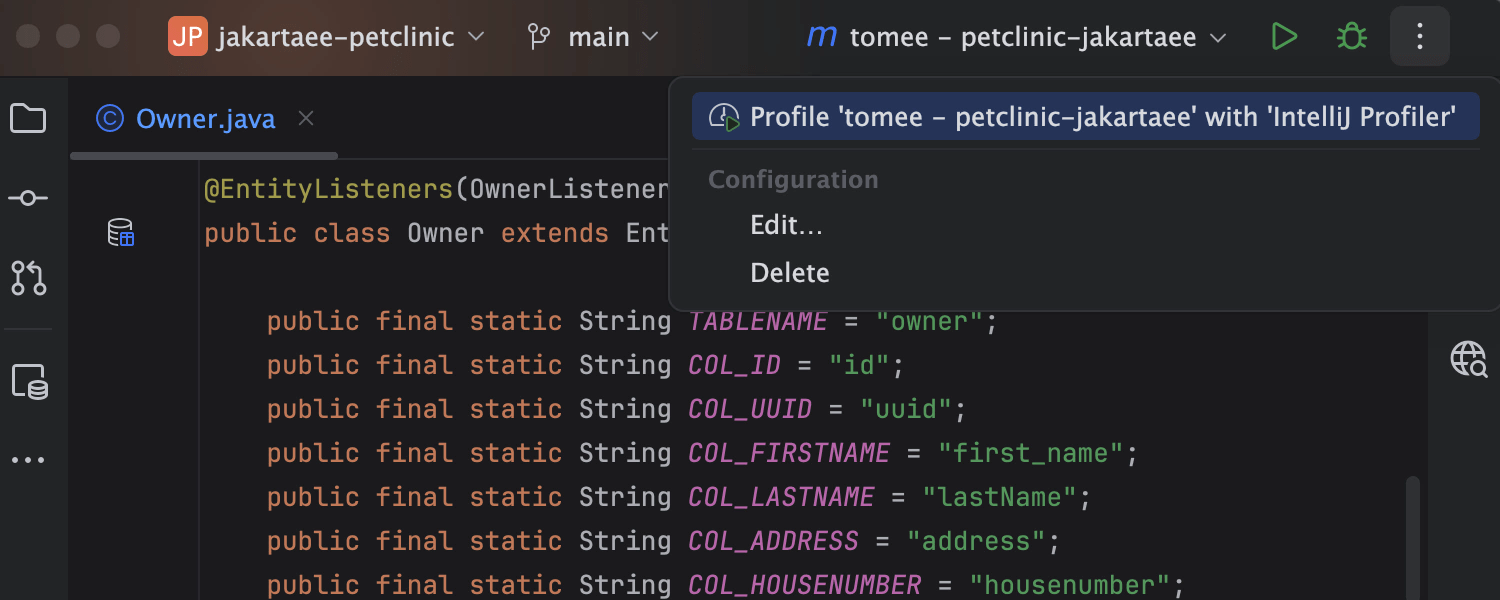
Profile configurations
In IntelliJ IDEA you can attach the profiler to the most common run configurations, including local Maven and Tomcat run/debug configurations. To profile them, select the necessary configuration, click the three-dot menu in the top toolset pane, and select Profile with ‘IntelliJ Profiler’.
These were the most useful and powerful features that IntelliJ IDEA offers for profiling Java applications. We recommend you try them out and share your feedback in the comments or in the issue tracker. It will help us better support profiling tools and make your program’s memory consumption more efficient.
Happy developing!