IntelliJ IDEA
IntelliJ IDEA – the Leading IDE for Professional Development in Java and Kotlin
Smart Step-Into for Microservices Debugging

More and more development teams are adopting microservice architecture and are facing new challenges. It can be difficult to diagnose failures in a distributed system, and new solutions are required when testing and developing components that rely on other services. We’re announcing an experimental plugin for IntelliJ IDEA – Smart Step-Into for Microservice Debugging. It simplifies the process of debugging microservices with the enhanced Smart Step-Into action available in HTTP files and Java/Kotlin code.
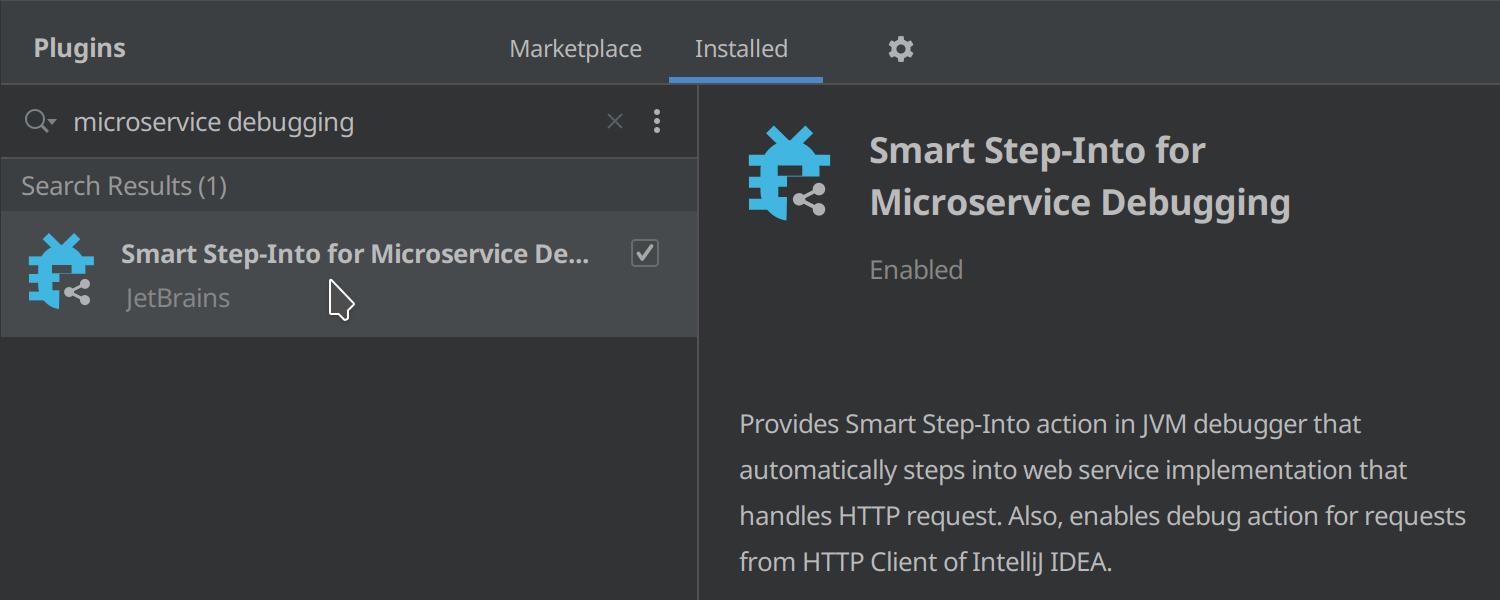
Please note that this plugin is not bundled, so you’ll need to install it before using this new functionality. Go to Preferences | Plugins | Smart Step-Into for Microservice Debugging plugin, or download the plugin from the website. The plugin is only compatible with IntelliJ IDEA Ultimate 2021.3.1+. Let’s see how it works!
Running HTTP requests with a new action
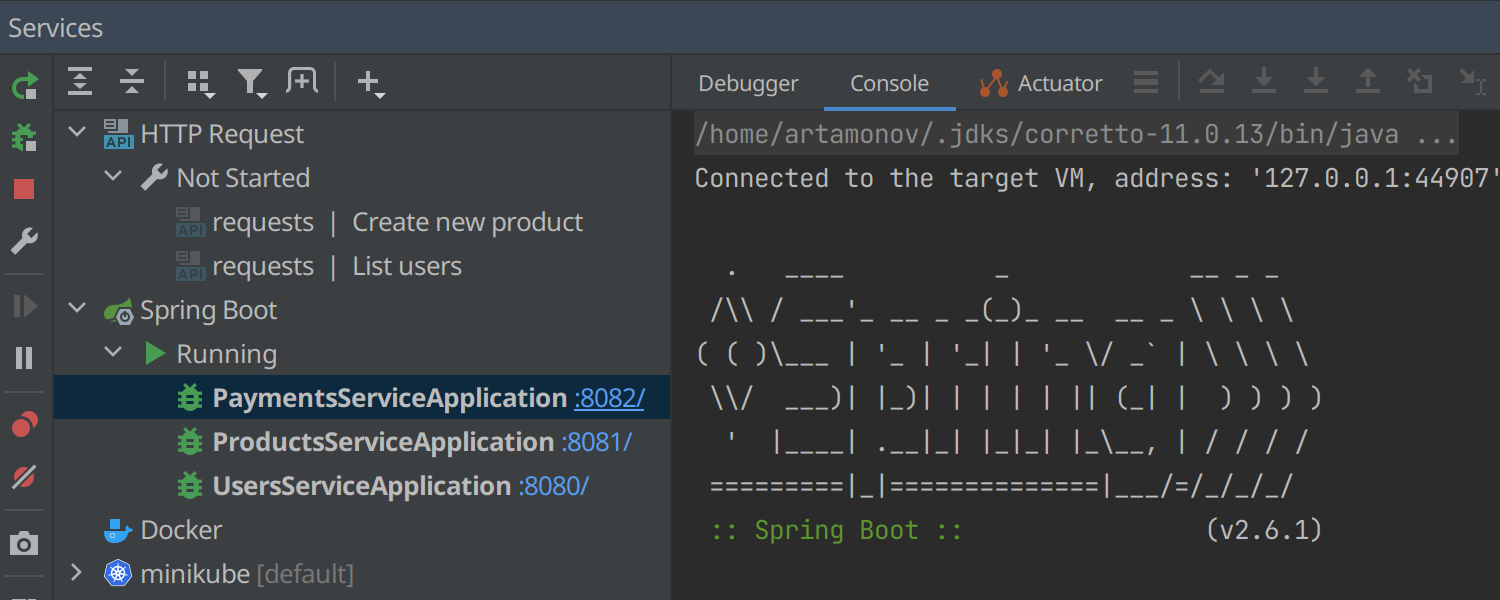
Our example application consists of three services based on Spring Boot: Users, Products, and Payments. We can run them all together using the Services tool window. As you can see in the screenshot, they are running with different ports locally, but you can also run them on remote machines with the Run targets feature via SSH or Docker. The only requirement here is that they be running with the Java debugger attached. Don’t forget to start all of your services in debug mode if you want to try this functionality.
Let’s suppose we want to trigger some business logic of the Users service and jump straight to its source code in order to further debug the request handler. In this project, we have the requests.http file with all common HTTP requests we use to test our application manually. This file format is supported by HTTP Client, a convenient tool for web service testing available in IntelliJ IDEA. Open the requests.http file and click on the run line marker for the http://localhost:8080/users request. Here we will see the new available action – Run and Step Into Handler.
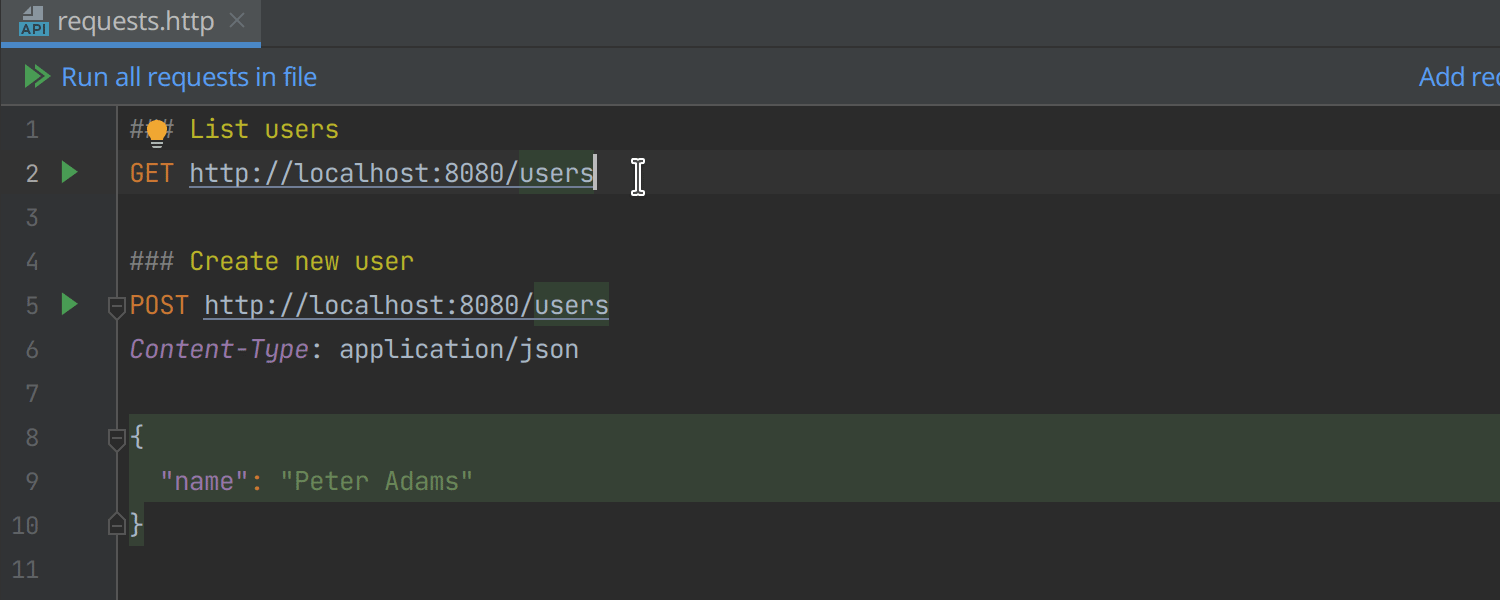
Try it out and see what happens. The debugger will find the service defining a request handler for /users URL, automatically set up a breakpoint at the method entrance, and then run the HTTP request. And the rest goes according to plan: The request hits this endpoint and the Users service is paused at the breakpoint. It’s that simple – trigger any HTTP request and magically navigate to the service declaration that handles the request!
Debugging service-to-service requests
Of course, not every service is exposed to the end user and most of the interactions in our distributed systems happen between two backend services. How do we see where our request goes when we use client APIs such as Spring WebClient or Spring Cloud OpenFeign?
This case is also covered. When we stumble upon code that may send requests to other services, the plugin will show us a special line marker:
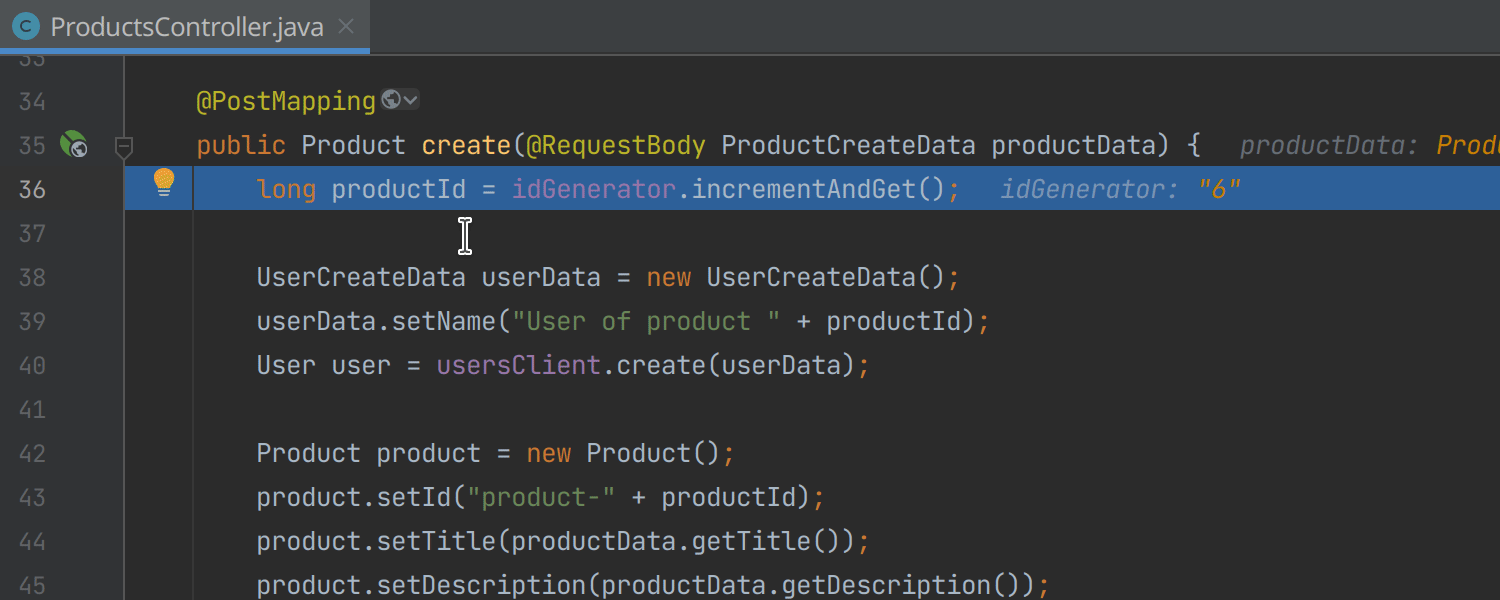
Stepping through the code of the Products service, we can see that it calls the Users service. Then we decide to step into the Users service implementation and click on the line marker. The IDE automatically sets up the breakpoint for us in the Users POST handler and resumes the execution. Voila! We have navigated to the Users handler.
We haven’t added any breakpoints manually. The breakpoint in the Users service has been added automatically by the line marker action. This example uses the declarative HTTP client provided by Spring Cloud OpenFeign. This is not the only supported scenario – we could also use the same flow for Micronaut HTTP Client or Spring WebClient:
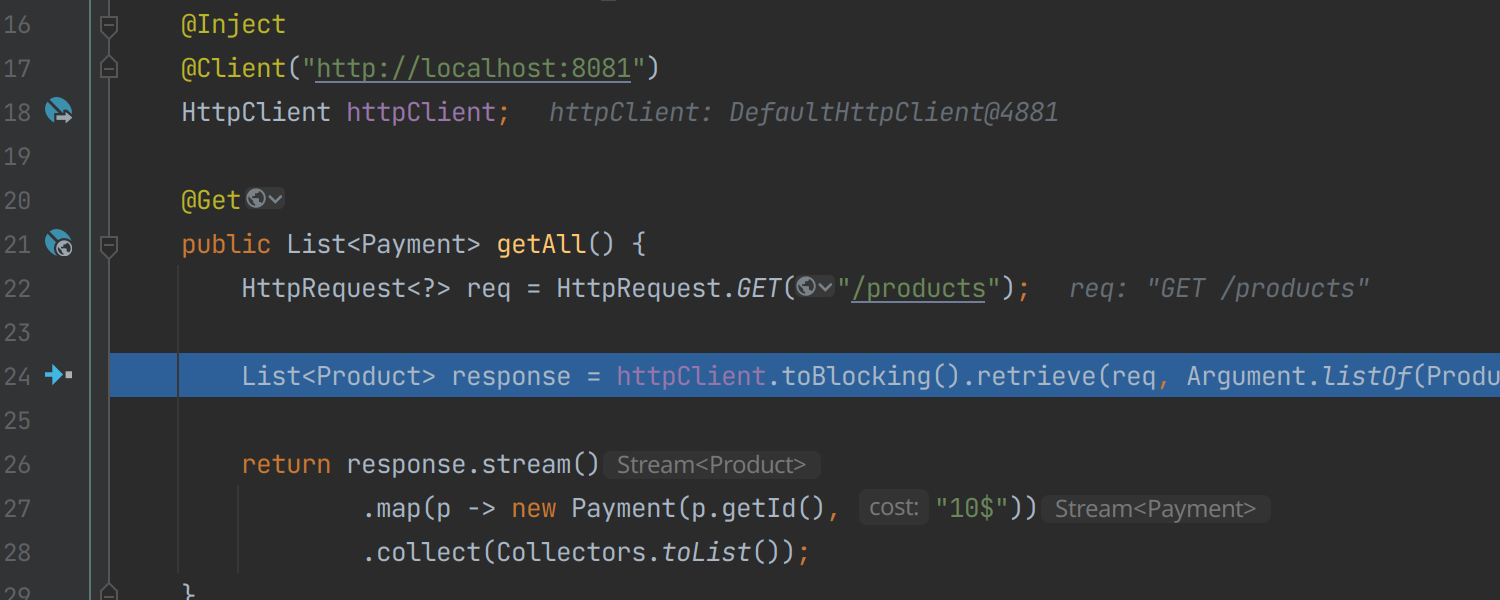
In this example we see Micronaut HTTP Client usage where the IDE has detected an external call, and it shows us the transition line marker.
How it works
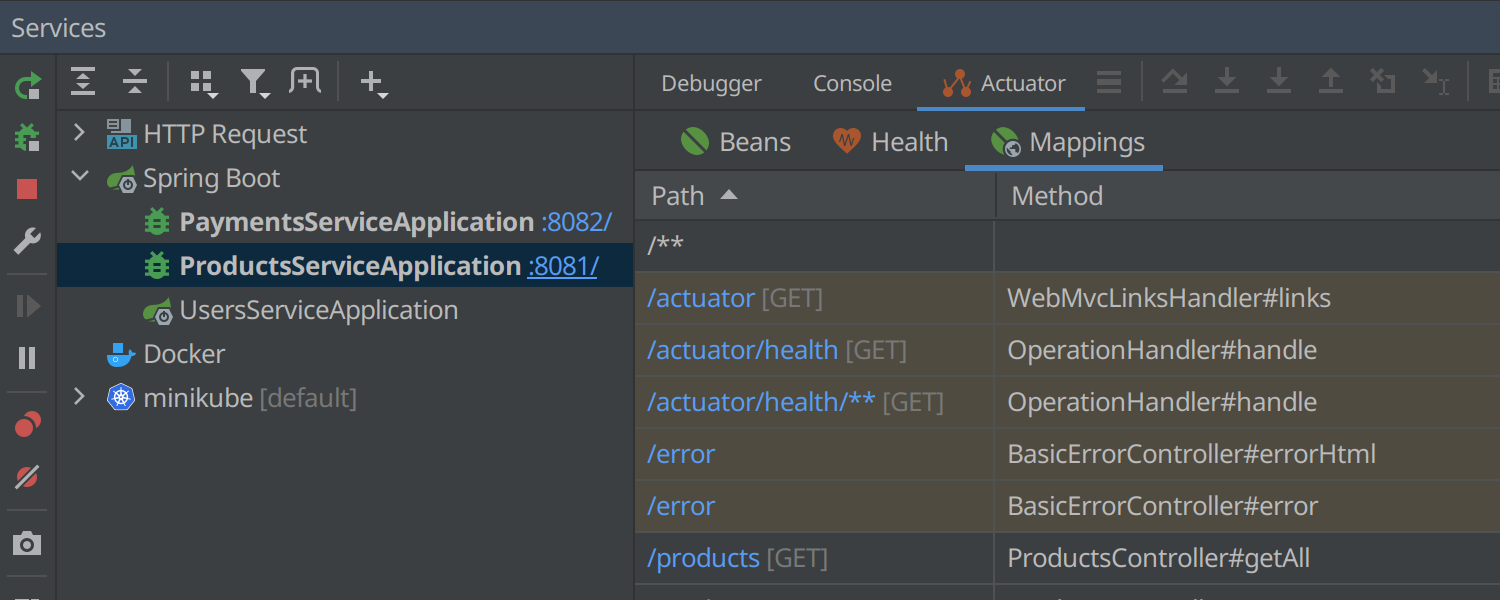
All of these actions are based on the existing URL search functionality available in IntelliJ IDEA. You probably know about the Endpoints tool window and references in code that provide Go to Declaration and Find Usages for URL mappings, but if not, you can read more about them in our blog post. The debugger also takes into account Spring actuator endpoints when they are available to find the target service via exposed Spring MVC mappings. You can see the exposed Spring MVC mappings using the Actuator tab of the running application. Usually, navigation via the gutter icon is more accurate when the Spring actuator is enabled for a service.
Supported technologies and limitations
Sometimes, you may see the following message from the debugger:
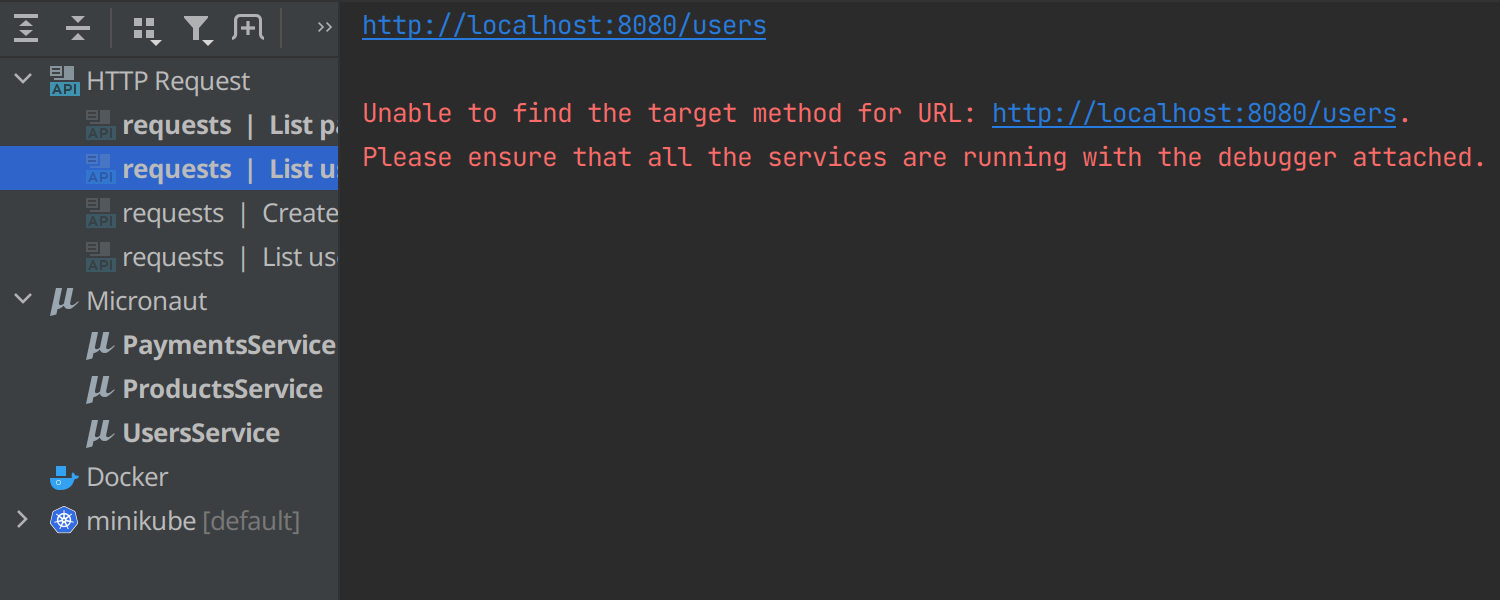
This message is shown because the plugin requires the JVM debugger and works only with Java and Kotlin code. Not all JVM frameworks are supported – it only works with Spring Boot and Micronaut HTTP servers, Spring Web Client, Spring Feign Client, and Micronaut HTTP Client for now. This is just the beginning, and we are going to expand this to many JVM frameworks in the future.
In fact, this feature is suitable for more than just microservices. If you have a standard monolithic web application and just want to use convenient navigation to the URL handler on HTTP request, give it a try! You don’t need the microservices architecture to use it.
Please tell us in the comments below which JVM frameworks you use. What do you think about this feature? Could it simplify debugging for you?
Happy Developing!