IntelliJ IDEA
IntelliJ IDEA – the Leading IDE for Professional Development in Java and Kotlin
Debugger Upskill: Basic and Advanced Stepping

This Debugger Upskill blog post is the first in a series devoted to the IntelliJ IDEA debugger. In the upcoming articles, we’ll describe its core functionality as well as features designed for peculiar use cases.
Our topic for this post is stepping, an invaluable procedure that allows you to move along your code to analyze it and find problems. We’ll explore how basic and advanced stepping actions help you use the IntelliJ IDEA debugger more efficiently.
To start stepping, you must either pause an ongoing debugging session or let the program stop at a breakpoint. When you are ready, you will see that the basic stepping actions, which are displayed as arrows, become active in the top pane of the Debug tool window.

Basic stepping
These actions allow you to step line by line through the code to inspect it.
Step Over
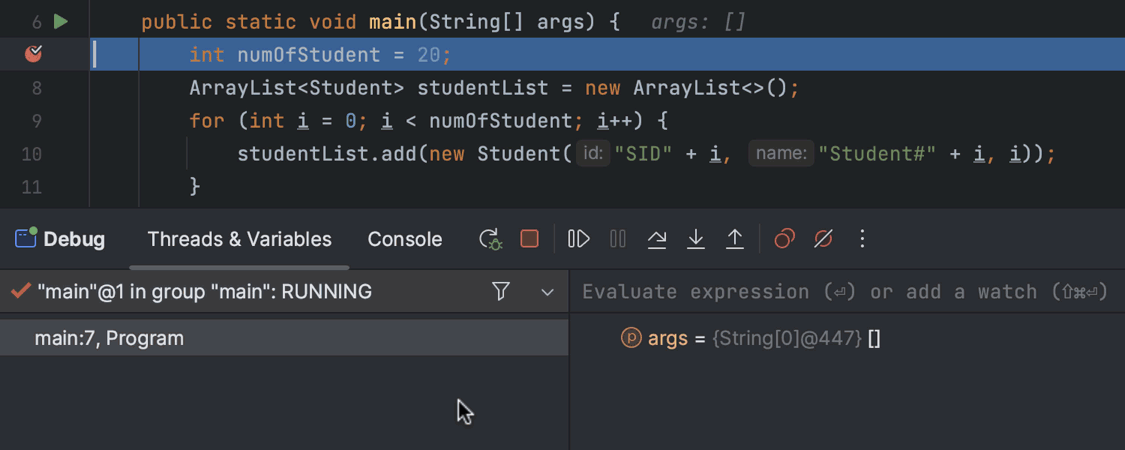
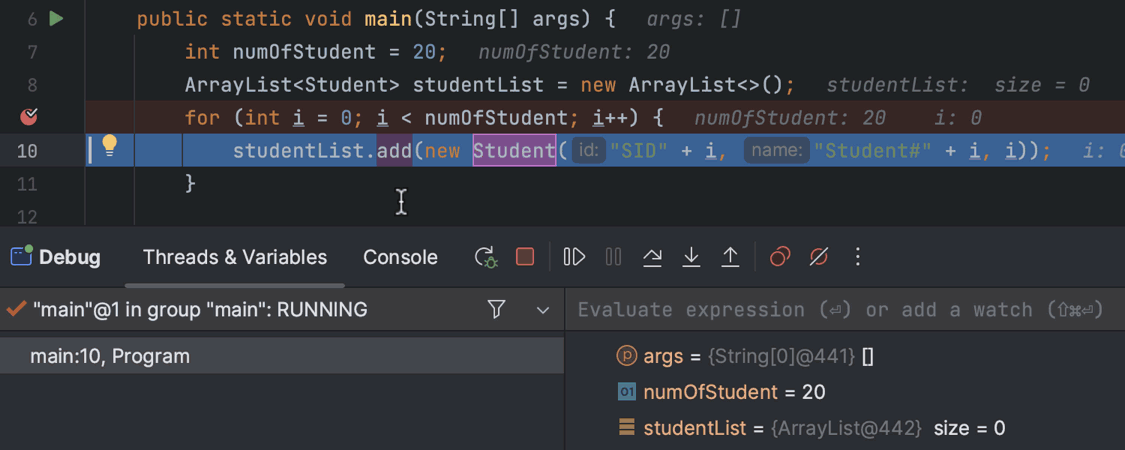
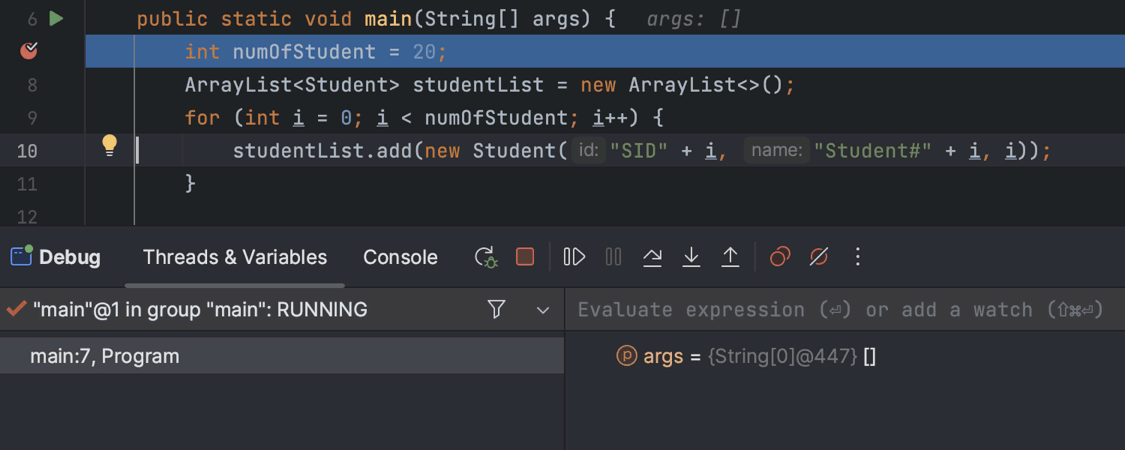
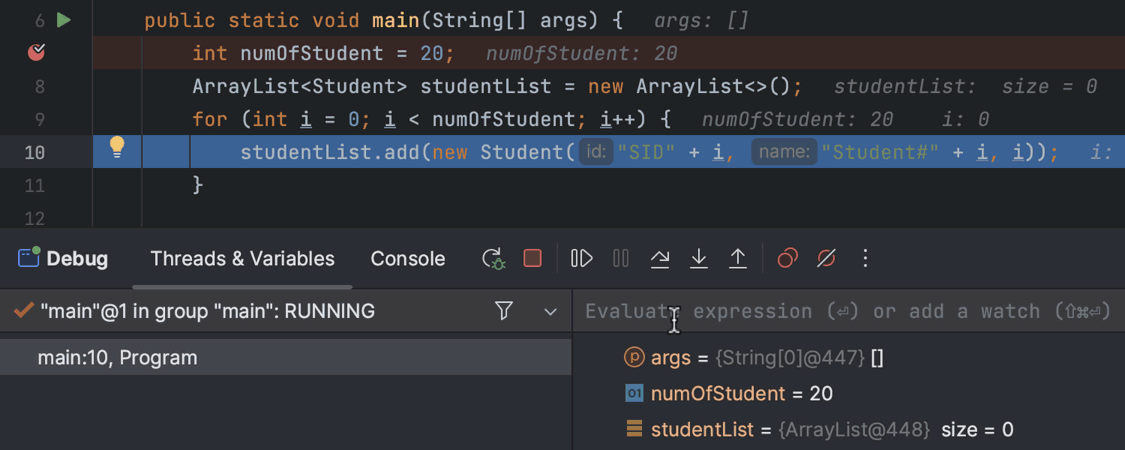
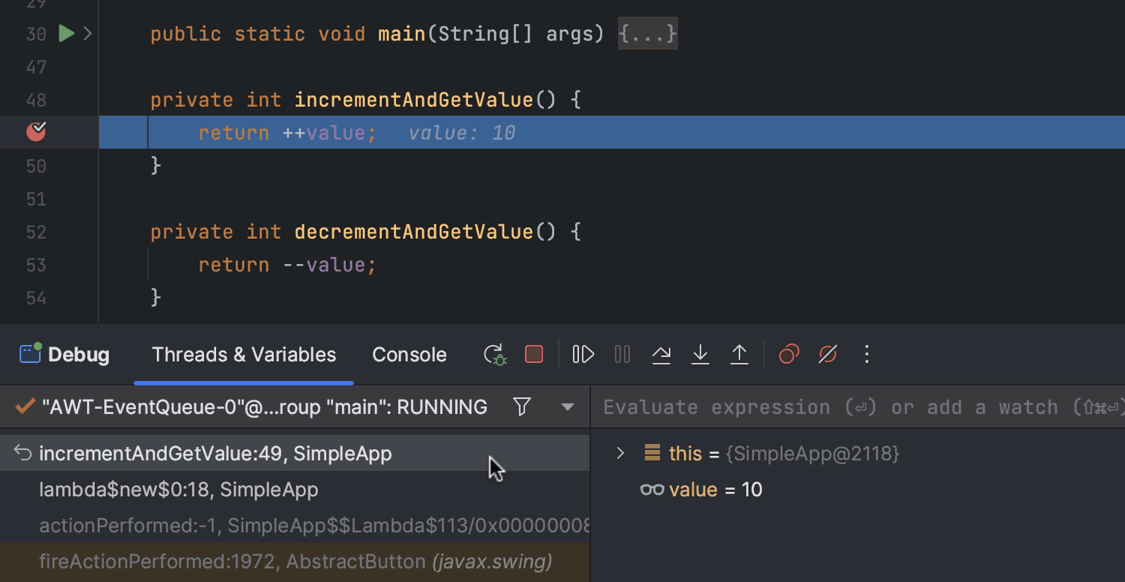
This is the most straightforward step, as it lets you jump to the next line of code without stepping into any methods. With it, you can analyze your code line by line and then see the results in the Variables pane of the Debug tool window.
Let’s step over the lines in our file and see how the variable values appear in this pane. To do so, click the first of the arrow buttons in the Debug tool window or simply press F8.
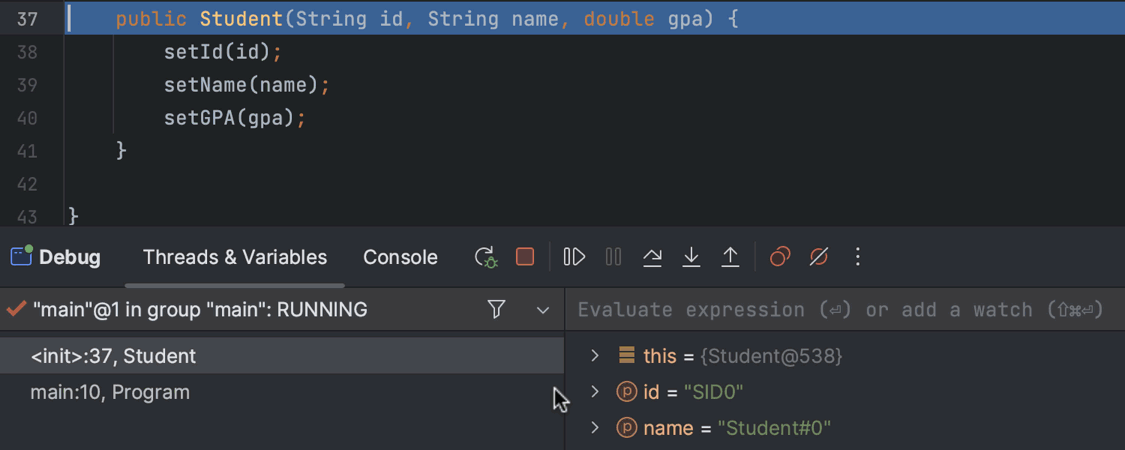
Step Into
If you encounter a method along the way and think it might be a good idea to enter it and check its execution, you can use the Step Into action. To try it out, click the second arrow in the top pane of the Debug tool window or press F7.
If one line of code contains several method calls, you don’t need to enter them one at a time until you reach the one you are interested in. IntelliJ IDEA allows you to step into any method on the line with an action called Smart Step Into that will automatically be performed when Step Into (F7) is executed on the line with several method calls. You will see that rectangles appear around the method calls. You can move along the code with the help of keyboard arrows or the Tab key and press Enter when the desired method is framed. Alternatively, it is possible to simply click on the method.
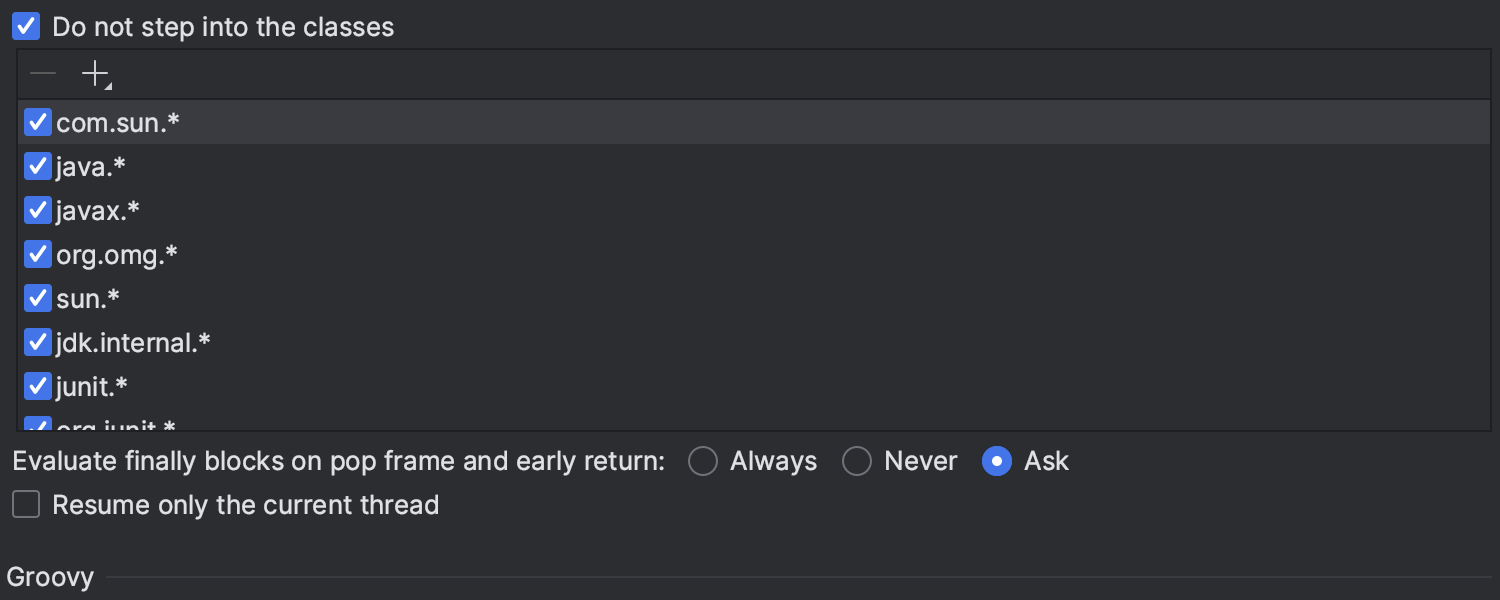
There may be methods you want to avoid stepping into. You can configure the IDE’s behavior for such cases in Preferences/Settings | Build, Execution, Deployment | Debugger | Stepping.
Step Out
When you’ve finished examining a method you stepped into, you can get out of it with the help of the Step Out action, which you can invoke by clicking the up arrow in the tool pane of the Debug tool window or by pressing ⇧ F8 (macOS) or Shift+F8 (Windows or Linux).
Run to Cursor
If you don’t want to run line-by-line code analysis and need to jump to a line that is far away, Run to Cursor is the stepping action for you. It allows the program to continue its execution until it reaches the caret, which can be in another method or even a different file.
To try this action out, press⌥ F9 (macOS) or Alt+F9 (Windows or Linux).
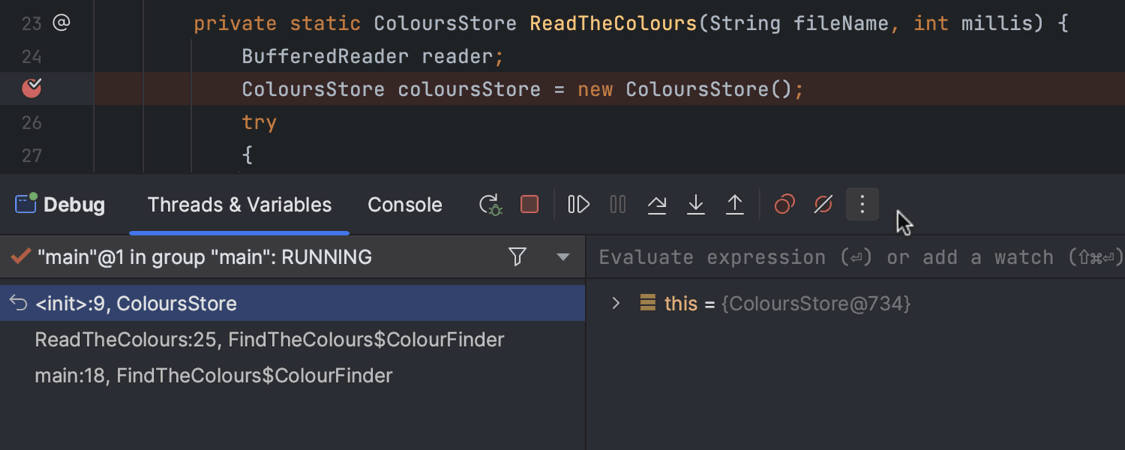
Reset Frame
Imagine you’ve stepped through the whole method and now find yourself at the end, but you feel like you’ve missed something important. Here is where Reset Frame can be useful. This action brings you to the point right before the method call and resets the frame’s local variables that you’d changed inside it.
Note that if changes are made to the global state, the IDE doesn’t revert them.
To perform this action, hover over the frame you want to reset and then click the Reset Frame button that appears. Keep in mind that this step is available only for the top frame.
Advanced stepping
Here are some less conventional actions for navigating your code and testing specific scenarios while debugging.
Force Return
With IntelliJ IDEA’s debugger, you can make methods return any value you want and test how the program works with them, without having to reproduce the conditions that lead to these values. You do this with the Force Return action.
Select the current method in the Frames tab, right-click anywhere in the tab, and choose Force Return. A dialog will then appear where you can enter the desired value.
Once you apply Force Return, the debugger will terminate the current method immediately and return the specified value. Any code after the line where you forced the return will not be executed.
Throw Exception
Throw Exception allows you to throw an exception from the current line of code during a debugging session. This can be useful for testing how your code handles exceptions and for simulating error scenarios.
To use it, start a debugging session and make sure the current method is selected in the Frames tab. Then right-click anywhere in the tab and select Throw Exception.
A dialog box will appear, allowing you to choose the type of exception you want to throw. You can choose from a list of exceptions by entering the name of the exception’s class.
Once you have selected the exception you want to use, the debugger will throw it at the current line of code.
Jump to Line
We have already described this action in our blog, but we think it is impressive enough that it is worth highlighting once again. Jump to Line is a plugin that works as a supplement to the built-in stepping actions. It comes in handy when you want to jump to a particular line and set an execution point there without executing the preceding code.
Once you install the plugin, you will see a yellow arrow in the gutter that you can drag and drop to the lines that the IDE highlights in green. The program will then execute from there.
If, for some reason, you’ve stepped out of the method you need and you don’t want to rerun the program to get back to the problem, Jump to Line is an option.
We have the plugin installed, so let’s go ahead and test it on our sample code.
We encourage you to use Jump to line with care because it allows you to change the program state in an unconventional way, which can break its flow.
Summary
As you can see, stepping is a core feature of the IntelliJ IDEA debugger. Depending on the error, you can use either basic or advanced stepping actions to analyze your code and try various approaches to investigate it. We hope that these descriptions and examples will allow you to get more out of your debugging experience.
Stay tuned for more Debugger Upskills!