IntelliJ IDEA
IntelliJ IDEA – the Leading IDE for Professional Development in Java and Kotlin
Debugger Upskill: Variables, Evaluate Expression, and Watches

In our previous article, you learned to move through your code with basic and advanced stepping actions. Now that you know how to navigate your code and control its execution step by step, we can look at the tools for analyzing your program’s state and testing scenarios for bug fixes.
In this Debugger Upskill blog, we’ll show you how the examination of variables, along with the Evaluate Expression and Watches features, help you interpret the program’s behavior under various conditions.
Variables
IntelliJ IDEA’s debugger offers several ways to view variable values. You can do that in the editor or the Variables tab of the Debug tool window.
Inline values
At JetBrains, we are especially concerned with keeping you in the flow, so it is crucial that you get the majority of the information you need right in the editor.
You can view variable values right at the end of the lines where they are used or, as we say, inline. If a value changes, it is synchronized with its inline representation and highlighted in a different color.
The IDE shows inline values by default. To disable them, deselect the Show values inline checkbox in Settings/Preferences | Build, Execution, Deployment | Debugger | Data Views.
Variables tab
If you need more information, the Variables tab in the Debug tool window is an invaluable resource. It contains a list of all the variables available in the current stack frame. When you switch a stack frame on the left, the list gets updated with the values for the newly selected context.
The Variables tab shows you the values for every variable. Each object in the tab is expandable, allowing you to see its inner structure. Then, from each of them, you can jump to their declarations by pressing ⌘↓ (macOS) or F4 (Windows and Linux).
Moreover, it is possible to set the values of variables regardless of their visibility modifier to test the program’s behavior under certain conditions.
To do so, right-click a variable and select Set Value or press F2. Once you change the value, press ⏎ (macOS) or Enter (Windows and Linux).
Evaluate Expression
If the information from the inline values or the Variables tab is not sufficient, the Evaluate Expression feature may help.
It allows you to obtain extra details about your program’s state, test the outcome of potential code changes, and try out particular values for variables. These are just the most common uses. The Evaluate Expression functionality can be very handy in countless other scenarios.
Quick Evaluate Expression in the editor
The easiest way to evaluate expressions is to hover the mouse over a variable and wait for a couple of seconds. The IDE will then show you a tooltip with its value. Even if you decide to change this value, the IDE won’t execute any methods not to break the program flow.
If you are dealing with a complex object, it is possible to expand the tooltip by clicking the plus icon in the dialog that appears.
If the expression you are analyzing is complex, you can move the mouse along it to automatically expand the selection of each part.
This is when the Quick Evaluate Expression feature comes in handy.
Use ⌥Click (macOS) or Alt+Click (Windows and Linux) on a variable, expression, or selection, and the IDE will immediately show the evaluation results in the tooltip.

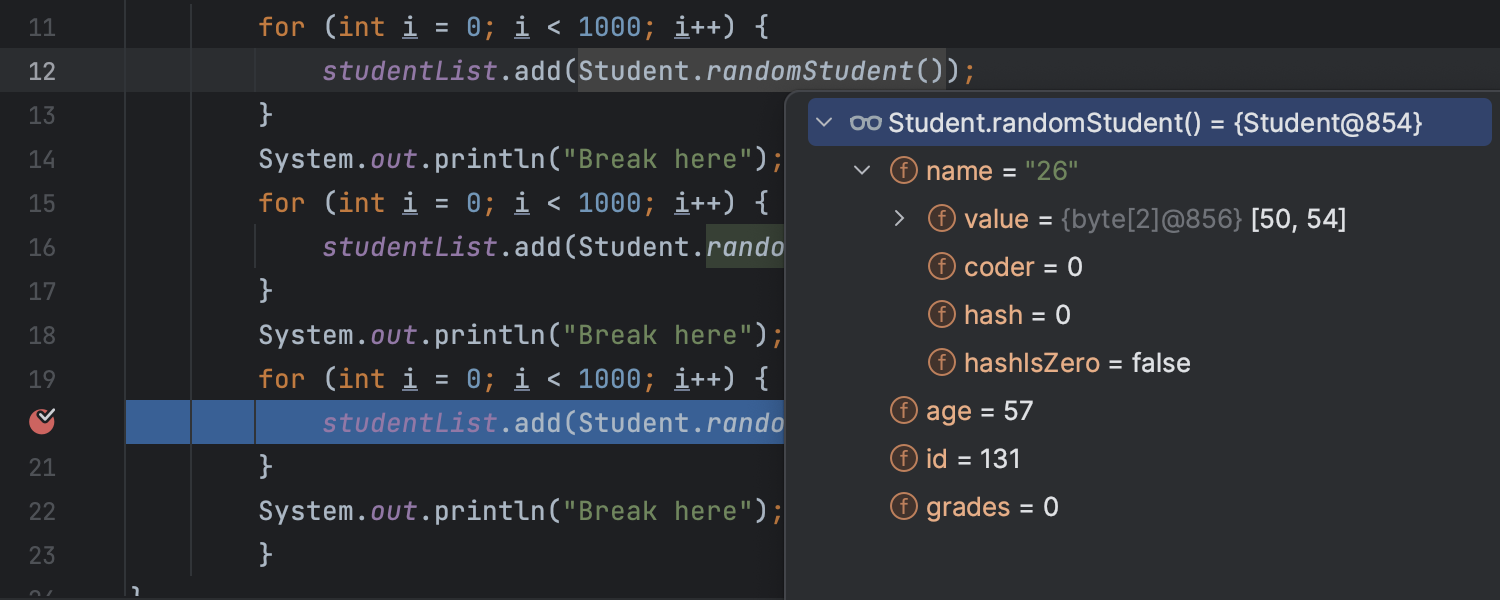
When you evaluate an object, you’ll see the whole tree with all the related fields, which you can inspect immediately.
If you prefer to use shortcuts instead of working with a mouse, put the caret at the desired expression and press ⌥ ⌘ F8 (macOS) or Ctrl+Alt+F8 (Windows and Linux).
Evaluating expressions in the Debug tool window or a dialog
Evaluating from the Debug tool window is more flexible than doing so from the editor as you can evaluate any piece of code – as long as it is in the context of the current frame.
In IntelliJ IDEA, there are a couple of ways to call this feature.
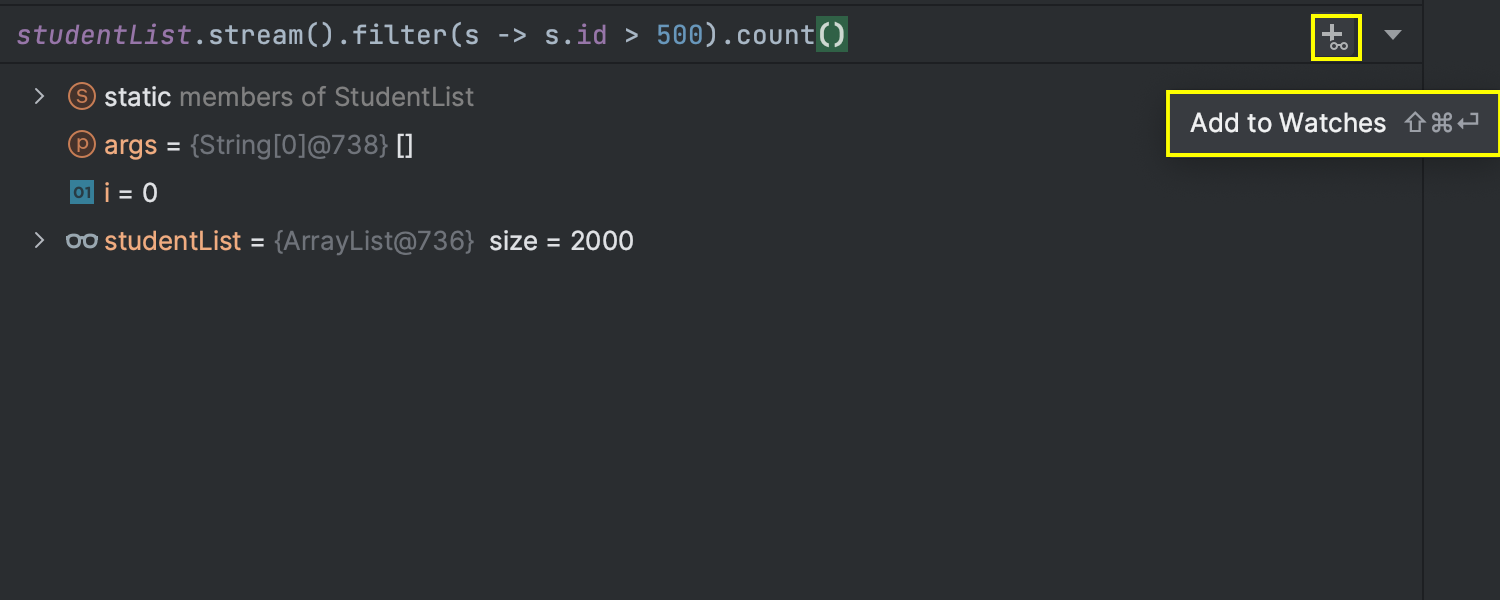
The quickest way is to use Evaluate Expression right at the top line of the Debug tool window. When you start typing the desired code for evaluation, the IDE will offer code completion suggestions.
This approach works best for one-line expressions.
In the example below, we evaluate studentList to get the number of students whose IDs are 500 or higher.
You can also use Evaluate Expression in a non-modal dialog. This is more suitable for complex cases where you need to evaluate multi-line code blocks.
To access it, right-click in the editor and choose Evaluate Expression, or press ⌥ F8 (macOS) or Alt+F8 (Windows and Linux).
If you select an expression before calling the feature, it will automatically appear in the dialog, saving you the trouble of having to type it again. All you have to do is extend the existing code to test different scenarios. Additionally, code completion works while you are writing the code, making the experience even more convenient.
Because the dialog is non-modal, you can switch the focus back to the editor to copy other variables and expressions or open multiple dialogs if you need to.
Watches
Watches are another helpful feature in this context. They allow you to repeatedly evaluate an expression as you step through your code. This can be beneficial when you want to evaluate expressions in the context of the current frame.
Watches let you quickly access information that’s not shown in the Variables tab and repeatedly modify the program state. Think of them as a tool to reevaluate an expression at
each step while debugging and find the results pinned in the Variables tab.
There are a couple ways to apply Watches:
- If you are evaluating an expression in the Debug tool window, click Add to Watches in the evaluation line or press ⇧⌘↩ (macOS) or Shift+Ctrl+Enter (Windows and Linux).
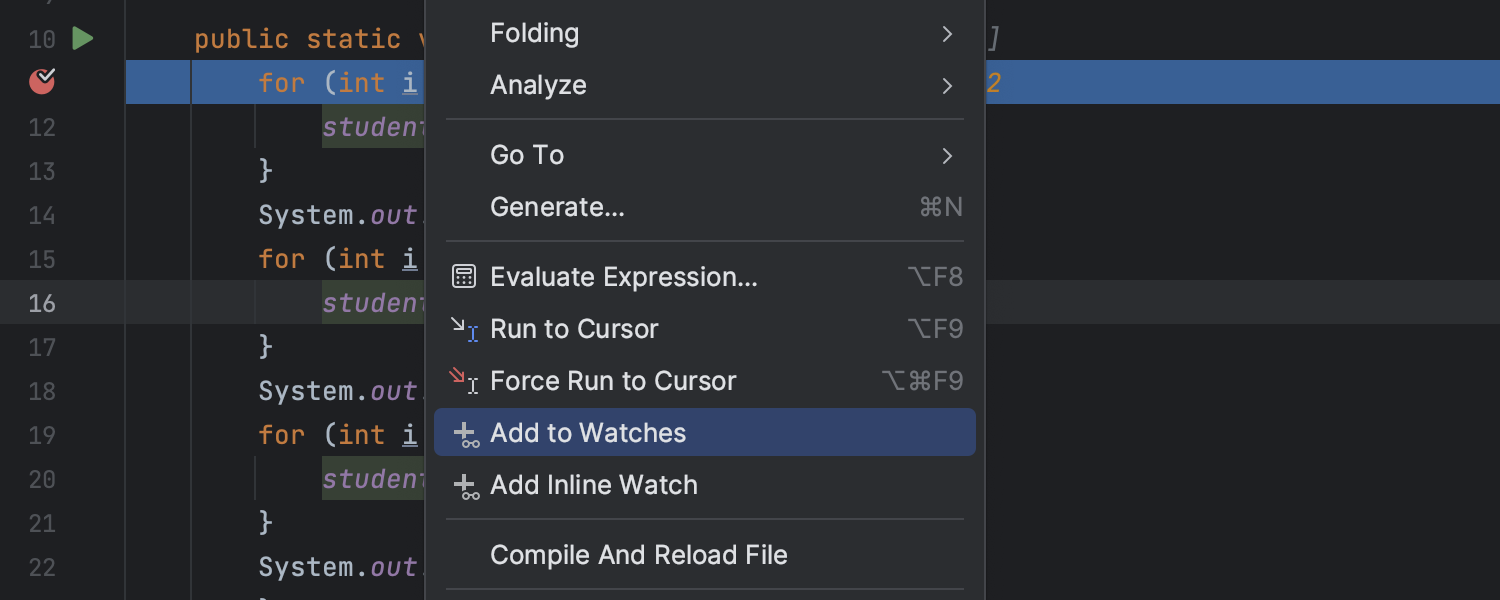
- Alternatively, right-click on an expression and select Add to Watches.
Once used, the feature lets you keep the expression result visible in the same pane as all the variables.
One particularly useful thing about Watches is that they remain active even after you restart the debug session. This means that if you no longer need to watch a variable, you have to select it from the list in the Debug tool window and press Delete.
In the example below, we add a watch that counts students with IDs that are 500 or higher. You can see how the resulting values of studentList change while we step.
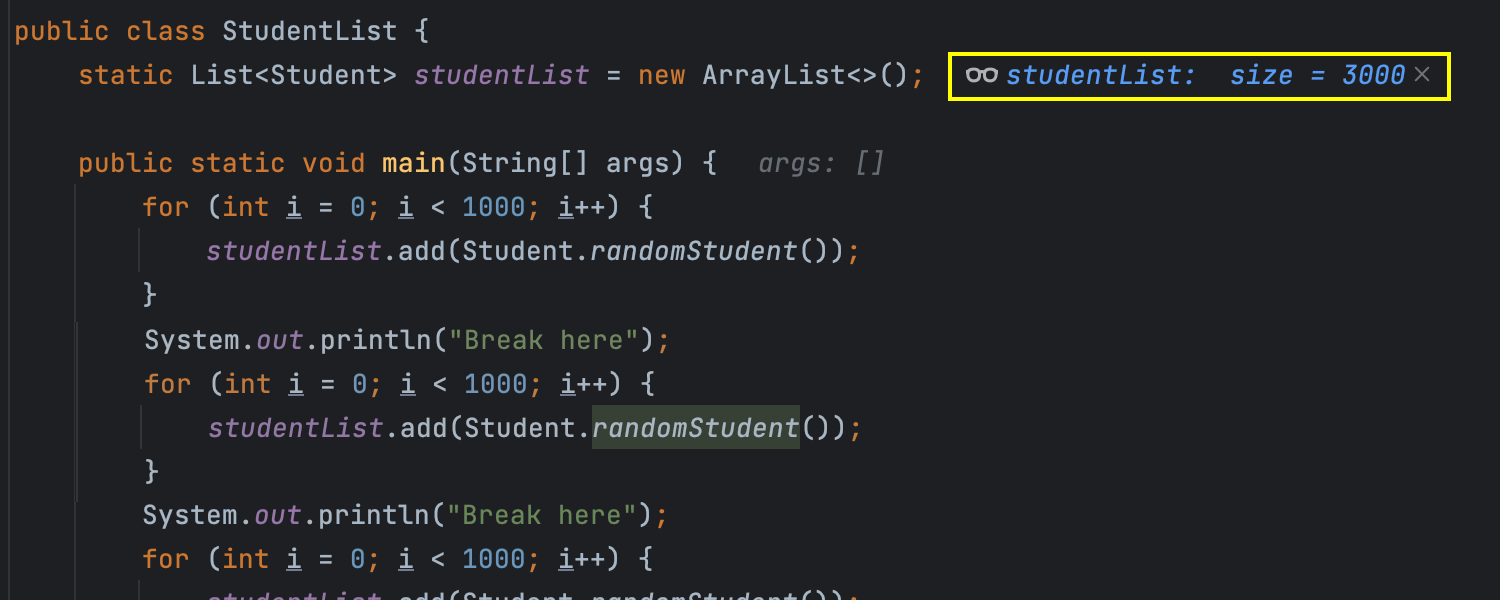
To watch the results of an expression right in the editor, you can add an inline Watch. Inline Watches are displayed like inline values, but they are marked with the glasses icon.
Summary
All of these features help you get the information you need from your code while debugging, making it easier to identify errors and try out possible fixes.
After reading this article, we hope you:
- Are familiar with a variety of ways to identify and analyze variable values.
- Can choose the approach to evaluate expressions that is most suitable in a given context and use it to test potential code fixes.
- Feel comfortable monitoring variables and expressions with Watches.
If you have any questions about expression evaluation or other topics related to debugging, let us know in the comments.
See you soon for the next installment of Debugger Upskill!