IntelliJ IDEA
IntelliJ IDEA – the Leading IDE for Professional Development in Java and Kotlin
IntelliJ IDEA 2023.2 EAP Is Open!
Exciting news for IntelliJ IDEA enthusiasts – the Early Access Program for IntelliJ IDEA 2023.2 starts today!
This program offers you an early glimpse of the new features and improvements expected to land in the next upcoming version. If you’re not yet familiar with the EAP concept, check out this blog post for more details.
Join us for the next few weeks in exploring the newest additions to IntelliJ IDEA and provide your valuable feedback after testing out the new features.

The first IntelliJ IDEA 2023.2 EAP build introduces an easy way to instantly see performance data from IntelliJ Profiler, improvements for debugging reactive applications, a new solution to seamlessly generate shared indexes for projects, and a few UI improvements.
You can download the build from our website, get it from the free Toolbox App, or update to it using snaps if you’re an Ubuntu user.
Let’s take a look at what other new features and improvements are available to try in this build.
User experience
Reworked hamburger menu in the main toolbar on Windows and Linux
We’ve refined the behavior of the hamburger menu in the new UI that is located in the main toolbar for Windows and Linux. Once you click on the menu icon, the elements now appear horizontally over the toolbar.
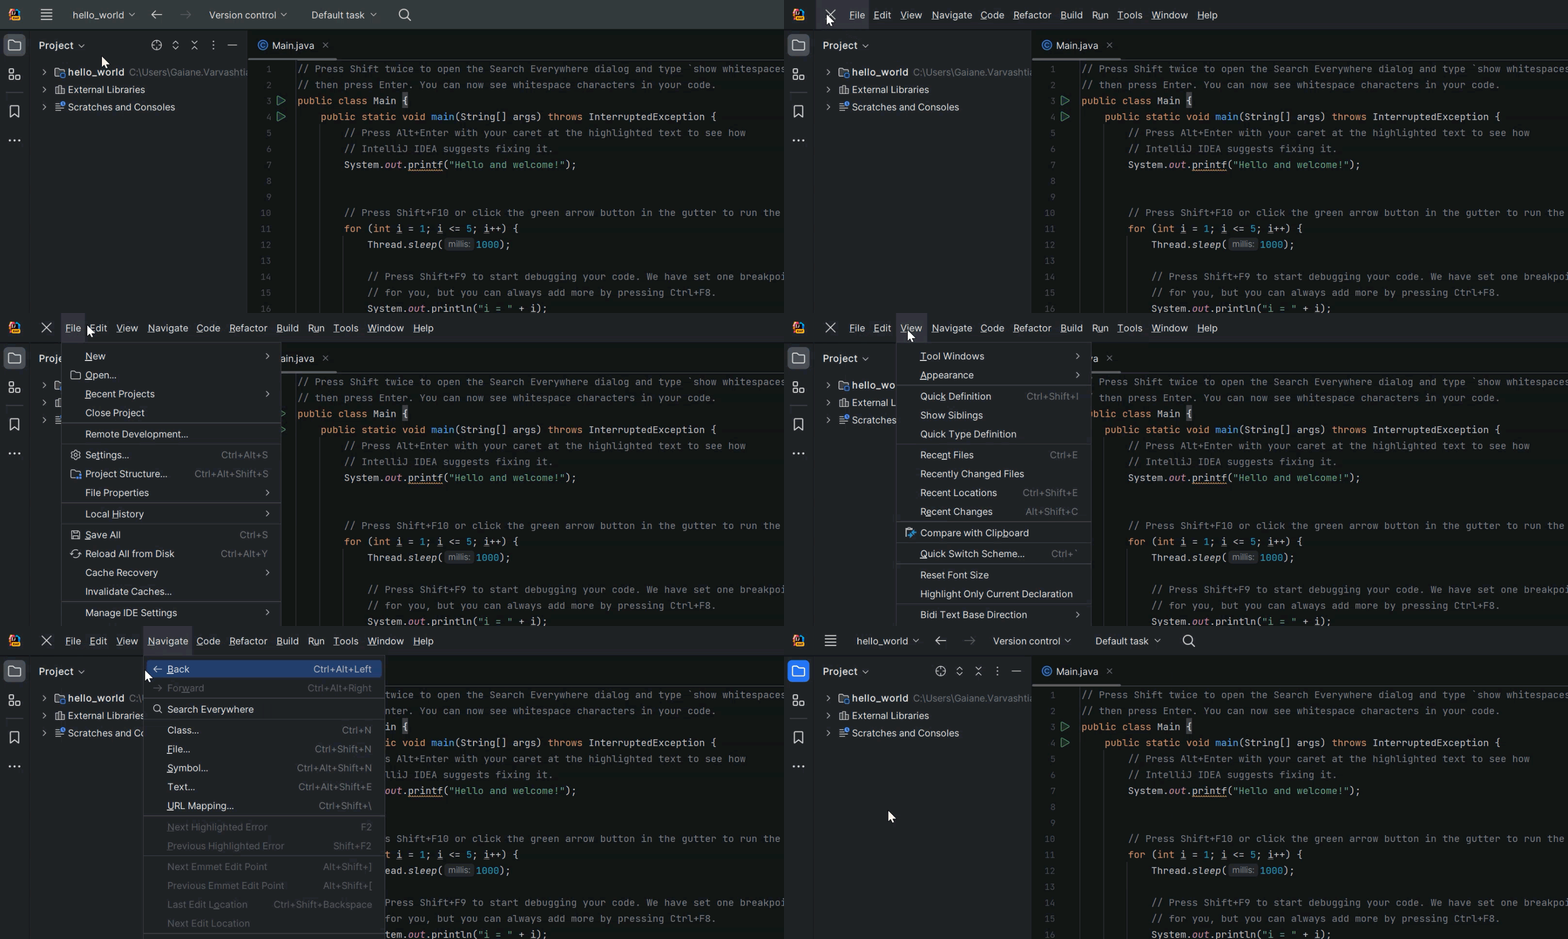
Also, there’s now an option to turn this menu into a separate toolbar. For this, go to View | Appearance | Main menu as a Separate Toolbar.
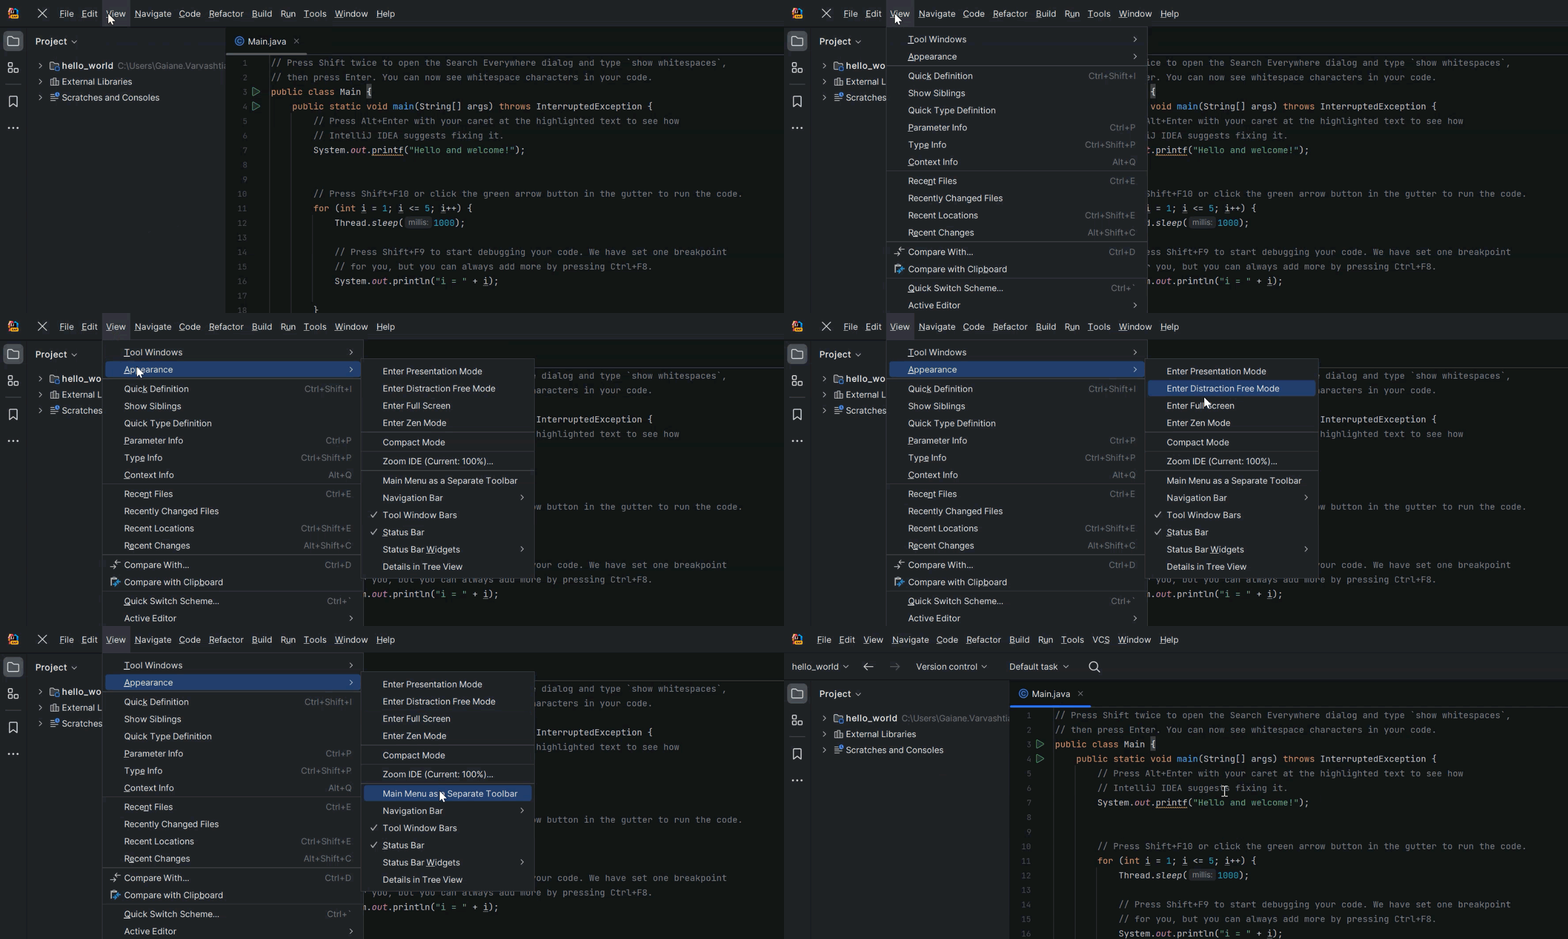
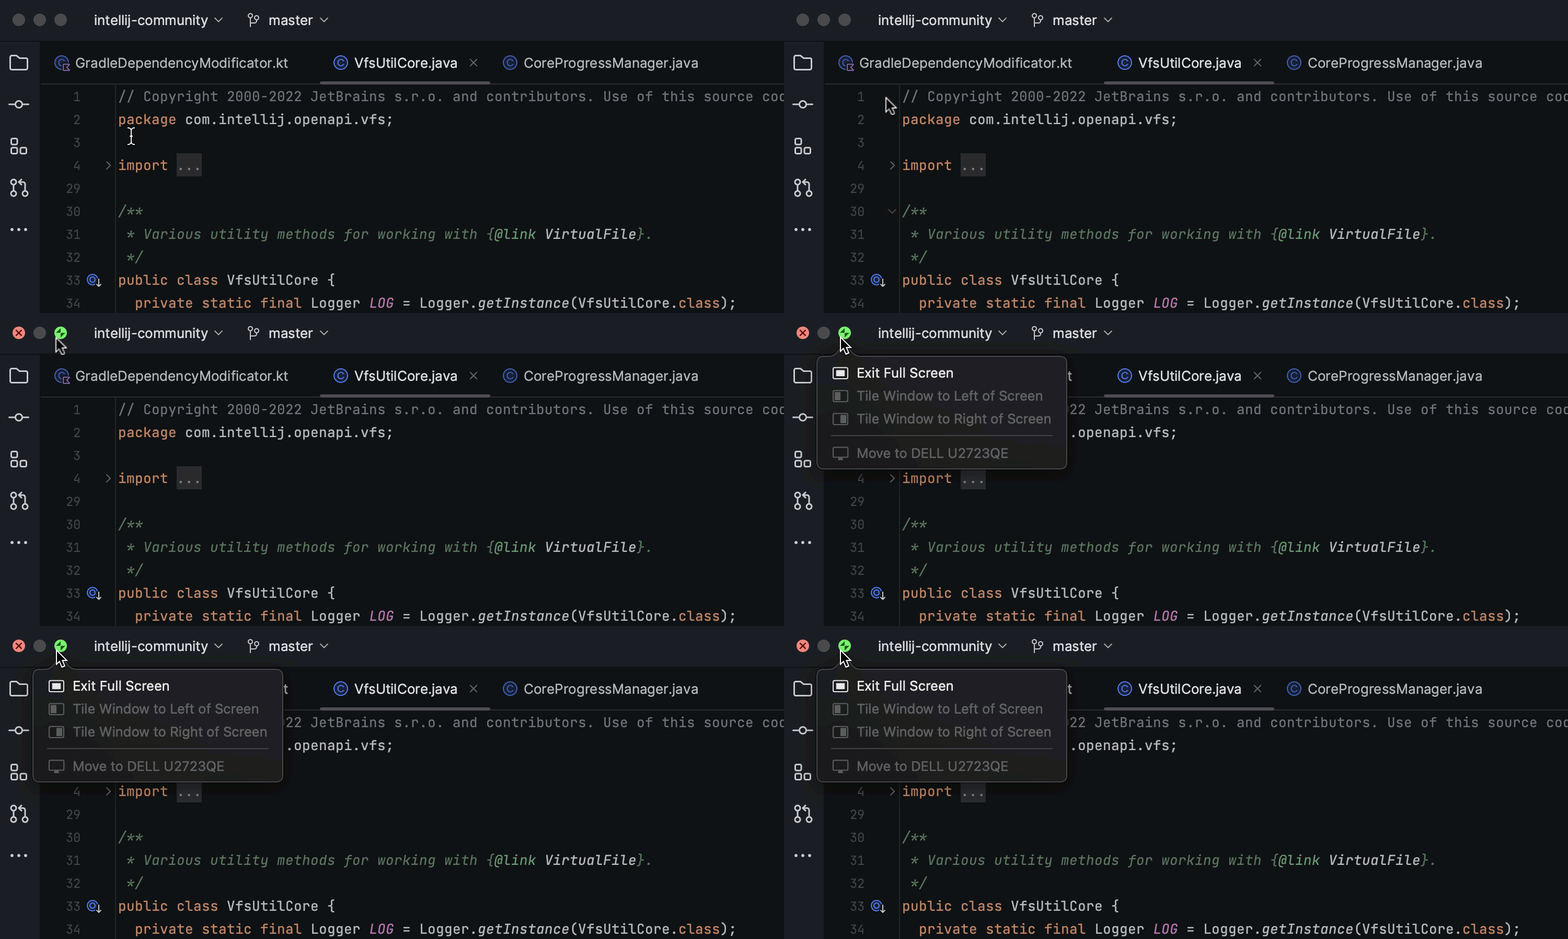
Updated window controls on macOS
When working on macOS in full screen mode using the new UI, the window controls are now displayed right in the main toolbar – not in the floating bar as before.
Profiler
In-editor performance hints
We keep improving IntelliJ Profiler to provide you with insightful information about how your application performs and make performance issues easier to investigate. In the first IntelliJ IDEA 2023.2 EAP build, we’ve introduced in-editor hints, which offer an easy way to interpret your code’s performance line by line and help you resolve performance problems faster.
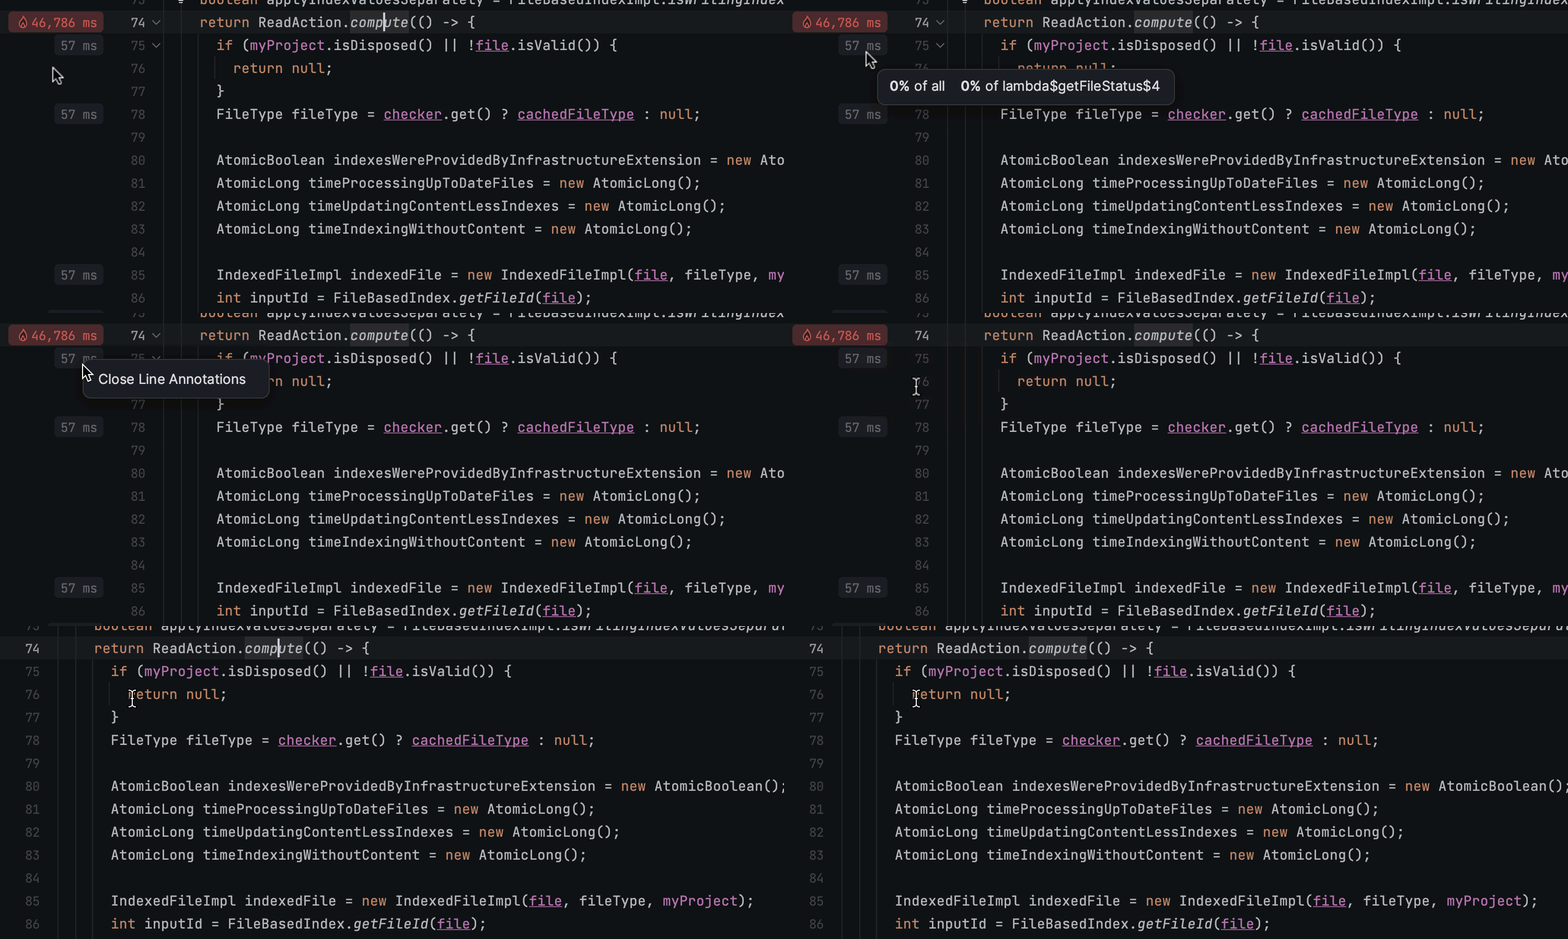
With this addition, the data from IntelliJ Profiler is visualized right in the editor – the execution time and memory allocation data appear in the gutter next to the corresponding line of code. These annotations are color-coded to help you instantly see which methods require your attention the most. Calls taking the majority of the parent method’s time are highlighted in red, and they will additionally feature a fire icon if the total execution time is significantly affected.
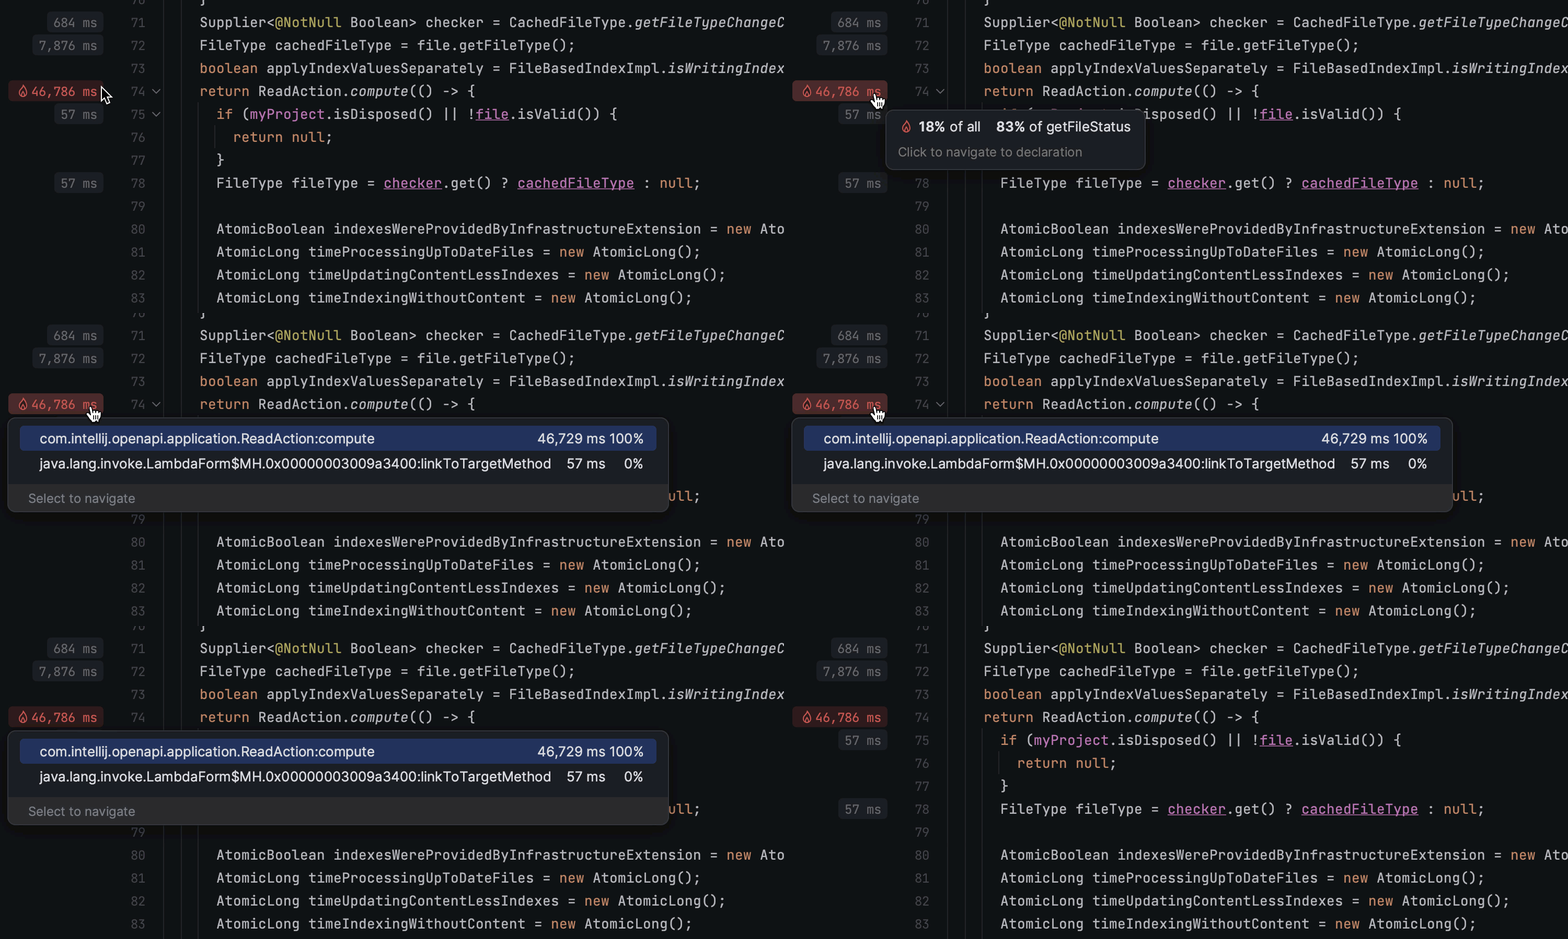
This way, you can easily focus on performance bottlenecks and review them on the fly without having to perform a thorough, time-consuming analysis with the Flame Graph and Call Tree views.
Inline performance hints are enabled by default. If you want to turn them off, right-click on any annotation and click Close Line Annotations.
Run/Debug
Reactor Mono and Flux values evaluation
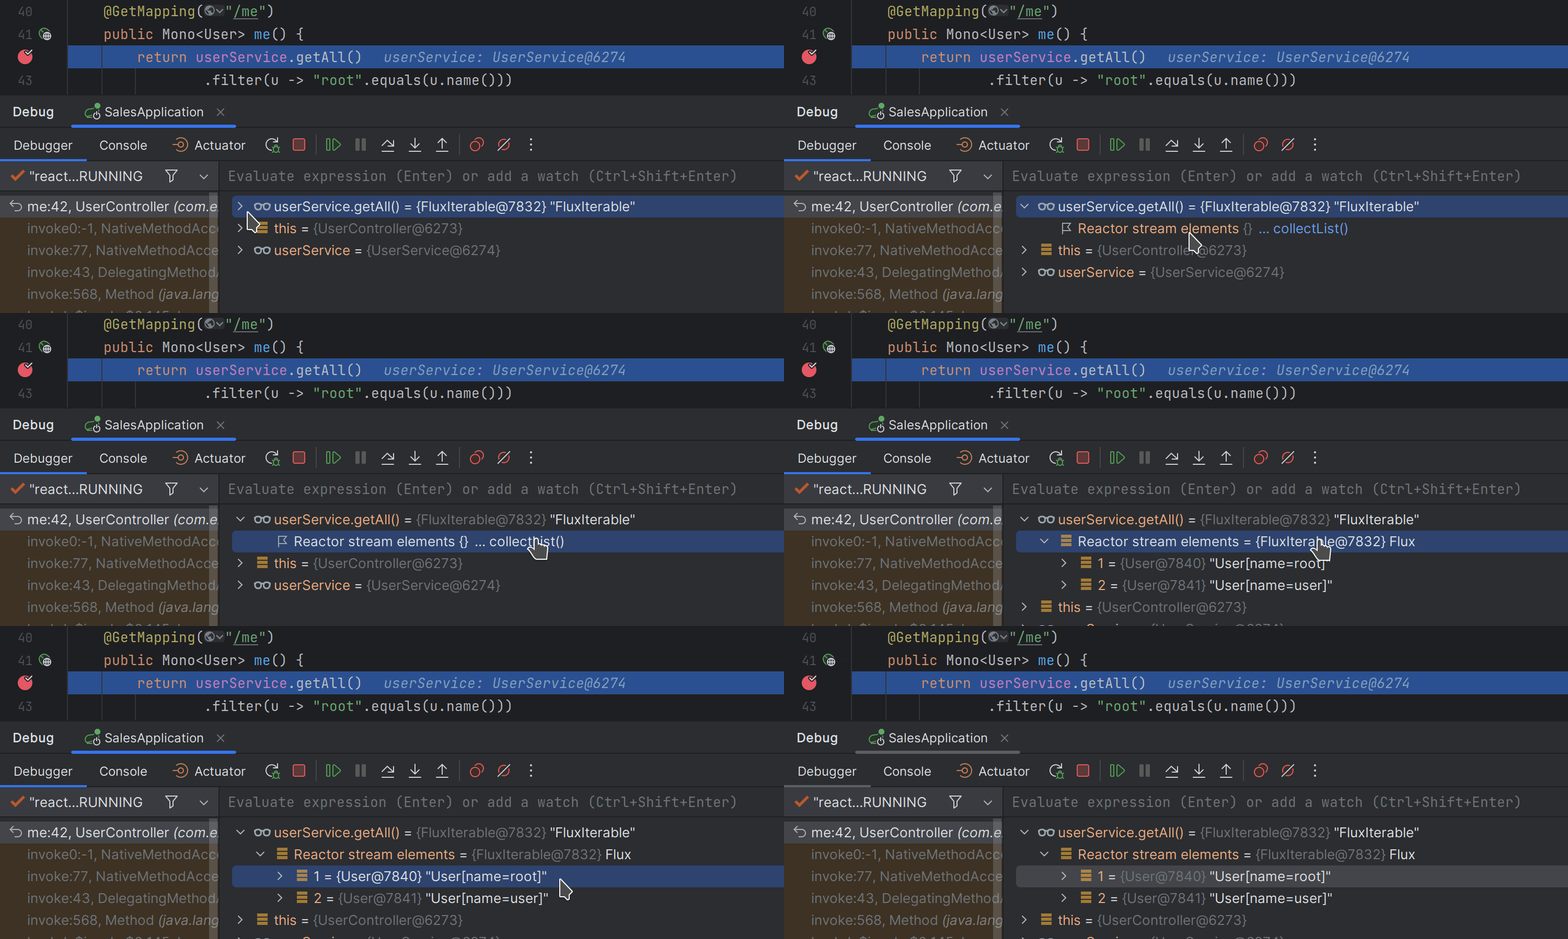
When debugging your reactive application, you can now easily evaluate values of watches and local variables for Mono and Flux types. The IDE now detects them during debugging sessions and provides a corresponding get or collectList link in the Variables view, which you can click to instantly compute reactive stream items.
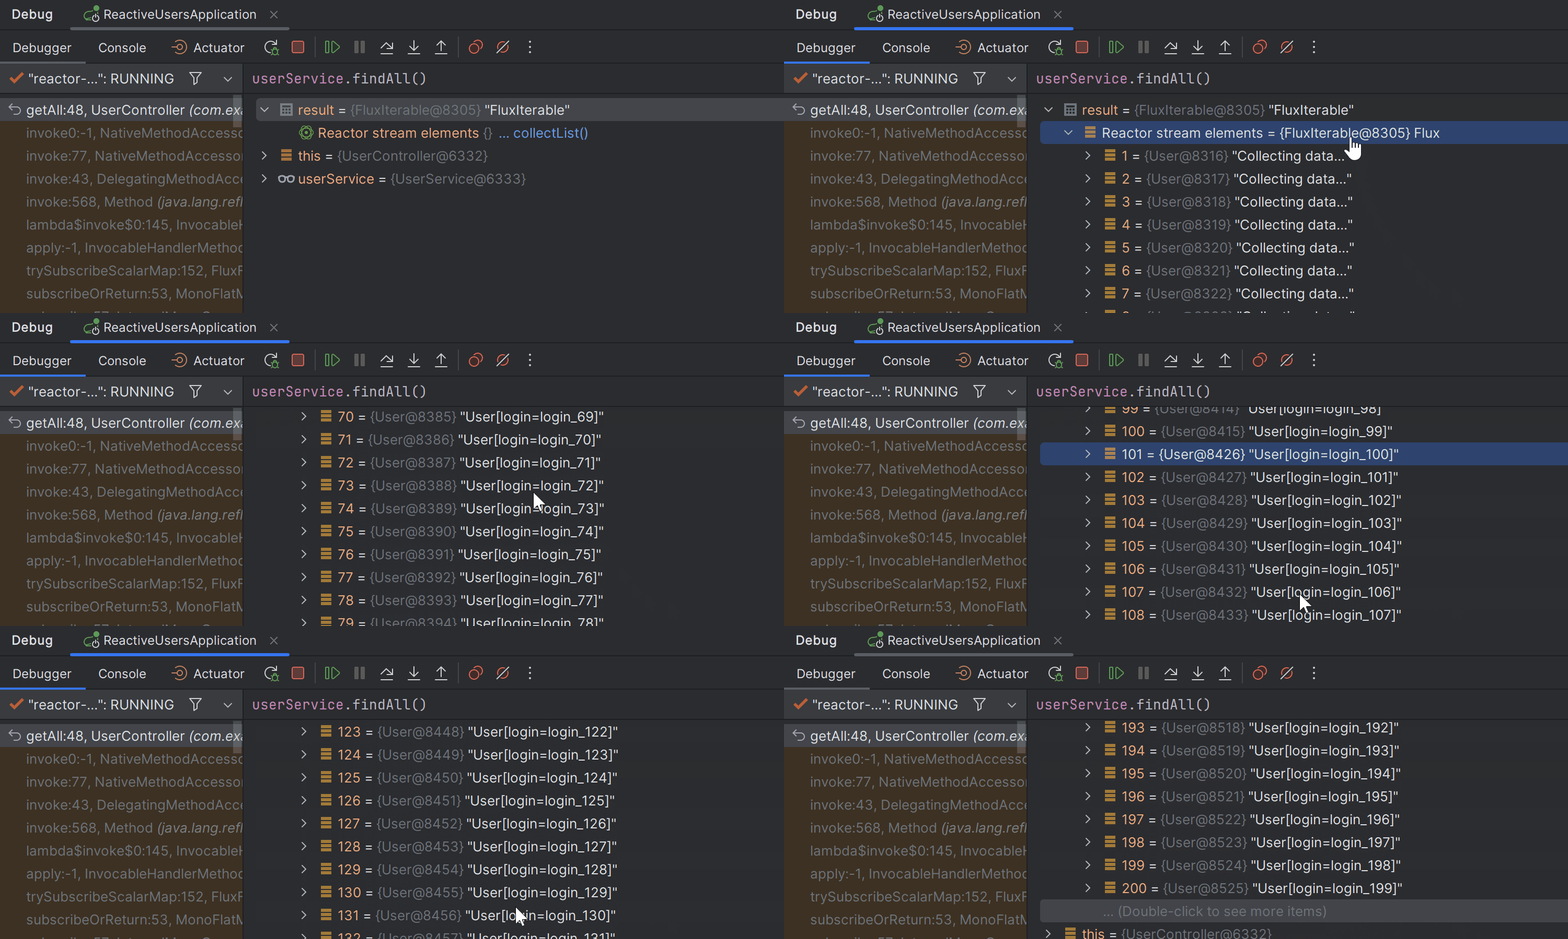
By default, the debugger fetches the first 100 items of Flux. You can configure this number in File | Settings | Languages & Frameworks | Reactive Streams. Please note that each time you trigger a computation, the IDE subscribes to a Publisher value and assumes that the operation is safe to retry.
Performance
New tool for easily generating shared indexes
We’re introducing a new command line tool for quickly building and uploading shared indexes. It is designed to streamline teamwork and eliminate time wasted on locally indexing large projects.
The new tool simplifies the process of generating shared indexes for your team, requiring just a few clicks instead of multiple scripts and services.
The workflow is straightforward: Download the archive, unzip it, and execute the binary file via the command line, specifying the project path. The tool will then configure an intellij.yaml file that you need to add to your project.
For more comprehensive customization, check out the scripts provided in readme.md.
These are the most notable updates for this week. To see the full list of changes in this EAP build, please refer to the release notes.
We’re committed to delivering the best experience for our users, and we value your input in helping us achieve that goal. If you encounter any bugs while working with this build, please submit a report using our issue tracker. If you have any questions or feedback, let us know in the comments below or get in touch with our team on Twitter.
Happy developing!


