IntelliJ IDEA
IntelliJ IDEA – the Leading IDE for Professional Development in Java and Kotlin
Getting Started with Databases in IntelliJ IDEA

Have you ever wondered how IntelliJ IDEA handles databases? Well, today is the perfect opportunity to find out in our database tutorial on initial setups and first steps.
All of the features you’ll need when working with databases are available out of the box in IntelliJ IDEA with the Ultimate subscription. You can perform various tasks like querying data, creating new databases, and managing existing ones – all without leaving your IDE.
One of the best things about the database support is its versatility. Whether your databases are stored locally, on a server, or in the cloud, you’ll always be able to work with them seamlessly. It also supports most database systems, including MySQL, PostgreSQL, Microsoft SQL Server, SQLite, MariaDB, Oracle, MongoDB, Redis, and more.
In fact, IntelliJ IDEA with the Ultimate subscription provides all of the functionality that is available in DataGrip, JetBrains’ standalone database management tool for developers.
Set up a database
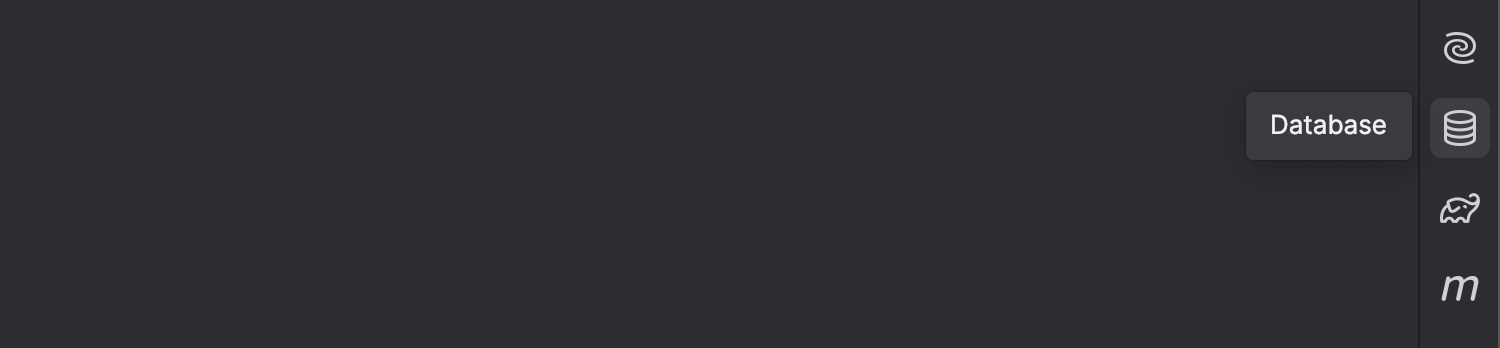
IntelliJ IDEA comes with a Database tool window where you can perform all the database actions you might need. You can access it quickly from the side toolbar.
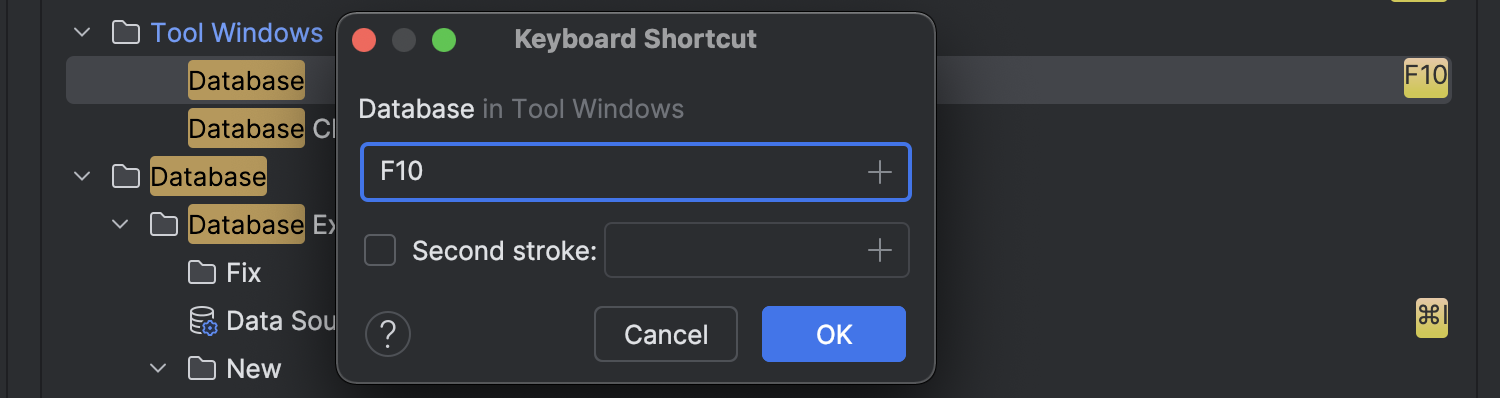
When working with databases, it may be a good idea to create a dedicated shortcut for this tool window. To do so, go to Preferences/Settings | Appearance & Behavior | Keymap and type Database in the search field. Select it from the list and assign the desired shortcut. You’ll now be able access the tool window quickly and conveniently.
Now, in the Database tool window, click the + sign to add our first data source. From there, select the type of database you’re connecting to and provide the necessary connection details such as host, port, database name, user, and password. Once you’ve entered all the necessary information, click the Test Connection button to ensure everything is set up correctly before finalizing the setup.
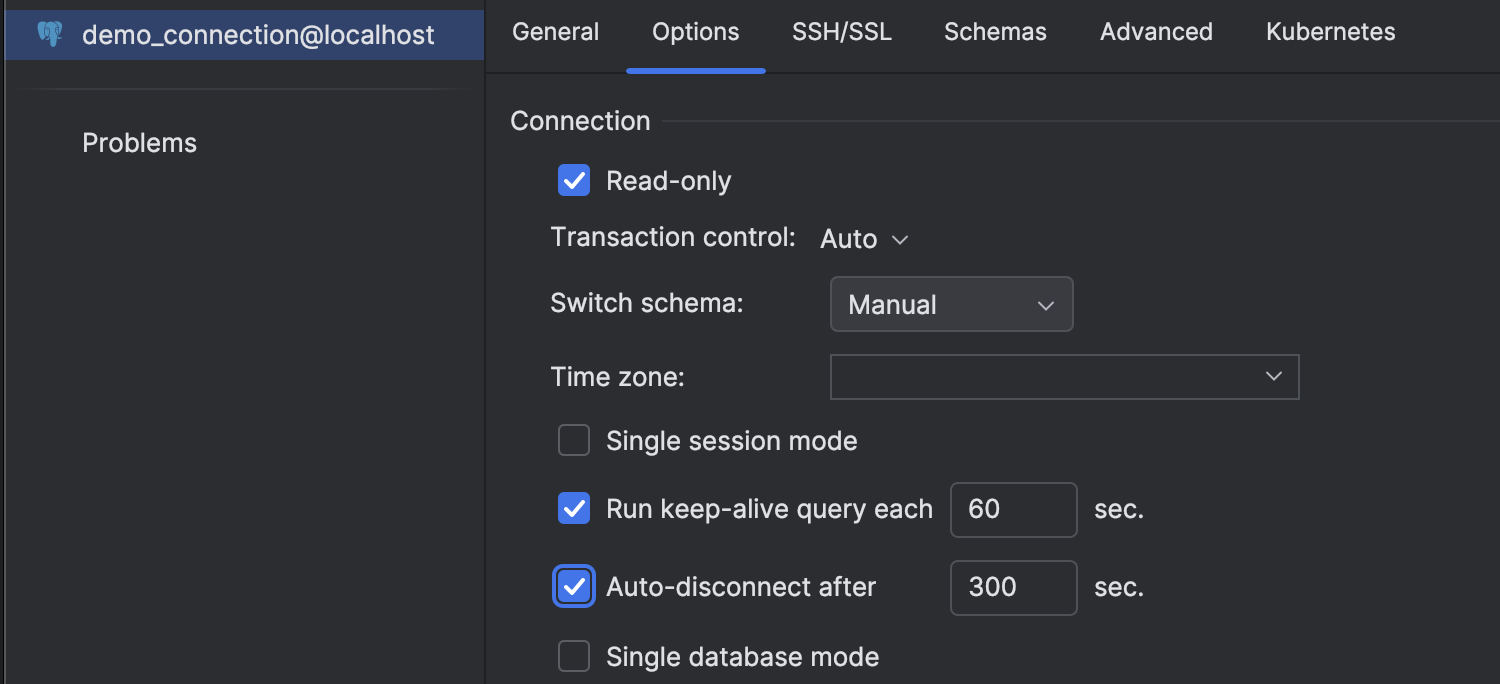
The Data Sources and Drivers dialog features multiple tabs with additional settings. For instance, the Options tab allows you to set transaction control to manual or automatic. If you check the Read-only box, the IDE will prevent any modifications to your data source, which is desirable when handling production data. Additionally, it offers various other functionalities, such as keep-alive queries, auto-disconnect, and more.
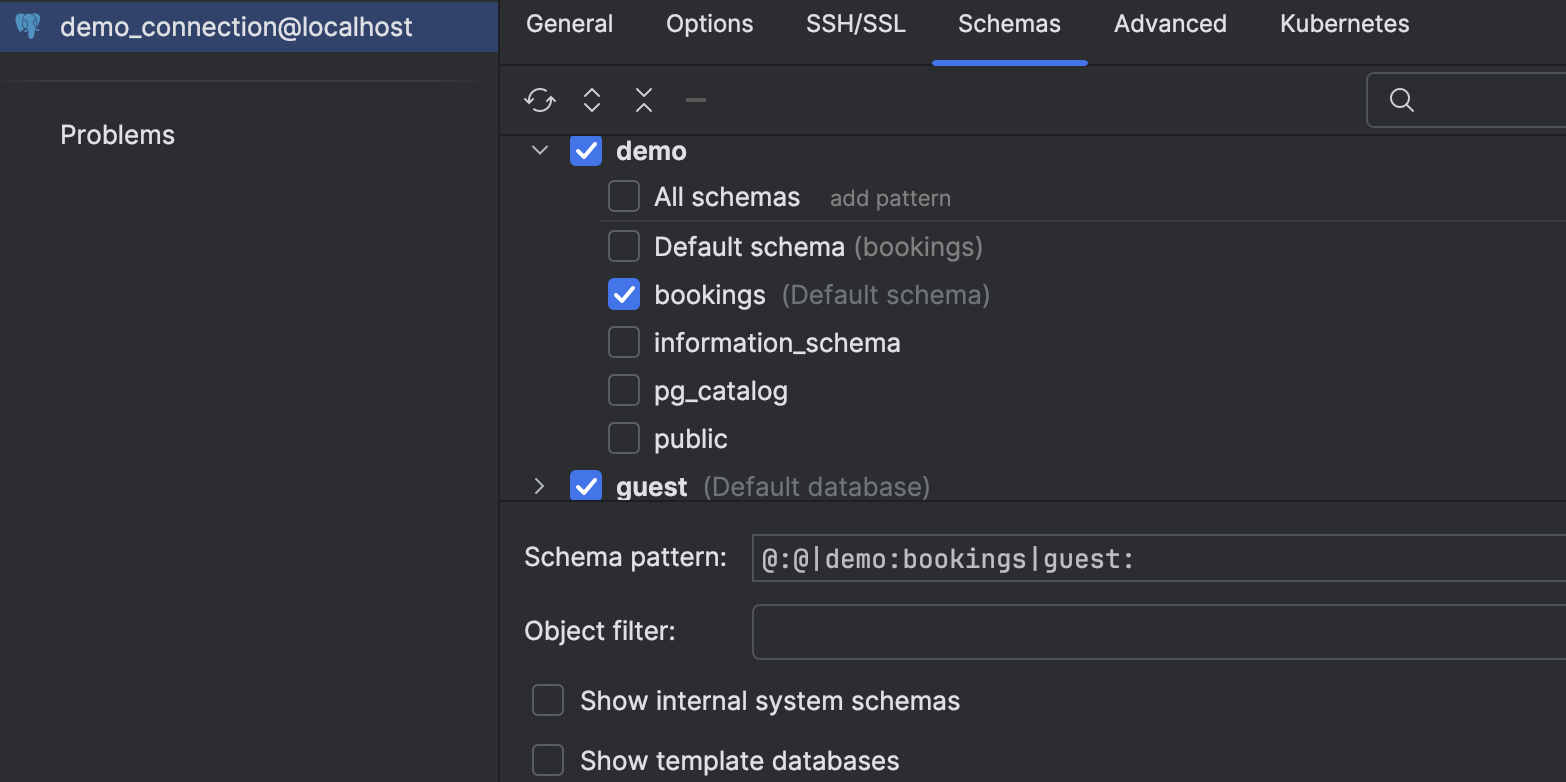
After you connect your database, IntelliJ IDEA will gather metadata about all of the database objects to help you with code suggestions and navigation. This process is called introspection. By default, all the schemas shown in the Database tool window are introspected. If your database has lots of schemas and you only need a few, you can pick the ones you want to see and work with in the Schemas tab.
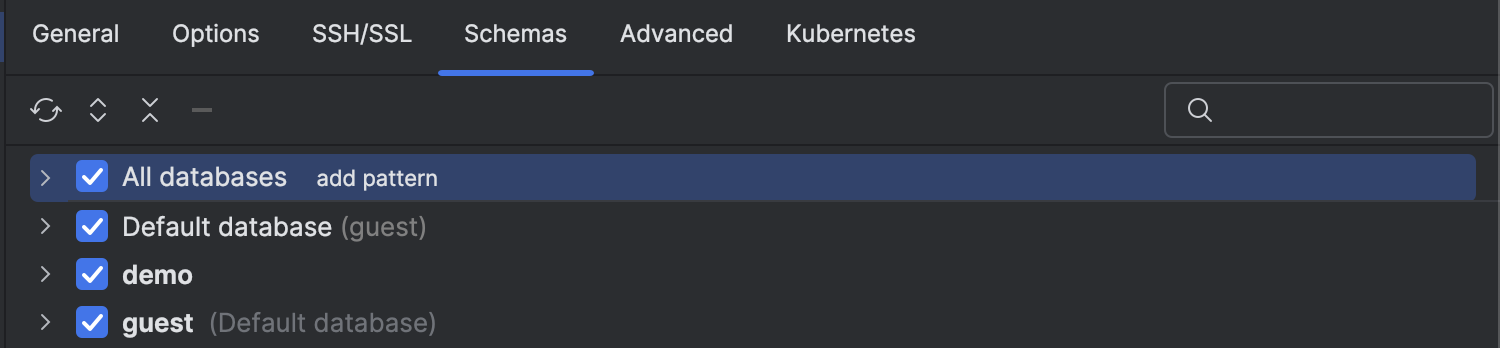
If you want to introspect all of your database schemas, just check the All databases box.
Additionally, the All Namespaces option is available if you prefer to have all databases and schemas visible in the Database tool window without introspecting them. To enable it, go to View options (eye icon) | All Namespaces in the Database tool window.
To introspect a specific database or schema, simply select it and press the Refresh button. For more details, read this blog post.
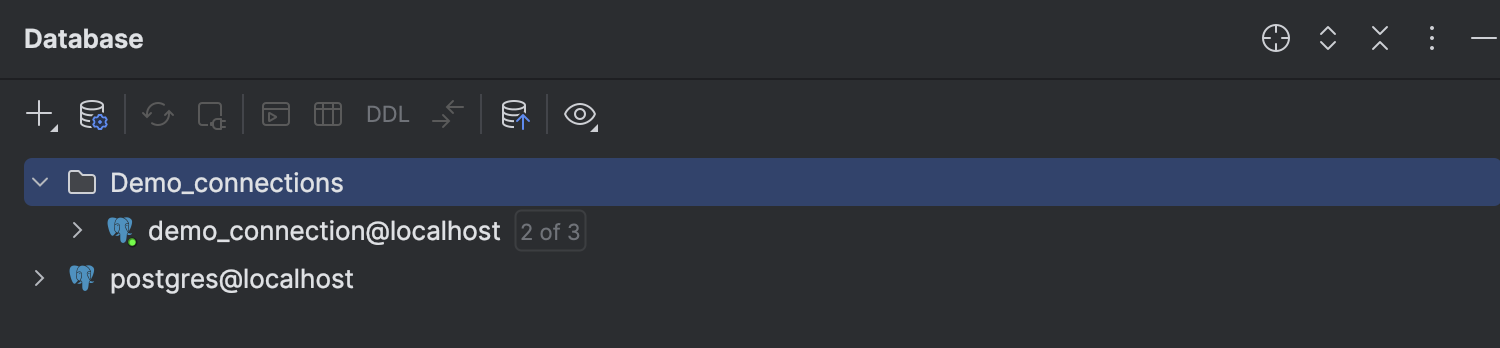
Once all the settings are applied and the connection is tested, click OK. The data source is now ready, and you’ll see it in the database tree.
Explore the interface
Now that you have a connected database, you can explore what you can do with it. For our examples, we’ll use a database that contains data about various planes, flight bookings, destination airports, etc.
View
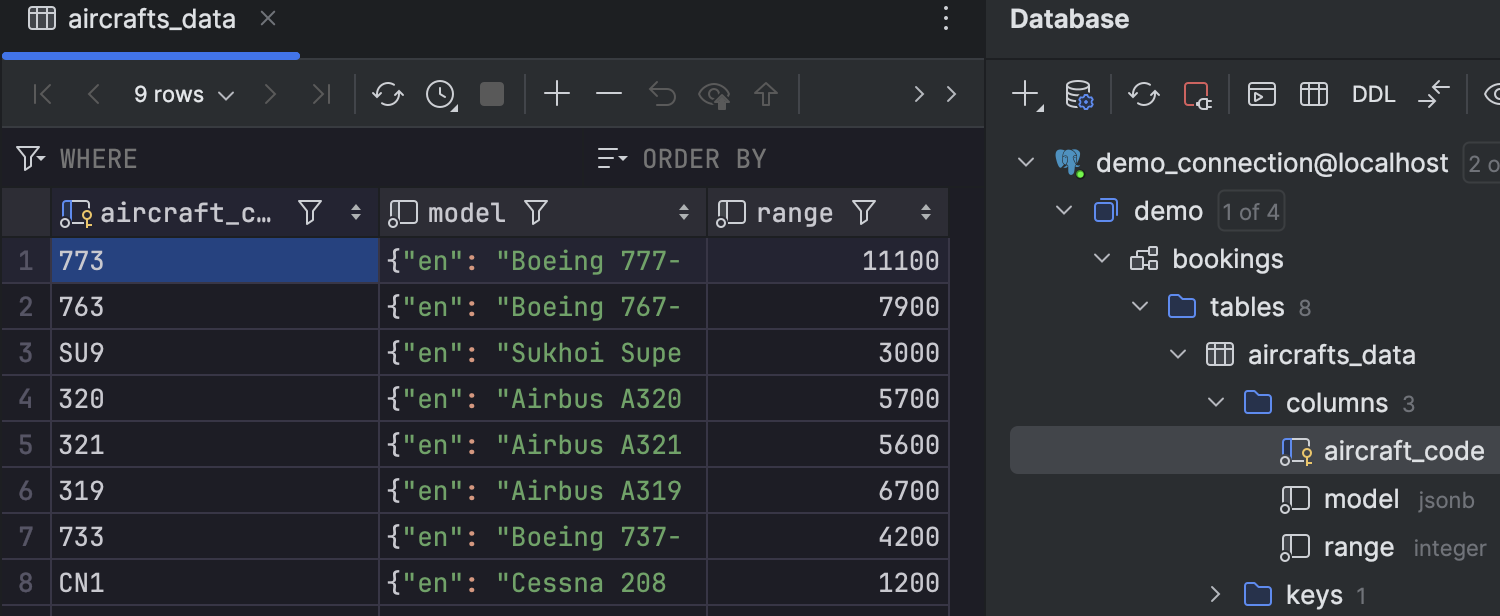
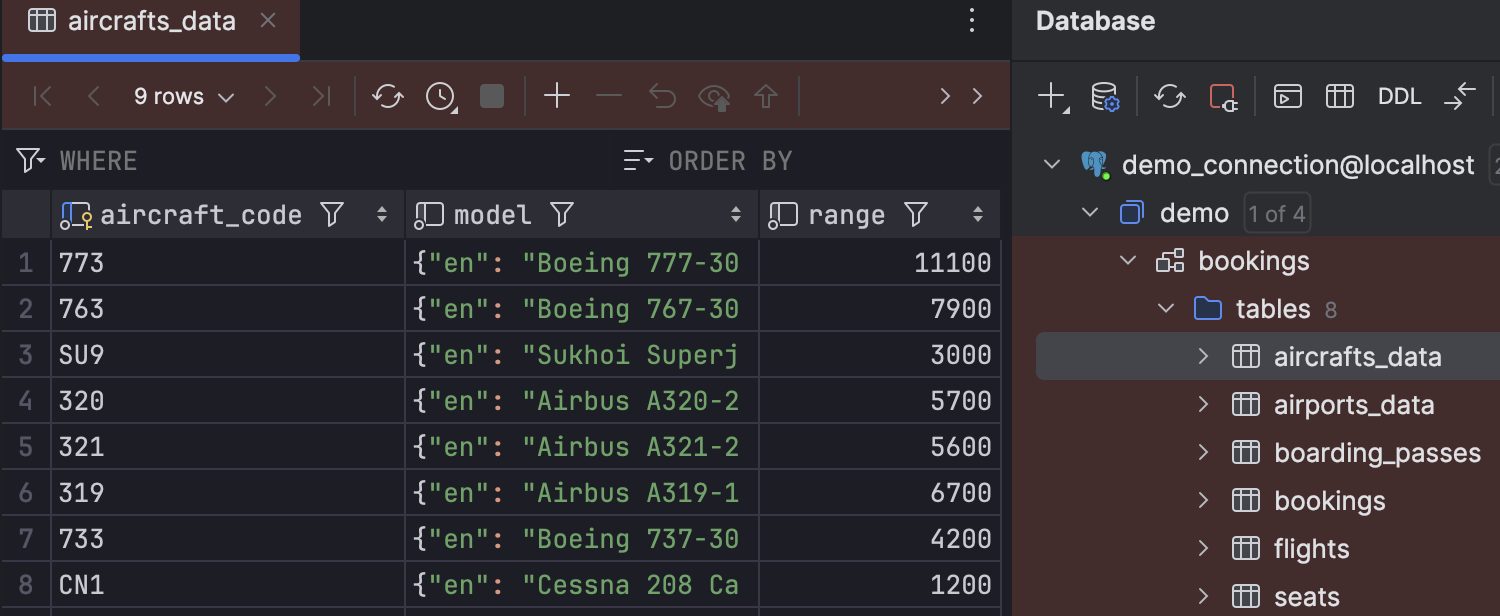
When you click on your database, it reveals all tables, routines, and other database objects. If you select the button next to the data source name (1 of 4), you’ll be taken to the Schemas tab, where you can choose specific schemas and databases to display in the tree.
When you double-click on an object, you’ll see its content right away.
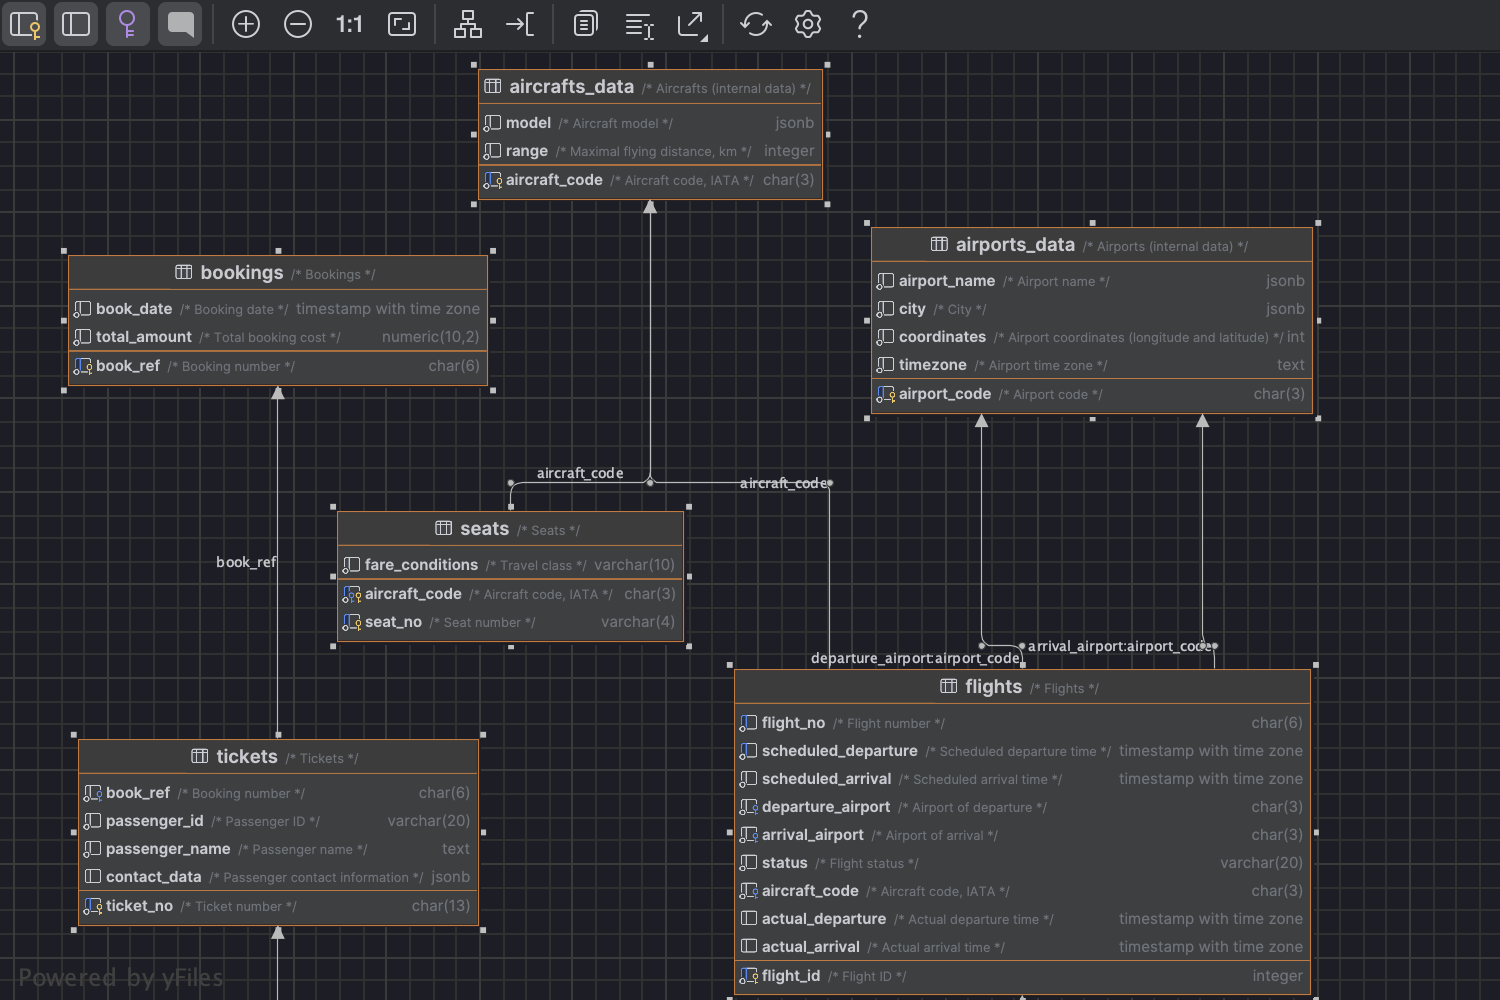
Another interesting feature of database visualization is the ability to generate a diagram that will demonstrate the relationships of various objects within the database. To do so, go to the object you’re working with, right-click on it, and select Diagrams…| Show Diagram Popup.
Group and highlight
In IntelliJ IDEA, you have the flexibility to arrange your data sources in whatever way best suits your workflow. If you’re dealing with multiple data sources, grouping them can enhance organization. Simply press F6 and then drag and drop the desired data sources into a new folder.
Additionally, you can color-code each data source. This setting extends to all queries and files associated with that data source, ensuring you’re always aware of the production context you’re working within. To assign a color, right-click on any object and select Tools | Set Color.
Search
Speed search is a useful feature that lets you quickly find objects by typing the initial letters or abbreviations of table names. Press ⌘F and see how it works. To toggle the Speed Search filter on and off, click the dedicated button in the search field.
Run your first queries
Now that you’re familiar with the layout of your database and know how to tailor it to your preferences, let’s explore how to create and execute queries and then retrieve results from them.
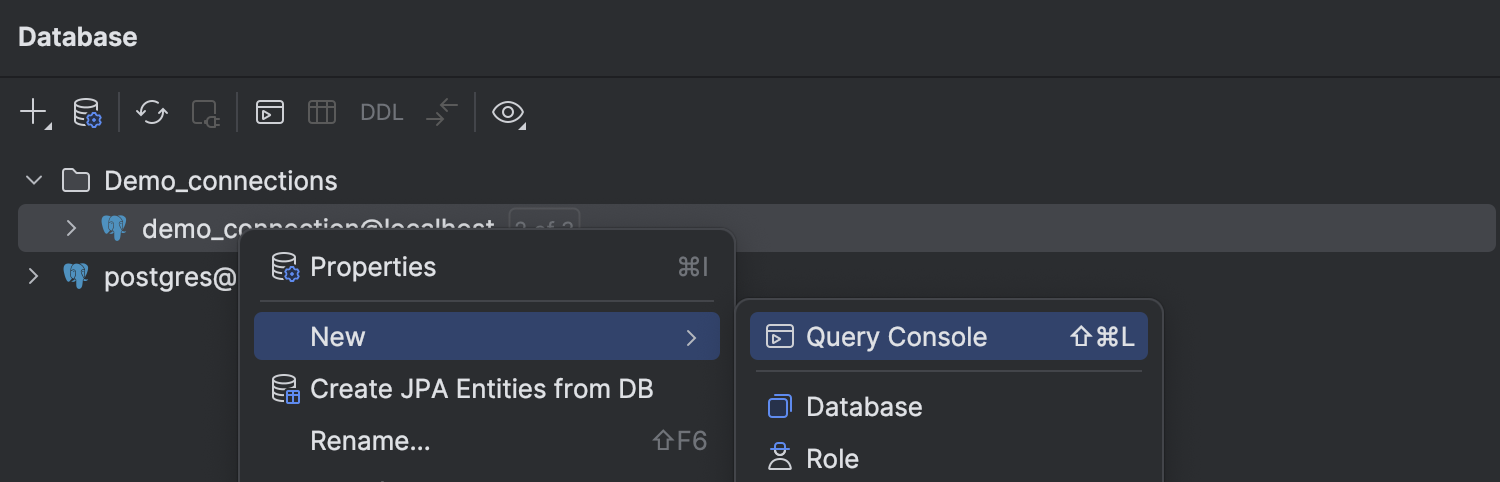
To work with queries, you use a query console, which is like a special terminal where you type and run your code. To open it, right-click on the desired data source and navigate to New | Query Console.
Now it’s time to create multiple queries! One query displays all available plane models, their codes, and their quantity. The second one selects the 10 most expensive bookings.
Code completion is of immense help in this task.
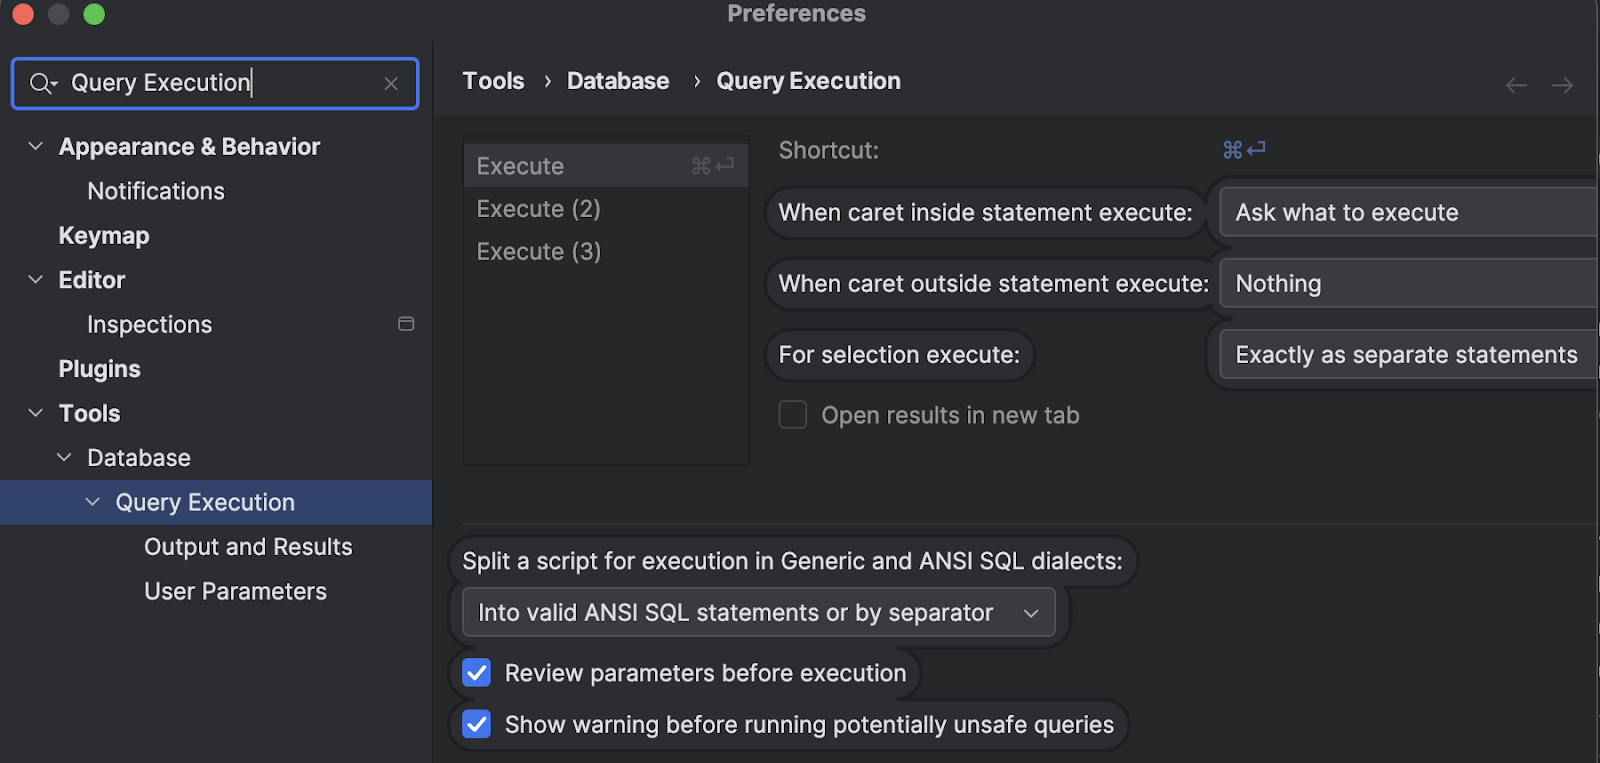
When you run queries in IntelliJ IDEA, you don’t need to select the code because the IDE understands where your caret is. If you have several queries in your console and click the Execute button on the toolbar, you’ll be shown a list of the possible queries you can run. In the example below you can decide whether you need to run the current query or the whole script. If you select the Customize option in the Statements popup, you can further fine-tune the process of query execution.
After the run has been executed, you’ll see the result appear in a separate tab in the Services tool window.
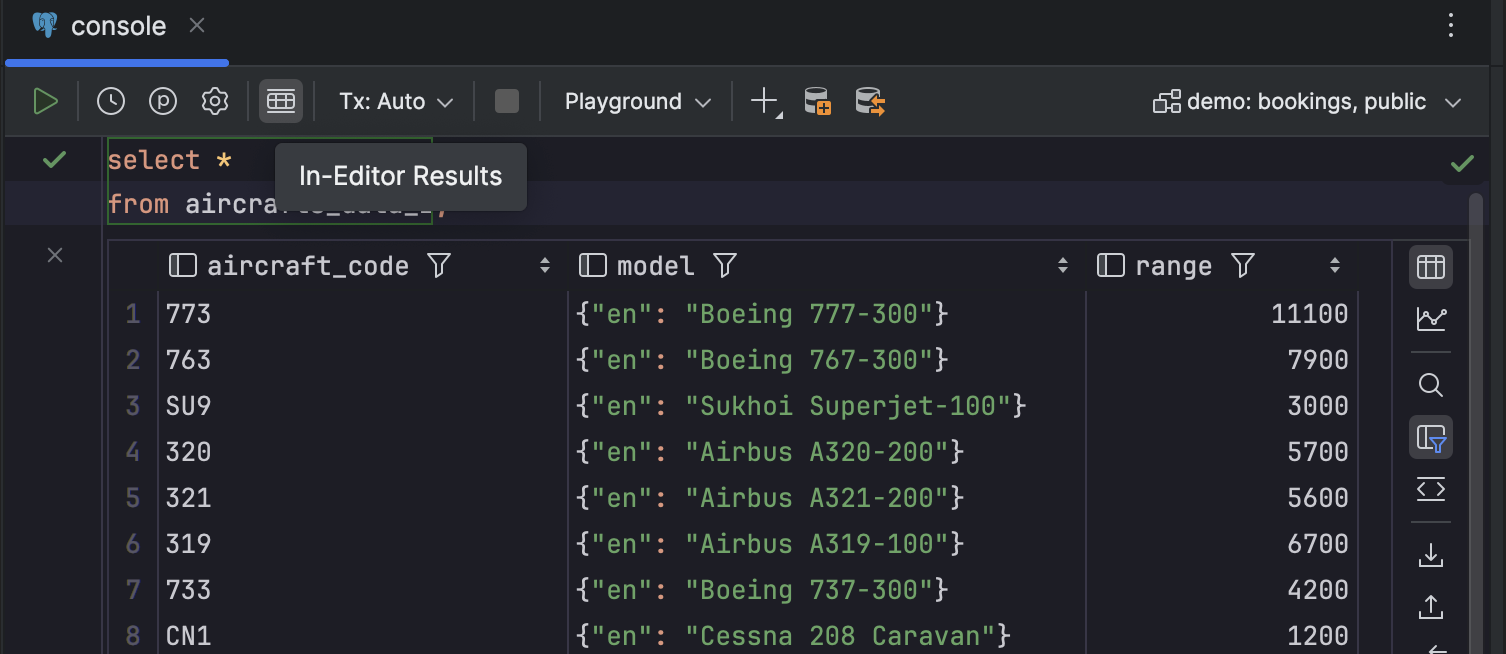
You can also view the query results within the editor. To do so, click the In-Editor Results icon on the toolbar.
We hope you enjoyed your introduction to database management in IntelliJ IDEA! Keep an eye out for upcoming articles that will demonstrate more features designed to optimize and streamline your day-to-day database tasks.