IntelliJ IDEA
IntelliJ IDEA – the Leading IDE for Professional Development in Java and Kotlin
Code Analysis for Your Projects With IntelliJ IDEA and Qodana

As developers, we spend more time maintaining existing code than we do writing new code. Any tools that can help make this easier can save us a lot of time.
In this blog post series, we’ll look at several ways that code analysis in IntelliJ IDEA can help you find and fix problems in your code. In the previous post, we looked at how the IDE can help you prevent problems while working with code.
- Part 1: Introduction to code analysis in IntelliJ IDEA
- Part 3: Advanced Code Analysis in IntelliJ IDEA
IntelliJ IDEA can also help you resolve problems throughout your entire project, not only in the file you’re currently working on.
Find and fix a specific problem throughout your project
To check if a particular problem is present elsewhere in your project, you can run a specific inspection on your whole project or a section of the project. To do so, open the Run Inspection by Name dialog using the shortcut (⌘⌥⇧I on macOS / Alt+ on Windows/Linux). Or, find any action in IntelliJ IDEA using Find Action (⌘⇧A on macOS / Ctrl+Shift+A on Windows/Linux) and search for “Run Inspection by Name” in the popup field.
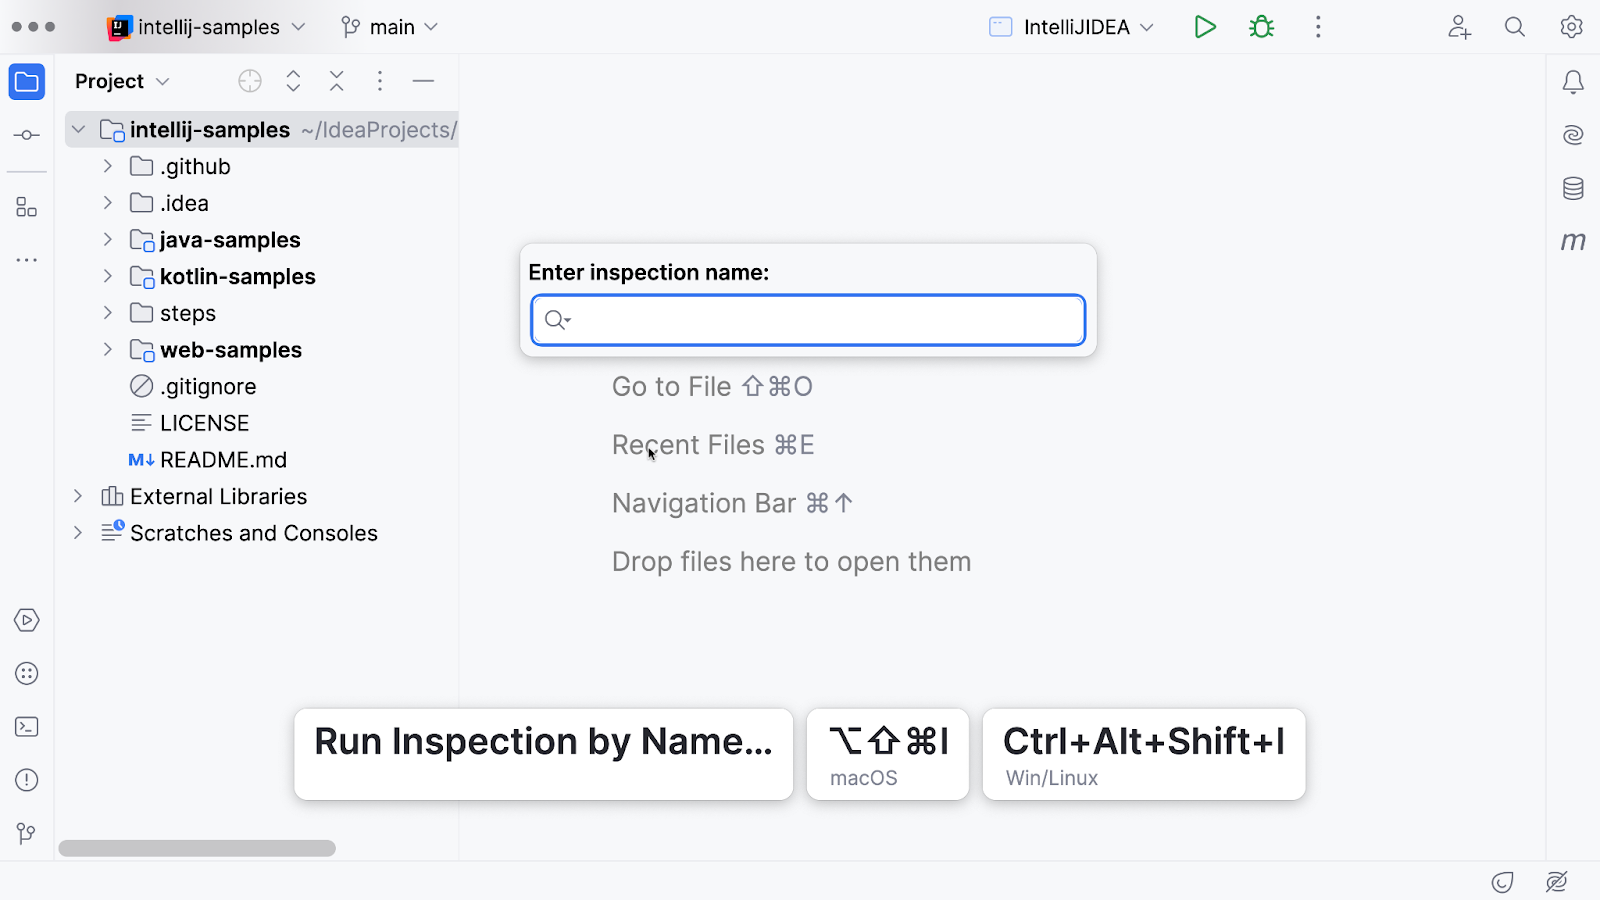
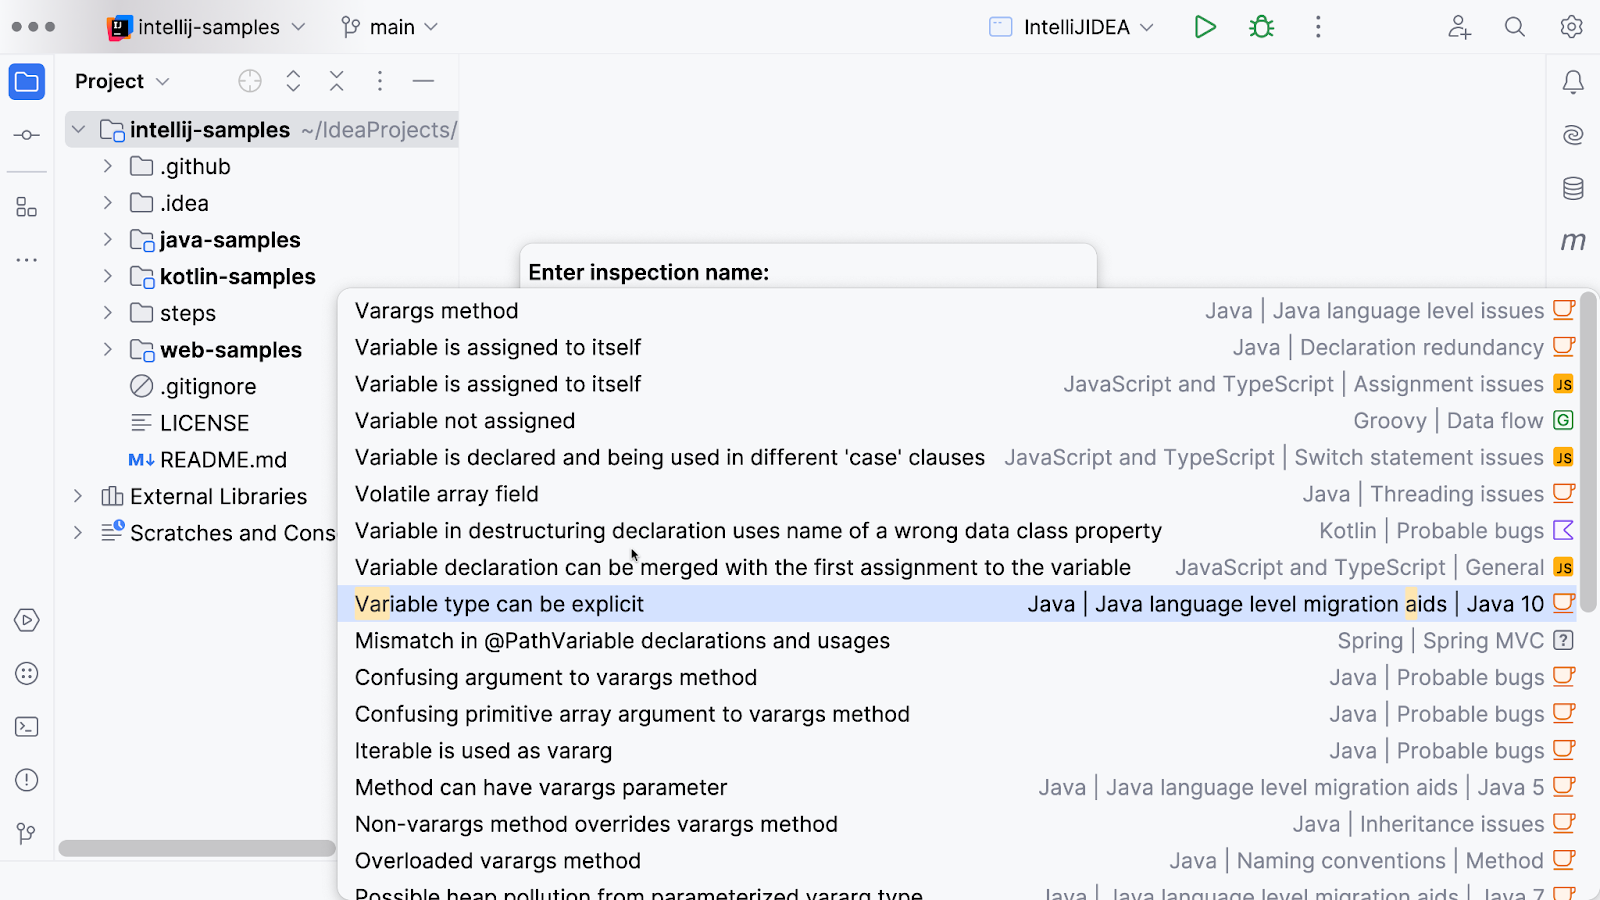
In the Enter inspection name dialog that opens, enter the name of the inspection you want to run. For example, you may want to replace all `var`s in your code base with explicit types using the Variable type can be explicit inspection. Or, if you prefer the opposite, you can replace explicit types with `var`s by using the Local variable type can be omitted inspection. Note that you don’t need to know the full or exact name of an inspection, as you can search for it in the popup. There are many inspections available for different languages and frameworks, including Java, Kotlin, and Spring.
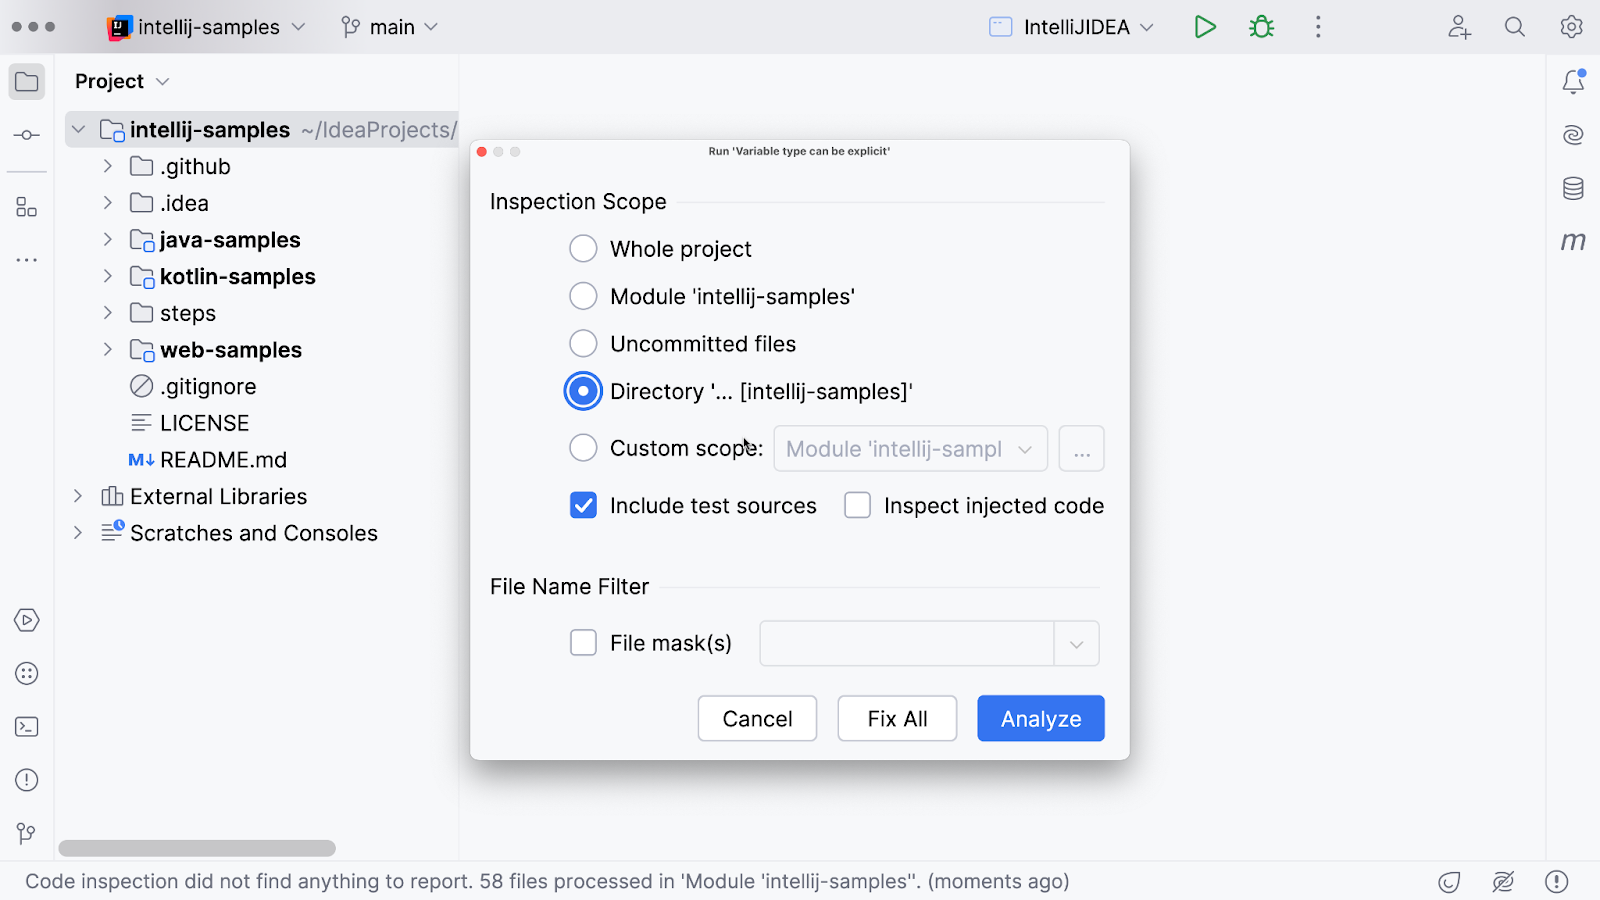
Select the scope to run this inspection on, and select either Analyze or Fix all:
- If you’re sure you want to apply the suggested fix everywhere in your selected scope, click Fix all.
- If you’d like to see what might change first or apply individual fixes, select Analyze.
If you select Analyze, the Problems tool window opens. The tab Inspections on <selected scope> shows the Inspection Results on the left and a description of the inspection on the right.
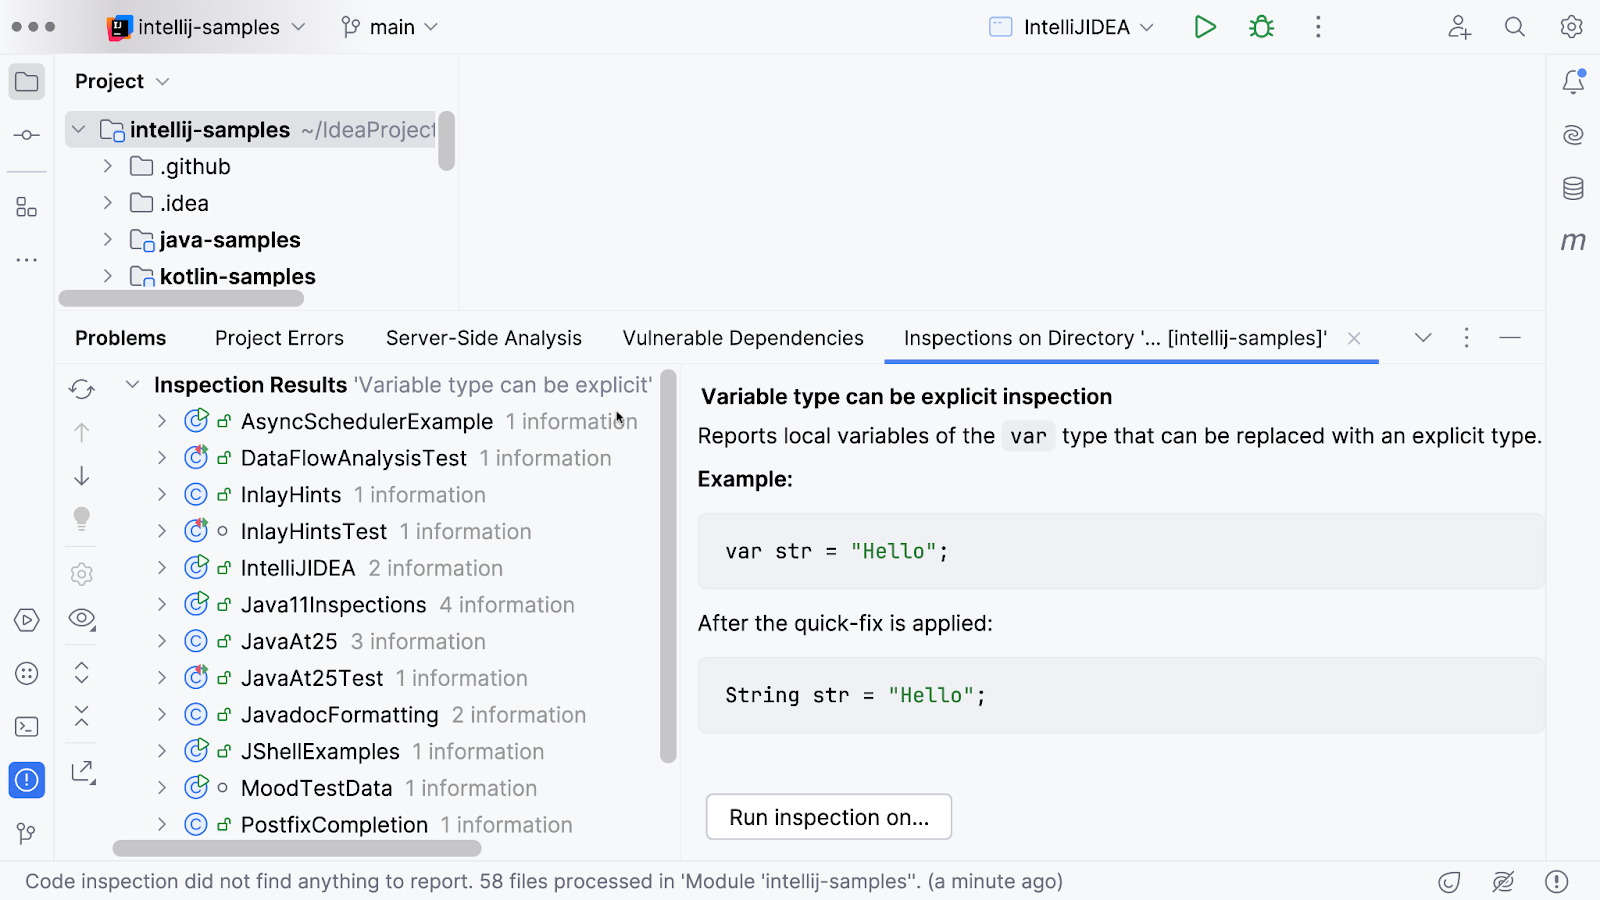
Inspection Results show the files that have problems based on the inspection you ran. Some files might have multiple occurrences of the problem; expand the files to see them all and click the file to open a preview on the right. Here, you have the option to either execute the suggested fix, in this example, Replace ‘var’ with explicit type, or Suppress the warning. Double-click the file to open it in the editor, fix any problems there, and check the results.
If you have selected Fix instead of Analyze, you can open the Commit tool window (⌘0 on macOS / Alt+0 on Windows/Linux) to look at the applied changes.
Related problems
If you’re making changes to your code that lead to problems elsewhere in your code base, IntelliJ IDEA will warn you with an inlay hint, for example if you change the method signature of a method that is called elsewhere. This works for classes and fields as well.
Check for problems when committing new code
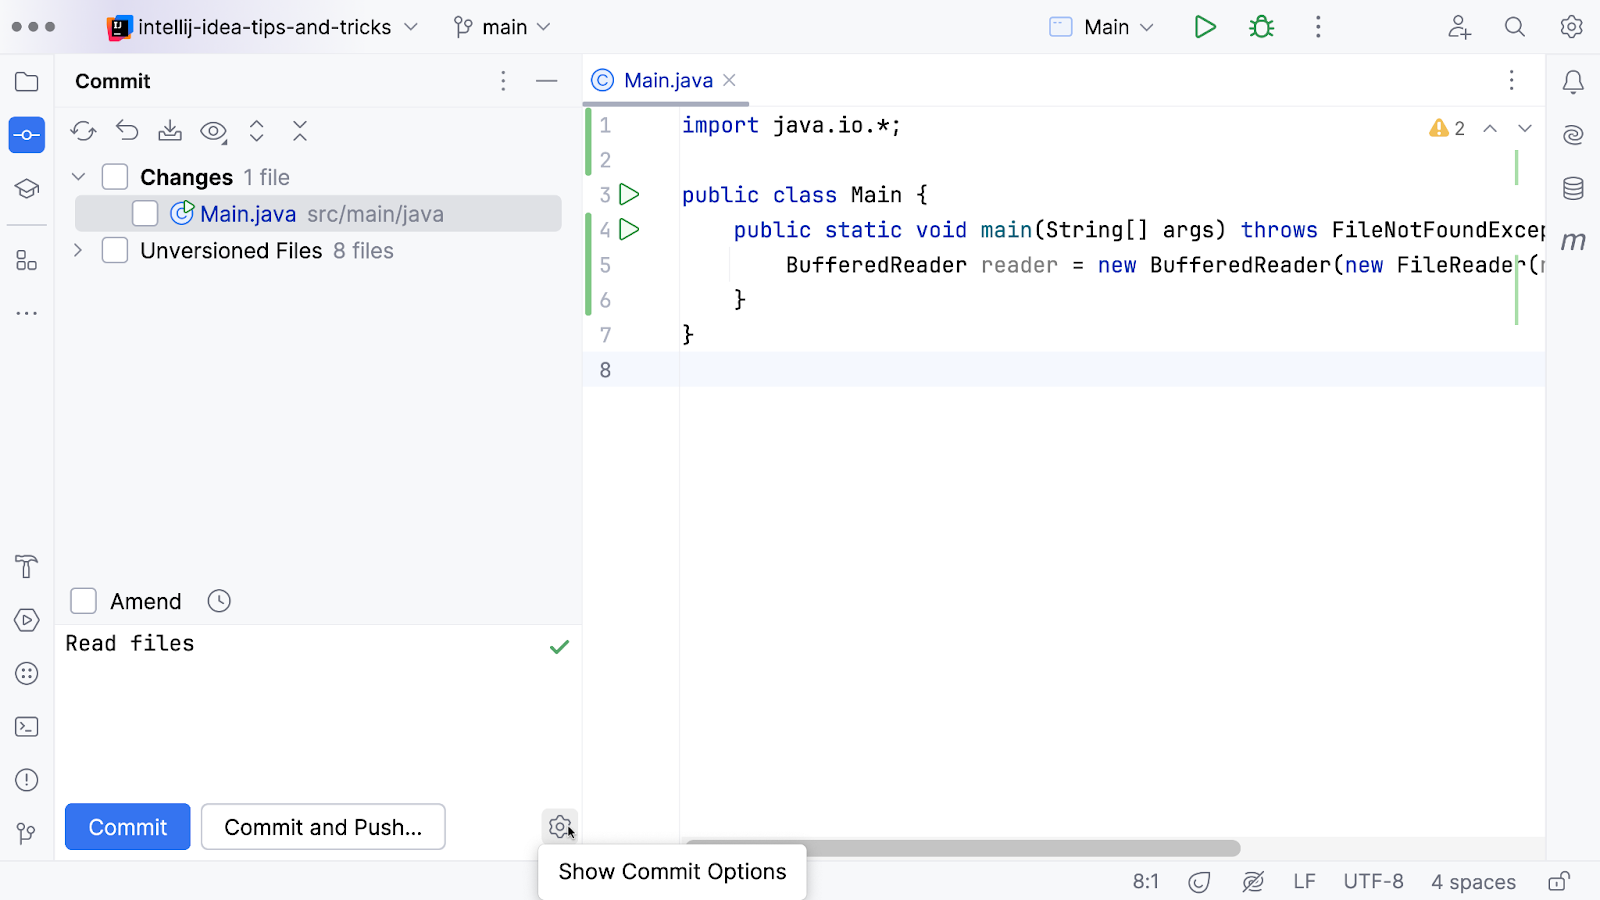
You can also configure IntelliJ IDEA to analyze your code when you create a commit and which checks should be performed on your commits. To do so, select Show Commit Options from the Commit tool window (⌘0 on macOS) / Alt+0 on Windows/Linux).
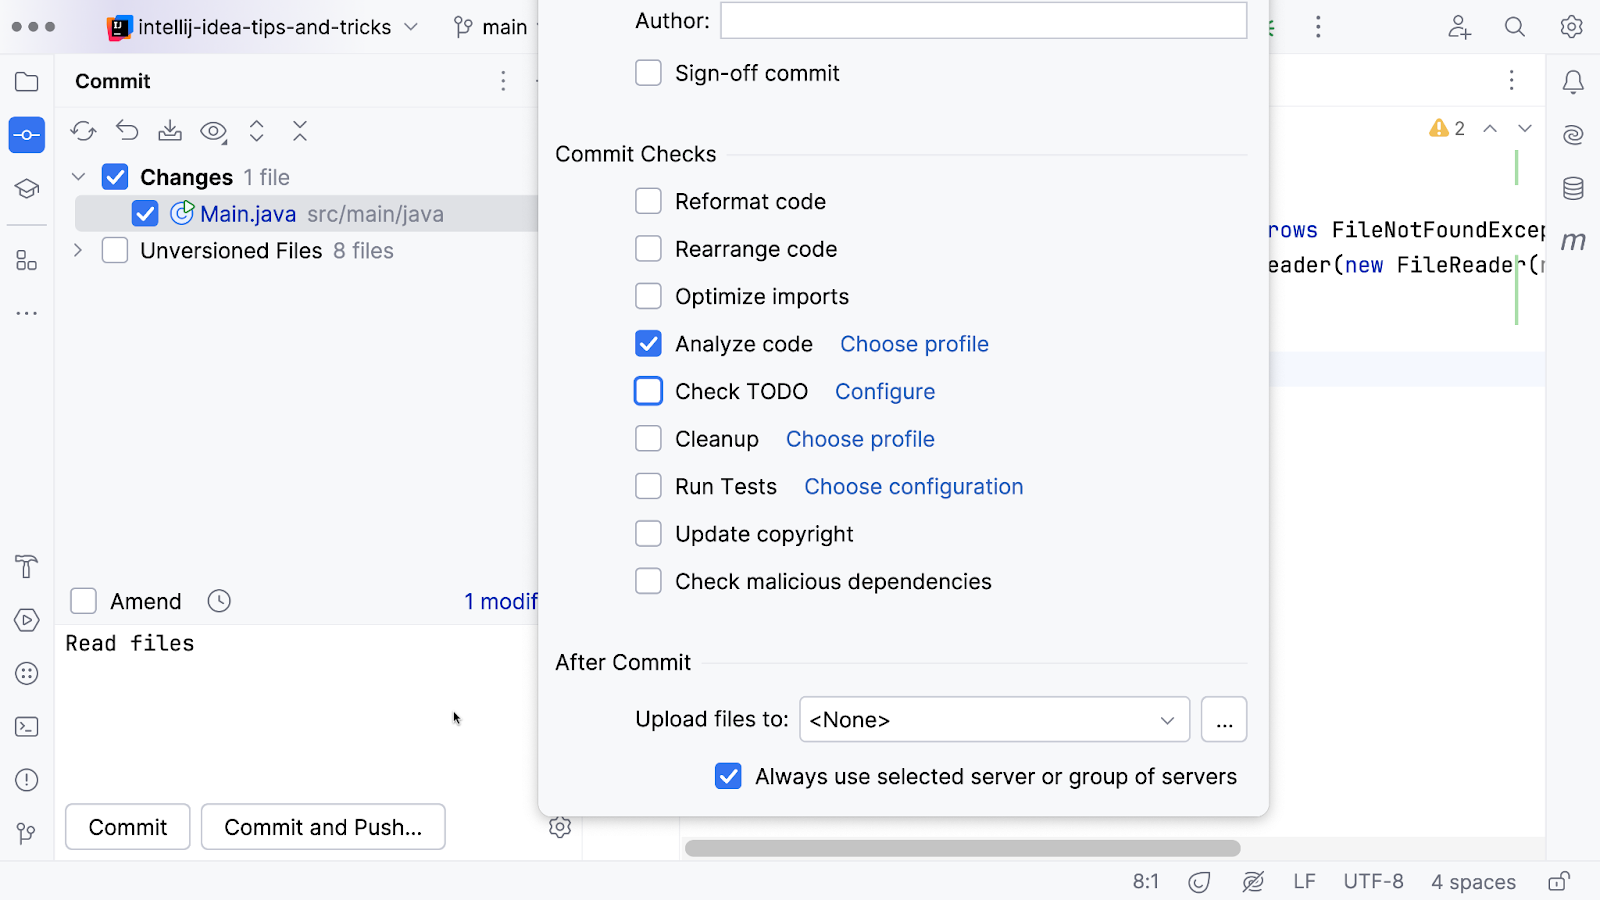
If you select Analyze code here, IntelliJ IDEA will run the inspections according to the chosen profile on the changed file(s) in your commit.
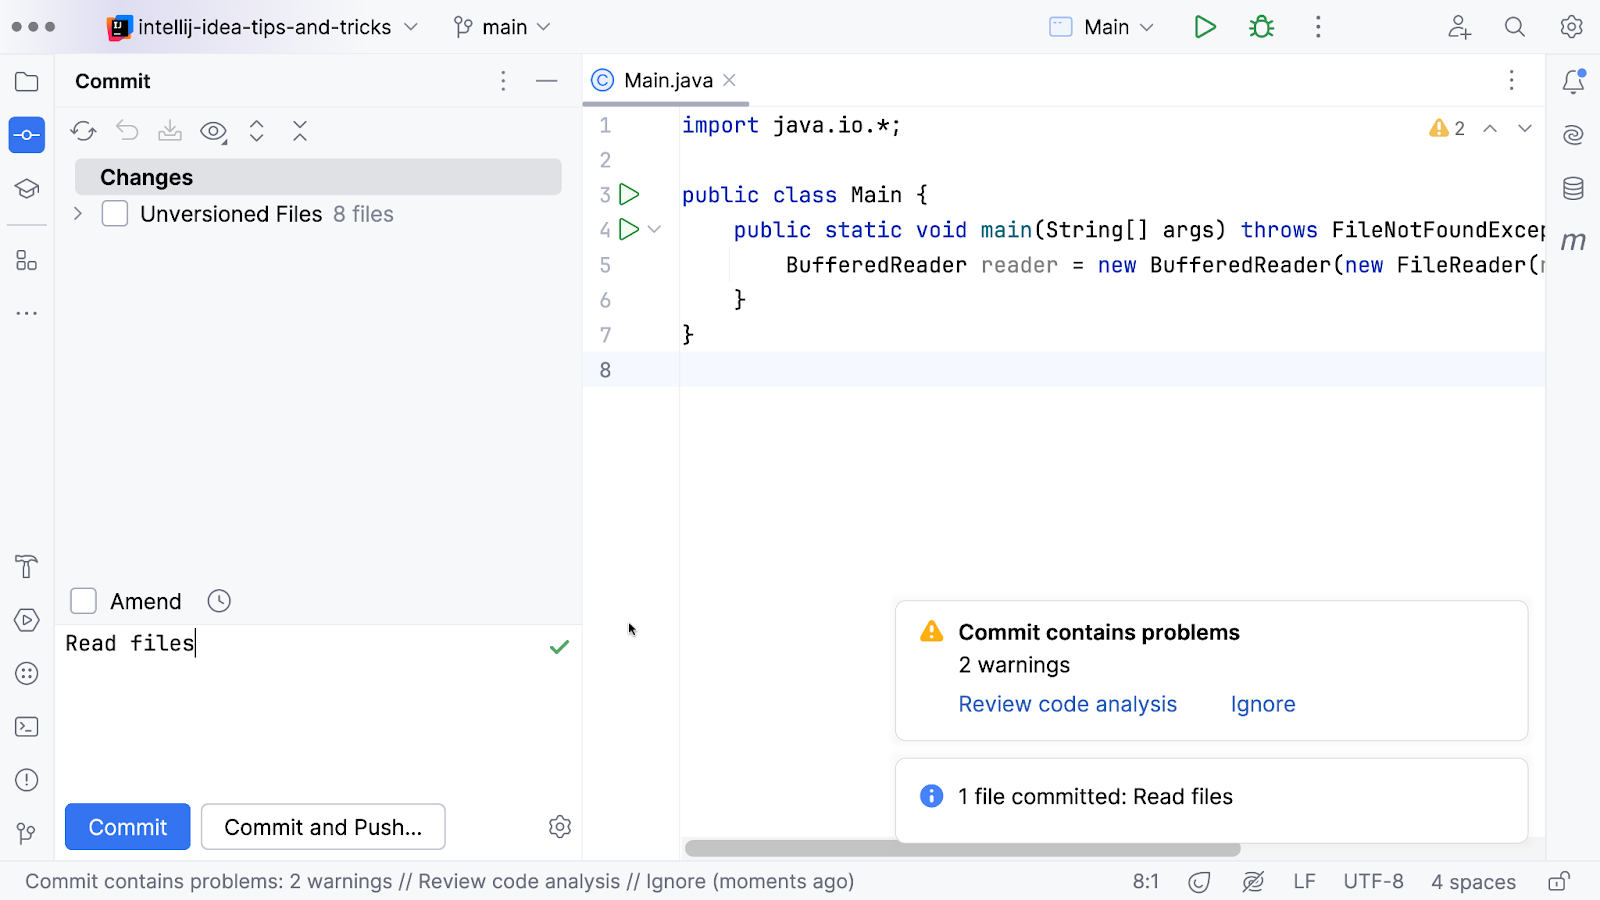
Suppose IntelliJ IDEA finds any code that may need your attention. In that case, a popup will appear in the bottom right corner, with the message Commit contains problems and listing the number and severity of these problems. Click Review code analysis to open the Code Analysis tab in the Problems tool window. Double-click any of the problems to navigate to that problem in the code and use ⌥⏎ (macOS) or Alt+Enter (Windows/Linux) to fix them. Amend your commit to include those fixes (if you haven’t pushed your commit), or create a new commit with your fixes.
Find problems throughout the project
You may also want to check for any problems throughout your entire project. Run inspections across your entire project using Code / Inspect Code from the main menu. Alternatively, open the Problems tool window (⌘6 on macOS) / Alt+6 on Windows/Linux), go to the Project Errors tab, and select Inspect Code… there.
You can specify the scope to run the inspections on and the profile to use. Use the Project Default profile, or create a custom profile. A custom profile can be used to run a subset of inspections or to include some inspections that are not run as part of the default profile. For example, if you are upgrading from one Java version to the next, you might want to create a profile to run relevant inspections, like the Java / Java language level migration aids.
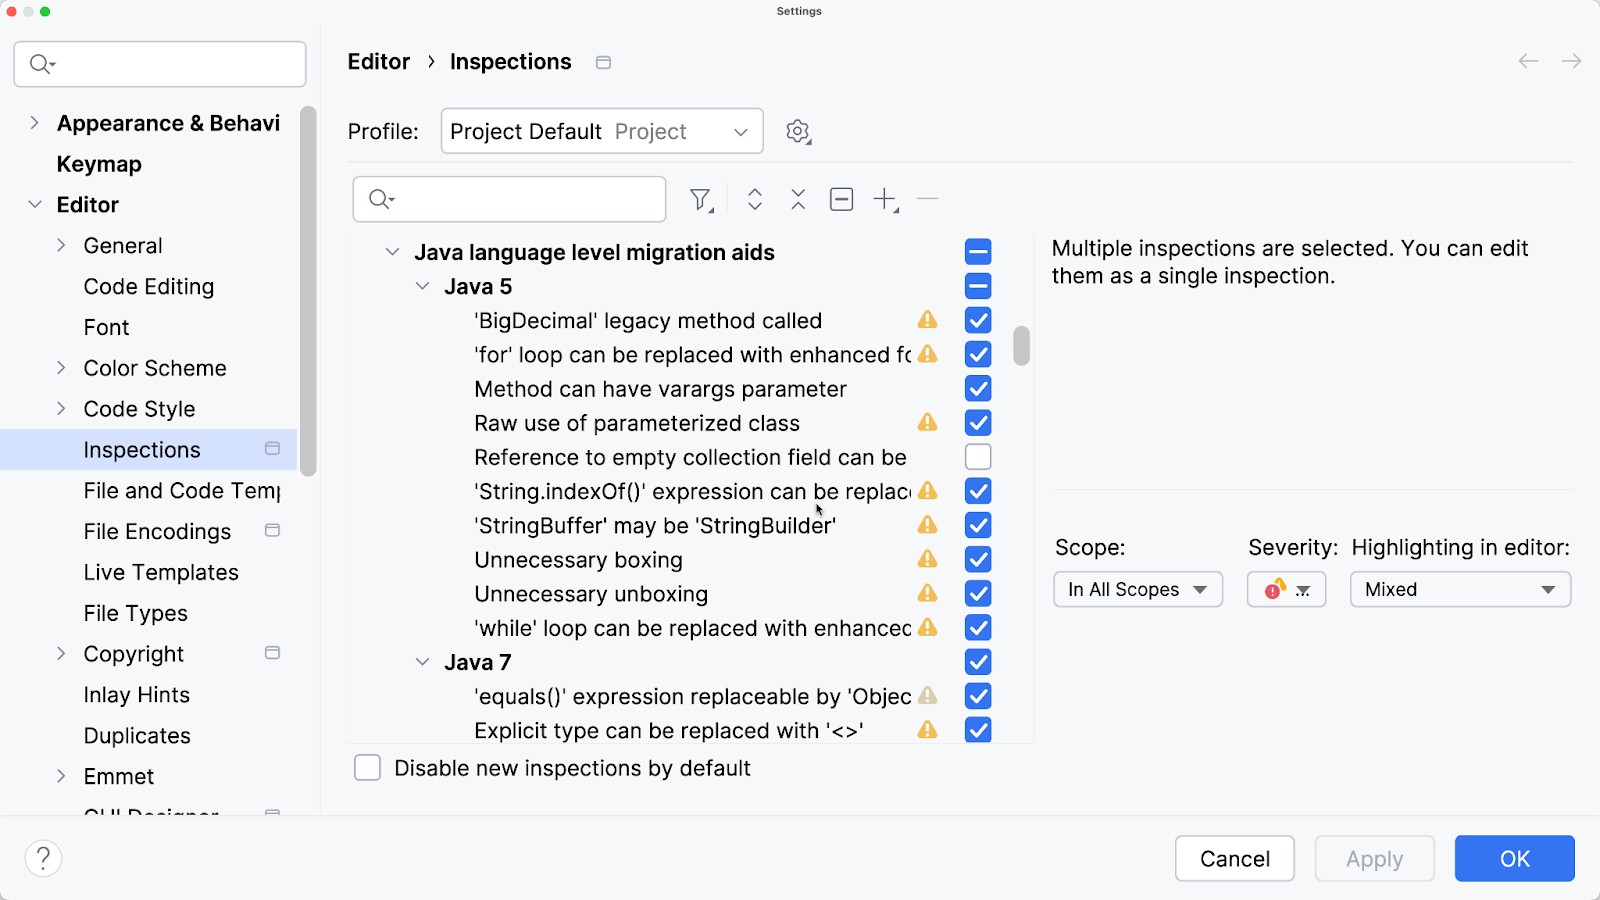
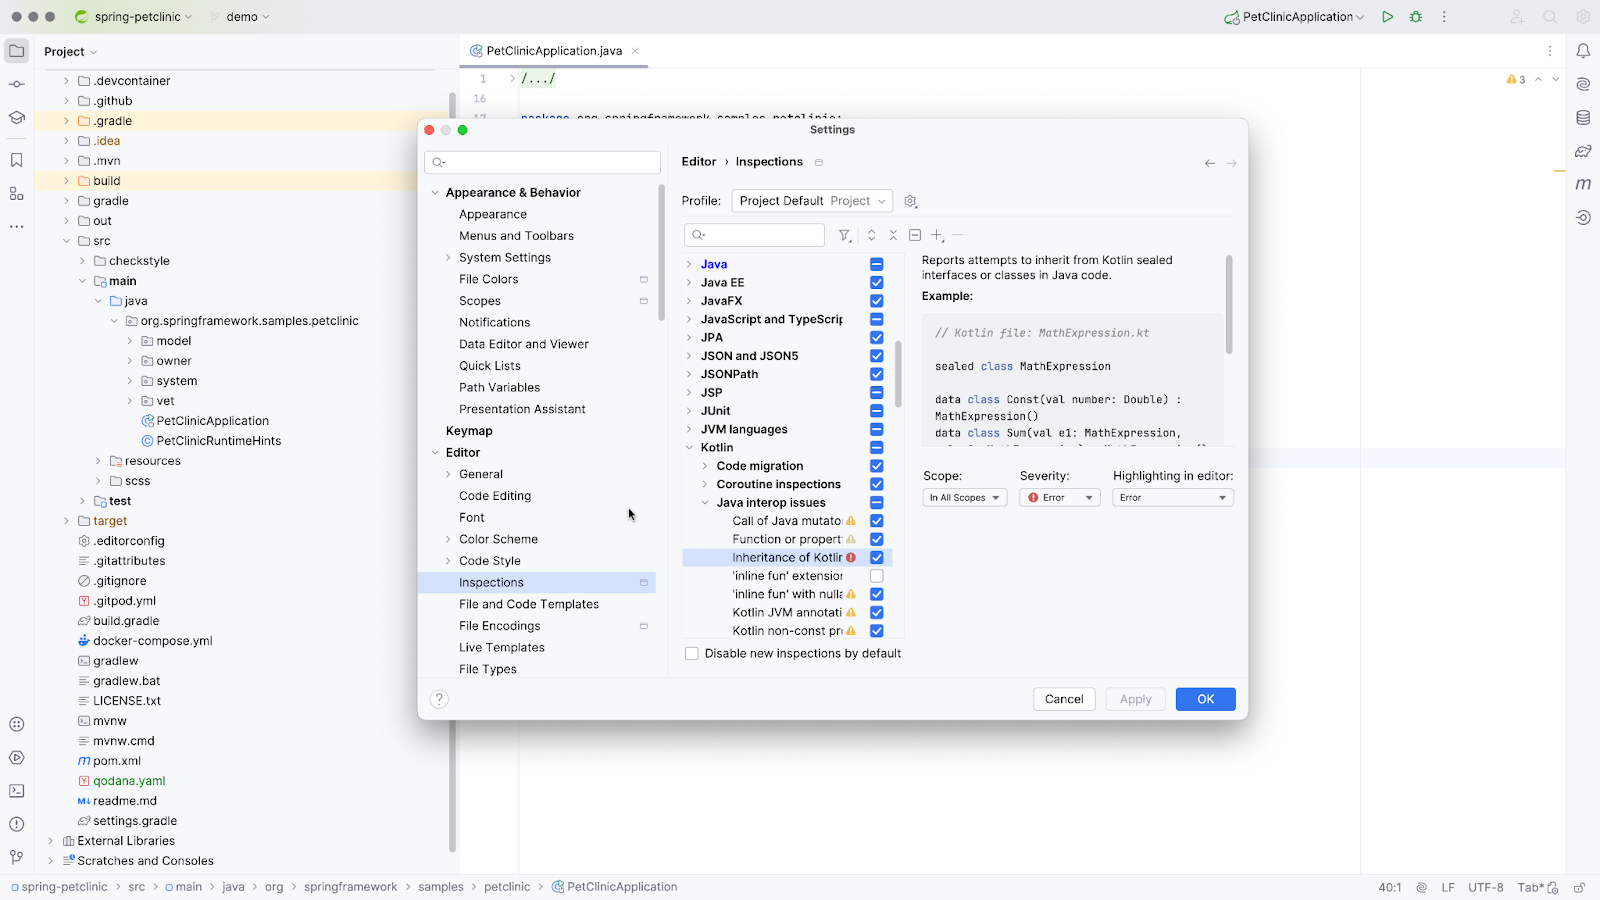
To create a custom profile, go to Settings / Editor / Inspections. Click on the Settings icon, select Duplicate, and change the profile name. Next, select the inspections you want to include in this profile.
If you want to add only a handful of inspections to the profile, start with none by clicking on Reset to Empty to unselect all inspections. Select the inspections you want to include in this profile and click OK. Now, when you run Inspect Code, you can select the newly created profile.
Similar to when you run an inspection by name, IntelliJ IDEA will show any potential problems in the Problems tool window in the Inspections on <selected scope> tab. The Inspection Results are grouped into categories, with their severity shown. To group them differently, for example, by severity, open the View Options and select Severity. You can expand the Inspection Results to drill down to a specific result to see what the problem is and how to fix it.
Note that project-wide inspections only work on Java projects.
Run inspections in CI/CD pipelines with Qodana
In addition to running inspections in your IDE, you can inspect your code using Qodana. Using Qodana, you can run IntelliJ IDEA inspections locally and include them in your CI/CD pipelines, which we will discuss later.
To try out Qodana, you can enable Qodana locally for your project by going to the Problems tool window (⌘6 on macOS) / Alt+6 on Windows/Linux) and clicking on the button Try Locally.
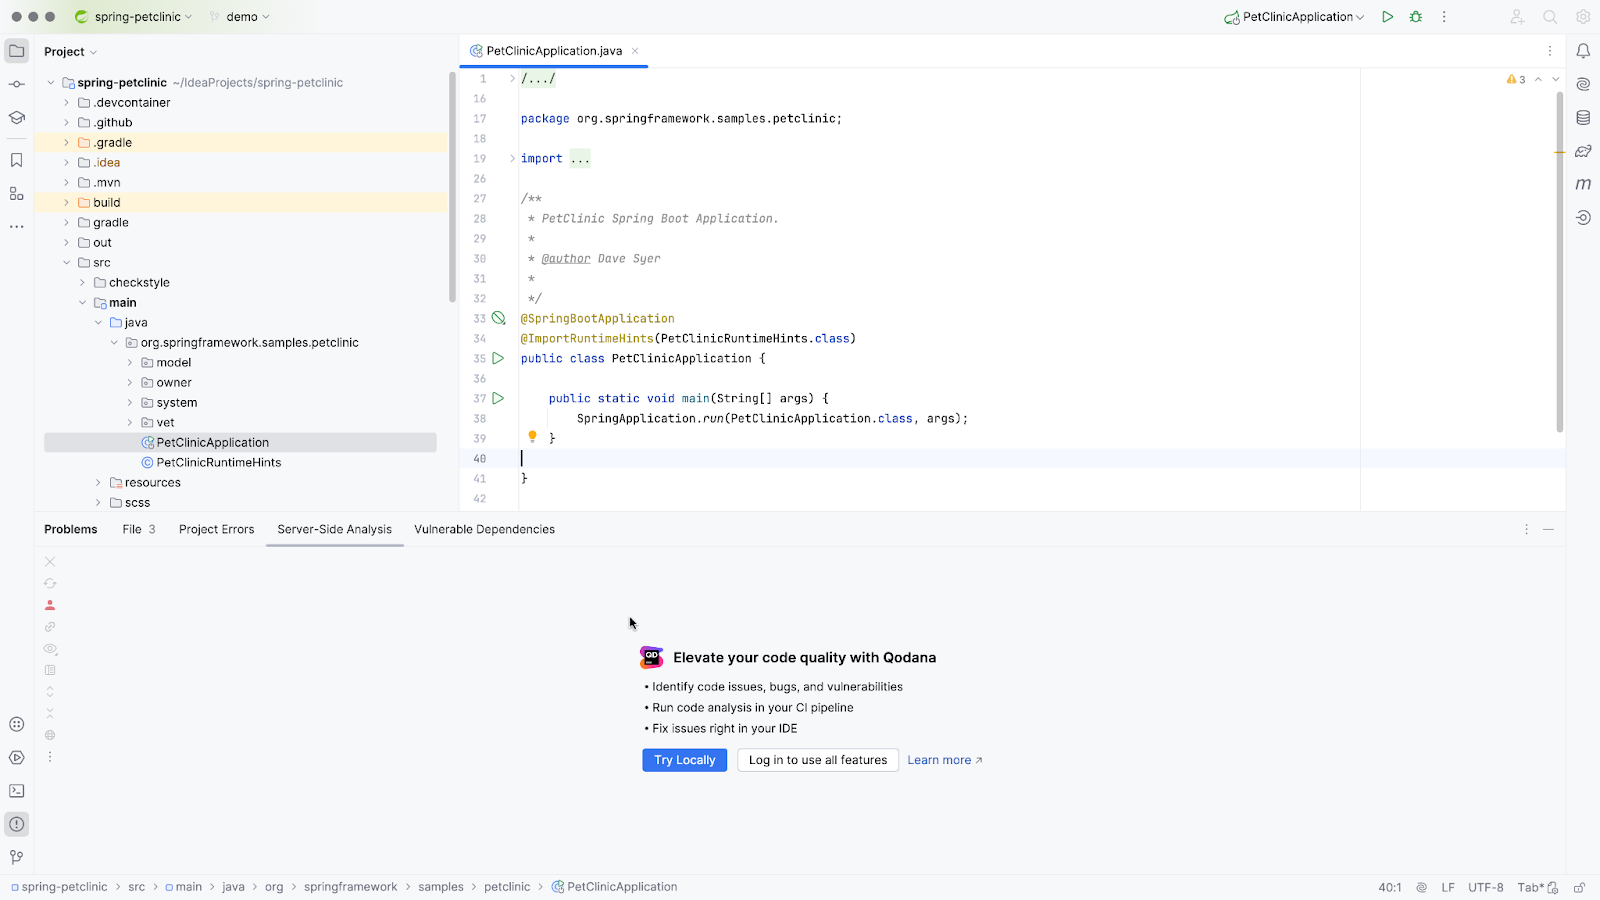
This will add a `qodana.yaml` configuration file to your project and run Qodana inspections on your project as defined in that configuration file. You can see the Inspection Results in the Problems tool window / Server-Side Analysis tab or open them in the browser using the link Open Qodana report in browser. See the results in your browser and add additional inspections to your configuration as needed.
You can also run Qodana in your CI/CD pipelines. This allows you to run resource-consuming inspections in your CI/CD pipelines and to enforce quality standards with quality gates in your CI system. It enables you to access inspections that are only available in Qodana, like license audits and security checks, for example, finding hard-coded passwords in your code base. In addition, you can access historical overviews of inspection results and compare the current state of your project with a baseline to see new, unchanged, and resolved problems.
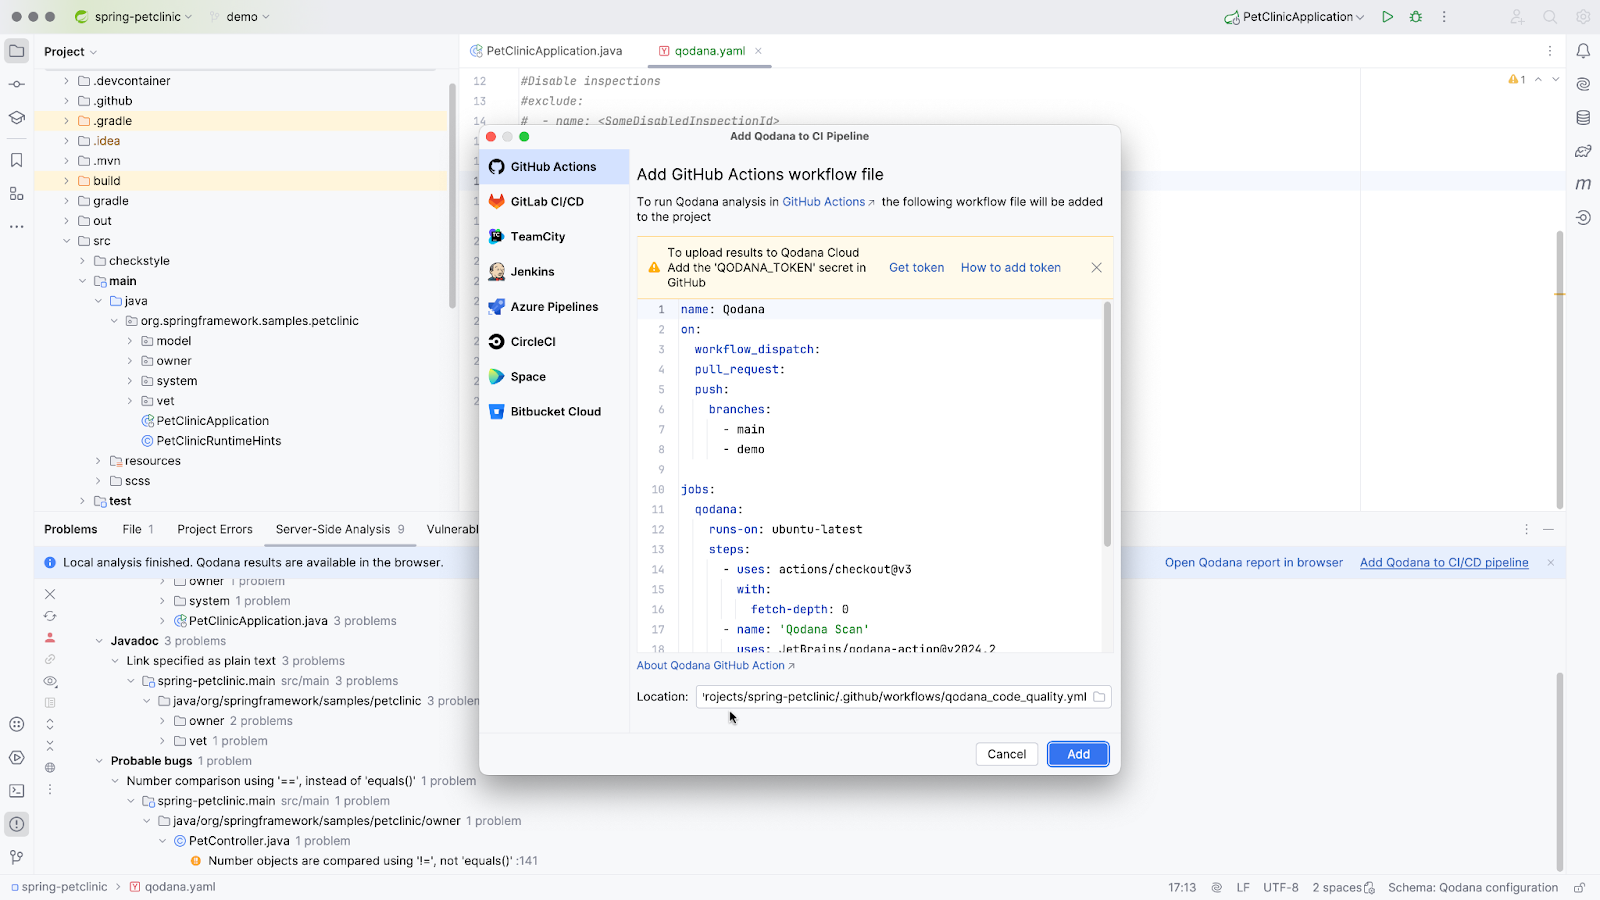
To integrate Qodana with your CI system, have a look at the documentation. Integration guides are available for the most popular CI tools. If you’d like to learn how to integrate Qodana static analysis into your project, we recommend watching this livestream.
Qodana now also includes Spring-specific inspections. You can find the full list of inspections for Spring Framework in IntelliJ IDEA under Settings / Editor / Inspections by searching for “Spring” to filter out irrelevant inspections. For more information on inspections for Spring, see this blog post.
Overview of inspections
You can see the full list of inspections in your IDE. Open Settings (⌘, on macOS) / Ctrl+Alt+S on Windows/Linux), and go to Editor / Intentions. Inspections are grouped by languages and frameworks.
Each group has a checkbox next to it. A check mark indicates that all inspections in this category have been enabled. A missing check mark or any other mark indicates that all inspections have been disabled, and a minus sign indicates that some of the inspections are enabled and some are disabled, which also means that not all the inspections are enabled by default. You can enable or disable inspections depending on how applicable they are to your project. You can also change the severity of inspections, for example, if you want to make sure to use new language features.
Alternatively, you can find more information about available inspections on the Inspectopedia website.
Conclusion
Running automated checks on your project can help you find and fix problems throughout your entire project. Run checks locally using IntelliJ IDEA and/or Qodana, or add automated checks to your CI/CD pipeline using Qodana. You can use inspections to improve the style and quality of your code, as well as to prevent security issues.
In the next part of this series, we will look at some more advanced code analysis features in IntelliJ IDEA. Subscribe to our blog if you don’t want to miss it.