IntelliJ IDEA
IntelliJ IDEA – the Leading IDE for Professional Development in Java and Kotlin
IntelliJ IDEA 2024.3 EAP 7: Enhanced AI Assistant for VCS, Debugger Updates, and More
We’re back with another set of features and improvements in the latest IntelliJ IDEA 2024.3 Early Access Program build!
You can download this version from our website, update directly from within the IDE, use the free Toolbox App, or install it via snap packages for Ubuntu.
As we start winding down the Early Access Program for 2024.3, now is a great time to try out the new features and share your feedback with us. Check out the previous 2024.3 EAP blog posts and take a look at what’s new in IntelliJ IDEA 2024.3 EAP 7.
AI Assistant
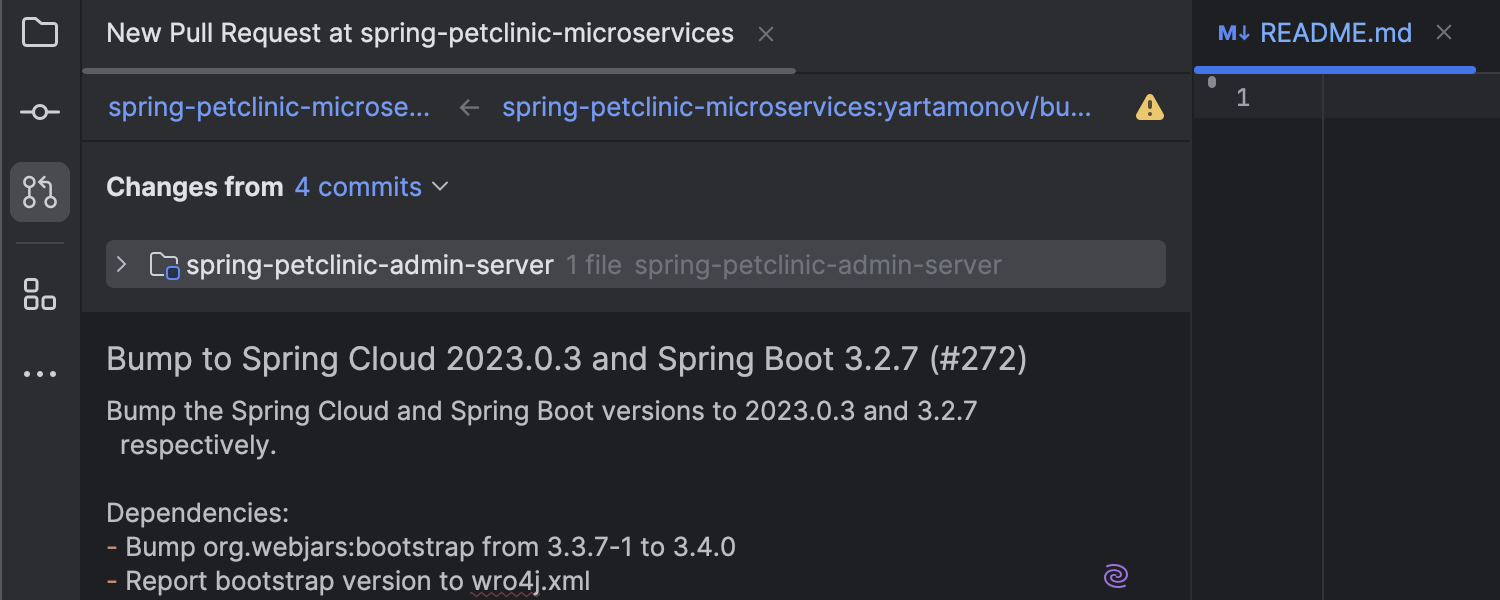
Pull/merge request title and description generation
AI Assistant now helps generate accurate titles and descriptions for your pull/merge requests directly from the IDE, streamlining your workflow and ensuring your descriptions are clear and concise.
User experience
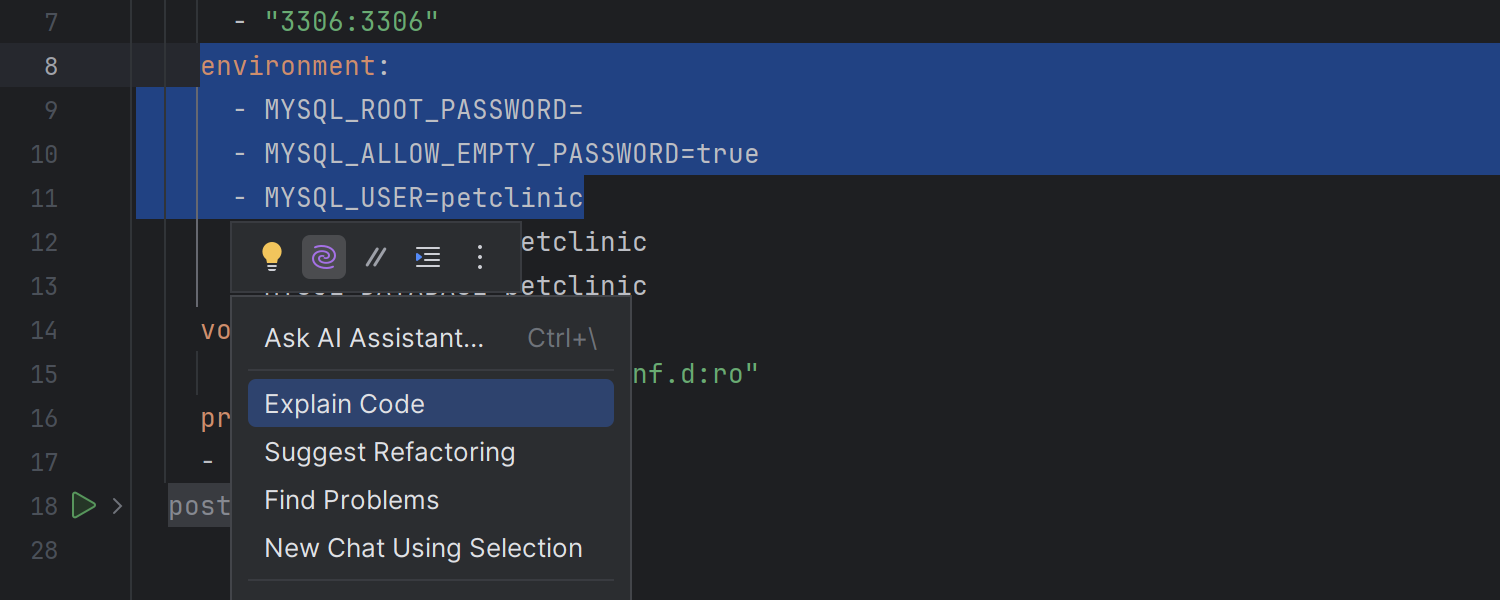
Floating toolbar for JSON, XML, YAML and SQL files
We’ve enabled the floating toolbar for JSON, XML, YAML and SQL files, which makes accessing context-based and AI-driven actions easier. Simply select any code, and the toolbar will appear to display available actions.
Profiler
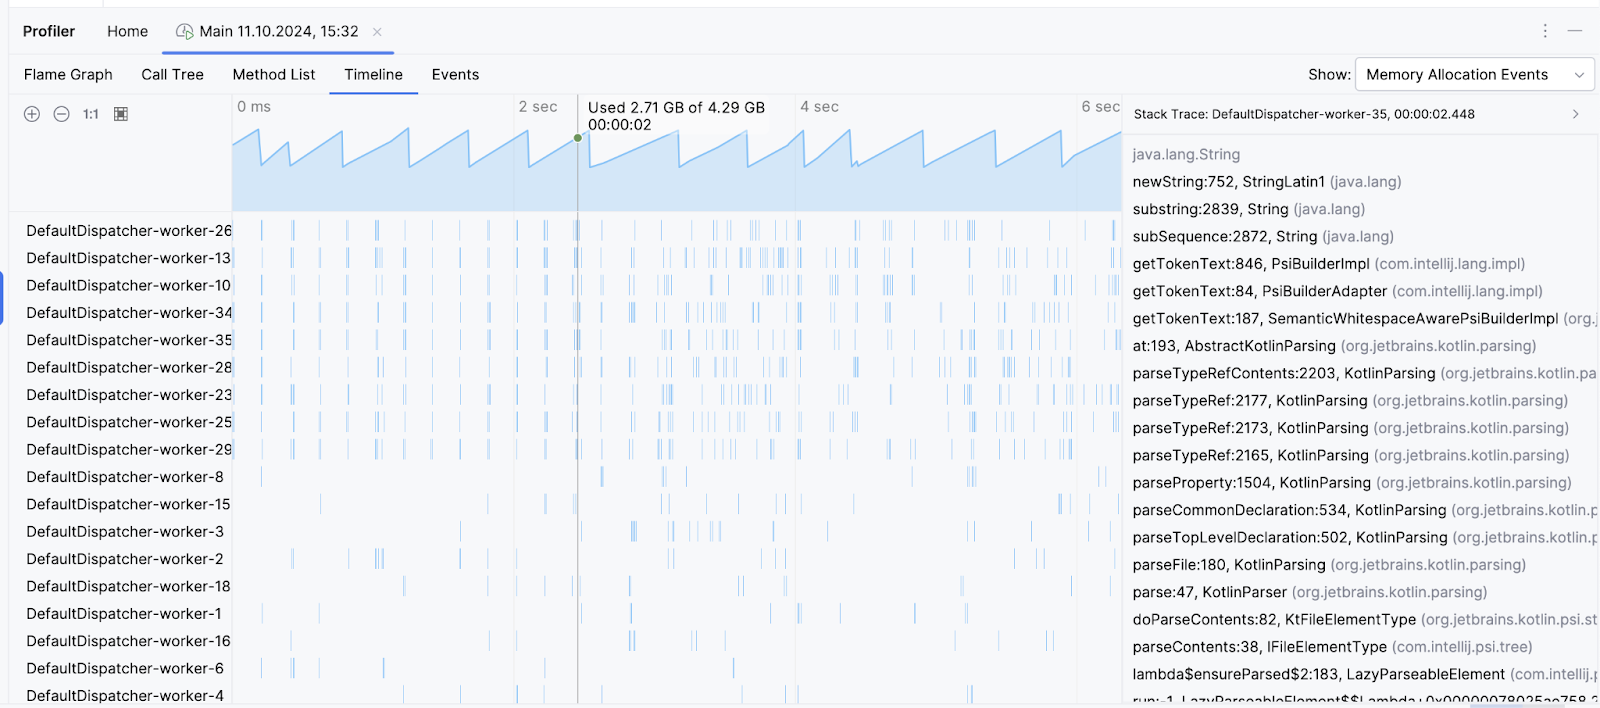
Heap memory usage graph
The profiler has been enhanced with a heap memory usage graph, which is displayed in the Timeline tab above the thread lanes. This new visualization helps you link memory allocations with thread activity, providing valuable insights that can reveal potential memory leaks and performance bottlenecks.
Debugger
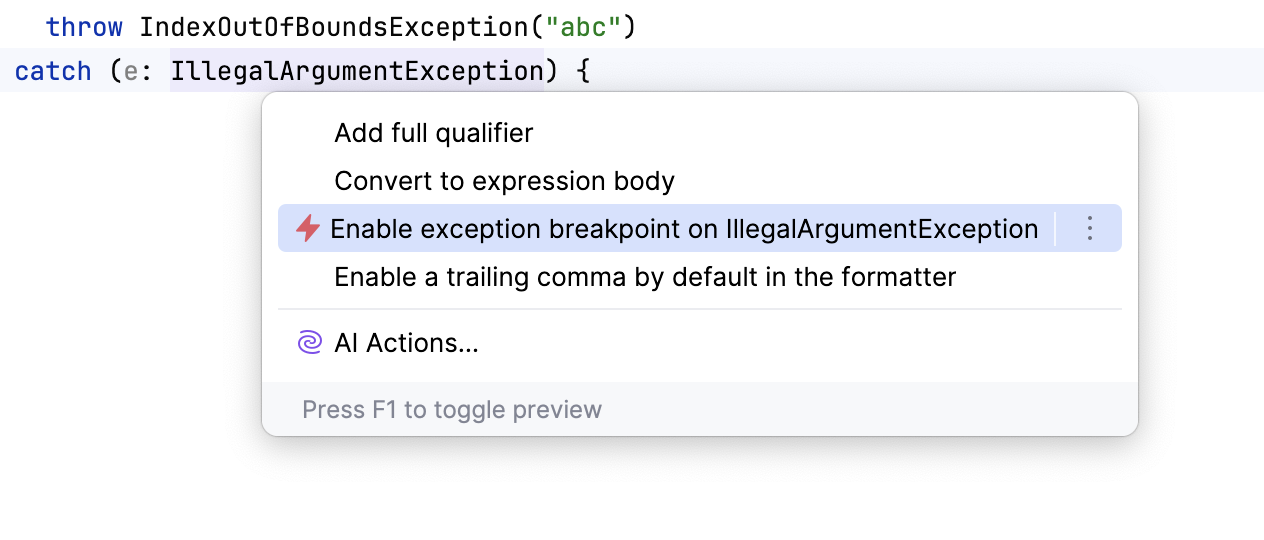
Intention action to create exception breakpoints
You can now set exception breakpoints from the editor. While at the throw or catch site, open the context menu via ⌥↩ on macOS or Alt+Enter on Windows/Linux, then select Enable exception breakpoint. This new feature makes it more convenient to set exception breakpoints without needing to open the Breakpoints dialog or browse the stack trace in the console.
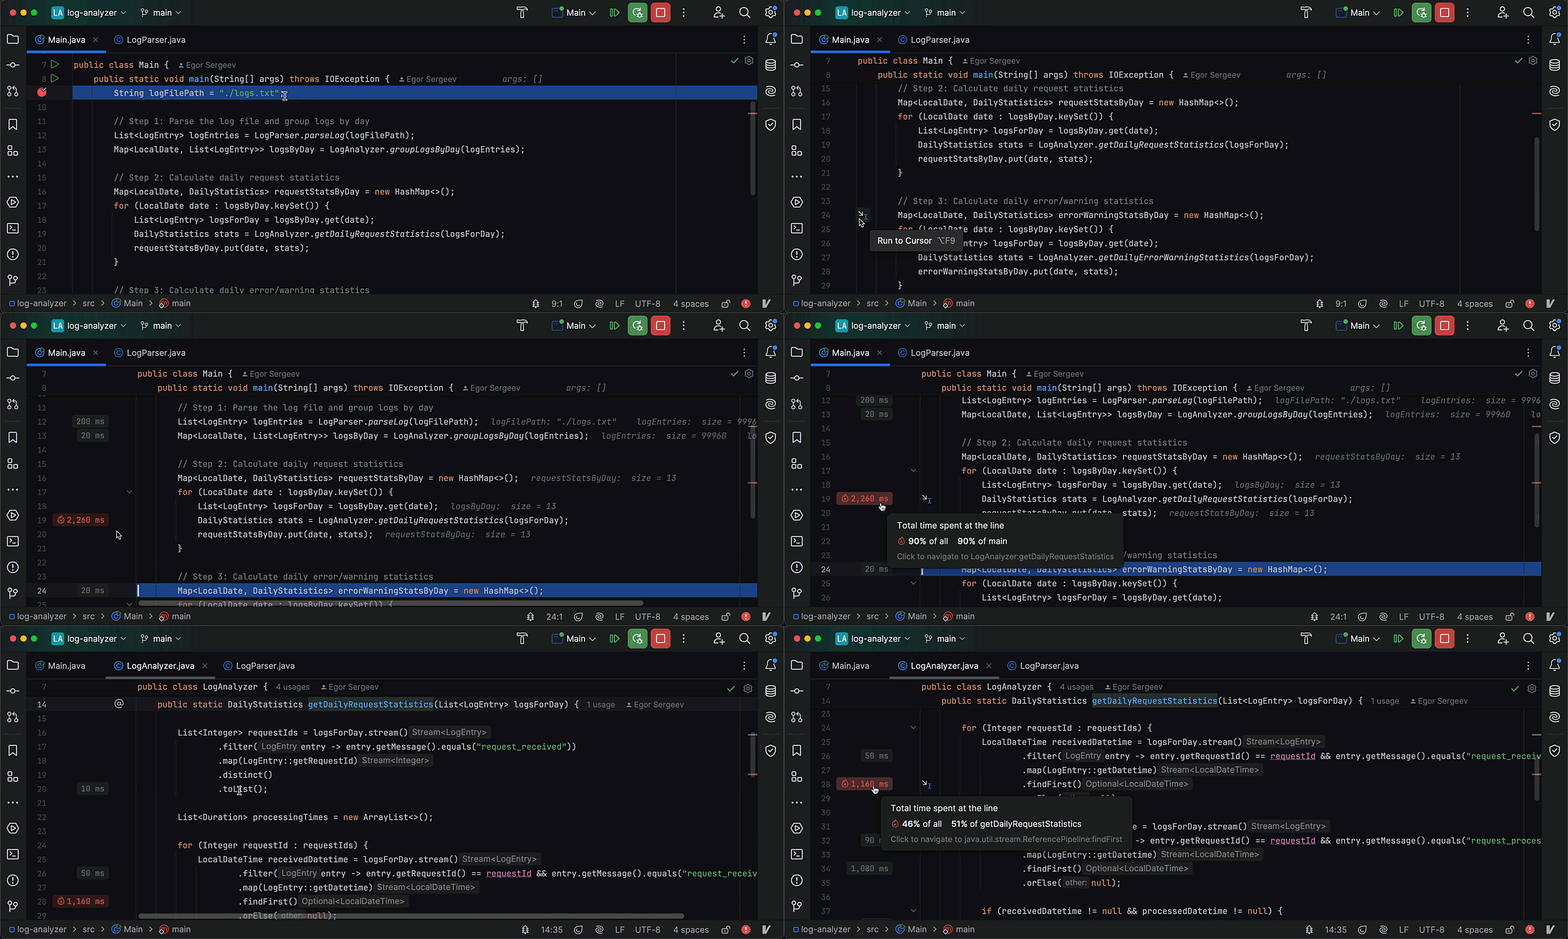
Line execution time hints
This new version eliminates the necessity to clutter your code with logs and timers when you want to measure the execution time for a bunch of lines. After invoking the Run to Cursor action – previously only helpful with stepping – you will see the execution times for each line right in the editor’s gutter. For deeper analysis, use the same hints on the gutter to drill down to the called methods, whose respective lines will also be accompanied by the execution time data.
Frameworks and technologies
Update on the workspace feature
We are continuing our work on improving workspaces, guided by the massive feedback we received from the blog post and webinar. In this update, we’ve fixed the most frustrating bugs and are focusing on three main areas:
- Enhancing the UX for a smoother workspace experience (e.g. IDEA-359180).
- Updating the algorithms for working with project settings (e.g. IDEA-353410, IDEA-354174).
- Strengthening VCS integration with particular focus due to its impact across all JetBrains IDEs. We have several tickets under IDEA-359173 to address this.
While workspaces will remain a separate plugin in this release, we’re planning to integrate it into IntelliJ IDEA by the next major release – 2025.1. Please keep the feedback coming, and feel free to vote for the issues that matter most to you on YouTrack!
That’s all for IntelliJ IDEA 2024.3 EAP 7! For the full list of updates, review the release notes for this build.
We’re nearing the final stages of this Early Access Program, so don’t miss the chance to explore these new features and improvements. Your feedback is invaluable and helps us refine the product, so please continue sharing your thoughts in the comments section below or on X. If you encounter any issues, use our issue tracker to report them.
Stay tuned for more updates, and as always, happy developing!


