IntelliJ IDEA
IntelliJ IDEA – the Leading IDE for Professional Development in Java and Kotlin
Thread Dumps and Project Loom (Virtual Threads)

If you’ve been keeping up with Java virtual threads, you already know that this hot new feature significantly improves hardware utilization for parallel I/O-bound operations. Virtual threads map multiple concurrent I/O operations to a single OS thread without blocking. The novel aspect of this approach is that it requires minimal changes to the codebase, as it provides a lightweight concurrency primitive that is compatible with the existing APIs.
This is, of course, great news for Java developers. Previously, achieving similar results meant writing complex callback-based pipelines or relying on reactive Java frameworks that were far from simple.
Aside from a few minor details, Java virtual threads really are as great as they sound. The API is simple and familiar, with throughput increasing by up to a few orders of magnitude. Where servers once managed only a few hundred threads, they can now handle millions.
So what does this mean for the rest of the ecosystem?

The state of tooling
Virtual threads pose quite the challenge to existing Java tooling. Your UI-based thread dump viewer or debugger may now present you with millions of rows, and simply displaying them can be a struggle. And even if it succeeds, there is still a UX issue. How is the user supposed to navigate all that information?
Or take, for example, a classic async debugging problem: Scheduler and worker code are typically called in different threads, rendering the worker’s stack trace logically incomplete. Since a task starts in one thread and fails in another, the error’s stack trace misses the path that schedules the task. And that path might be important for understanding the cause of the problem.
Although the Java ecosystem has been doing a good job adapting to change, some gaps remain. Each challenge is multifaceted and could warrant a post of its own. In the rest of this article, we’ll dive deeper into one of these challenges: thread dumps and how to use them effectively.
Thread dumps
Speaking of tooling and concurrency, the first thing that comes to mind is thread dumps!
A deadlock? An unresponsive UI? Thread explosion or leak? When investigating any of these issues, a thread dump is usually the starting point. Simple yet powerful, thread dumps are one of the best tools for diagnosing multithreading problems. In the best-case scenario, thread dumps will pinpoint exactly where the problem lies. At the very least, they’ll give you an idea of where to start your investigation.
A thread dump tool captures the state of the application at a given moment and produces a structured text report on every thread in the application. You can view the report as text or use a specialized thread dump viewer, like the one in IntelliJ IDEA:
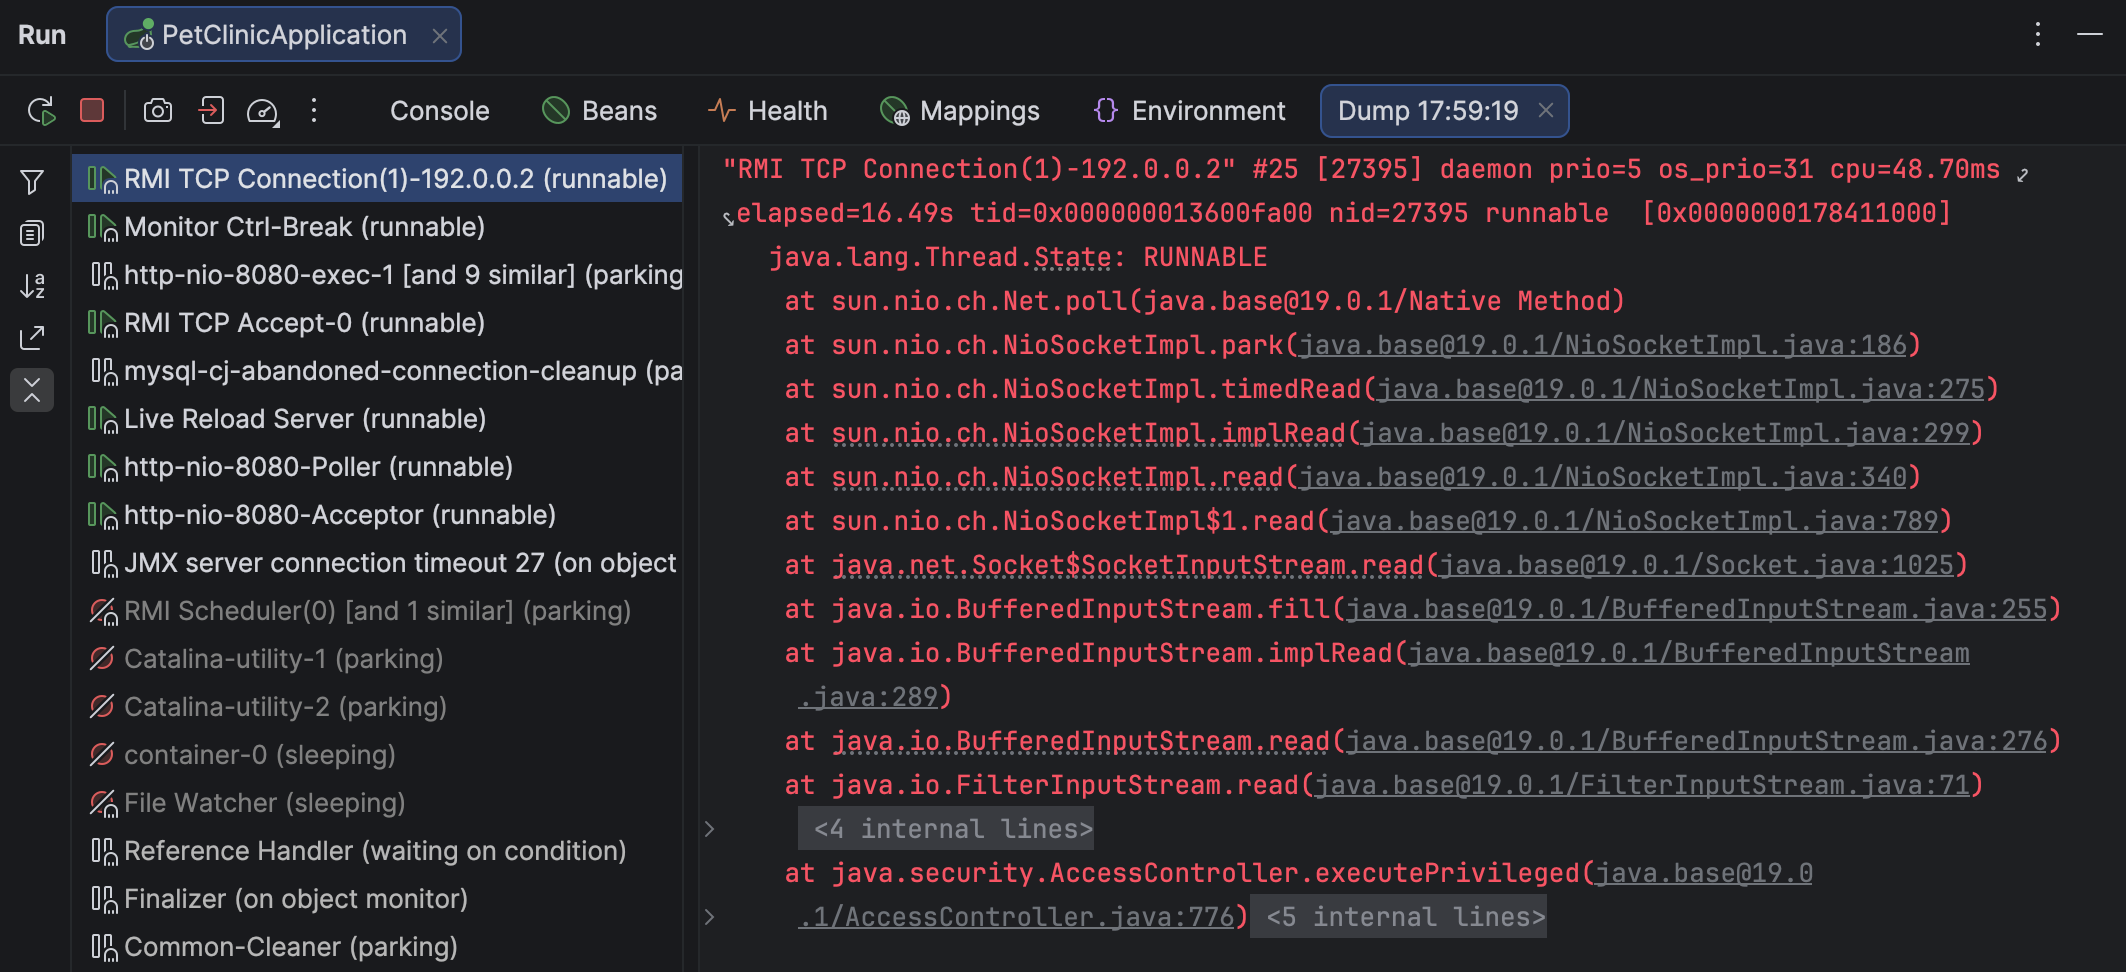
There are several tools that can capture and view thread dumps. Despite some variance in format and scope, thread dumps produced by different tools generally appear similar.
Here’s an example of how a thread is described in a thread dump:
"main" prio=5 tid=0x000001f3c9d13000 nid=NA runnable
  java.lang.Thread.State: RUNNABLE
    at java.net.SocketInputStream.socketRead0(Native Method)
    at java.net.SocketInputStream.socketRead(SocketInputStream.java:116)
    at java.net.SocketInputStream.read(SocketInputStream.java:171)
    at java.net.SocketInputStream.read(SocketInputStream.java:141)
    at sun.nio.cs.StreamDecoder.readBytes(StreamDecoder.java:284)
      - locked <0x00000007ab1d3fa8> (a java.io.InputStreamReader)
    at sun.nio.cs.StreamDecoder.implRead(StreamDecoder.java:326)
    at sun.nio.cs.StreamDecoder.read(StreamDecoder.java:178)
A thread dump includes the threads’ stack traces, metadata, status, and the related locks.
Virtual thread dumps
Since virtual threads work differently under the hood, they require dedicated support. In addition to IntelliJ IDEA, common tools for capturing virtual threads include jcmd and jstack. As mentioned above, regular thread dump tools vary in terms of format and the level of information they provide. Your preference for one tool over another may be based on your specific use case.
The Netflix story
To make this more concrete, let’s look at an example from Netflix. For those who missed this post, we highly recommend reading it. It’s a captivating technical deep dive from engineers doing impressive things in Java, and it’s also relevant for our discussion here.
In short, after upgrading to virtual threads, Netflix engineers discovered an issue where some endpoints stopped serving traffic even though the JVM was still running. To get a better idea of what was going on, the team analyzed locks using a heap dump (!) and reverse-engineered Java concurrency classes. This investigation revealed a deadlock related to a limitation in virtual threads. This bug was later fixed in Java 25.
Clever though their methods may have been, it’s hard to deny that a thread dump with more comprehensive information would have made the investigation much easier.
Getting lock information for virtual threads
If you use IntelliJ IDEA, you’re in luck! The IntelliJ IDEA team prioritizes new Java releases, so whenever Java adds a shiny new feature, you can rest assured that the IDE will support it from the get-go. Later in this post, we’ll discuss the capabilities of IntelliJ IDEA’s thread dump tool, but for now, let’s stick to the problem.
Using the gist provided in the original article, we can set a breakpoint at the line that catches the deadlock and run the reproducer while debugging:
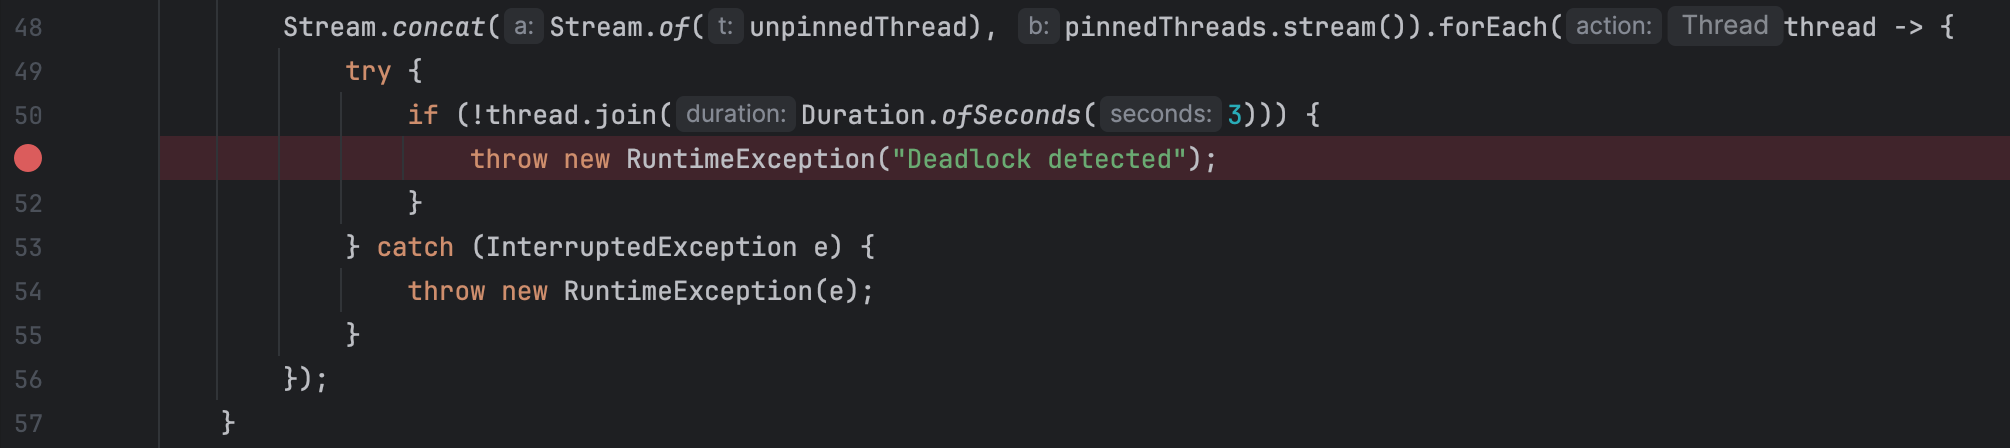
We use a breakpoint here because the gist would otherwise finish too quickly for us to capture a thread dump in time. In real-world applications, you can capture a thread dump at any moment without suspending the program. To do this, go to More | Get thread dump on the Debug tab for the target app.
IntelliJ IDEA opens the thread dump, indicates thread statuses, groups similar threads, folds stack traces, and provides navigation back to the source code. Selecting a waiting virtual thread shows the same information as for a platform thread, including details about the acquired locks:
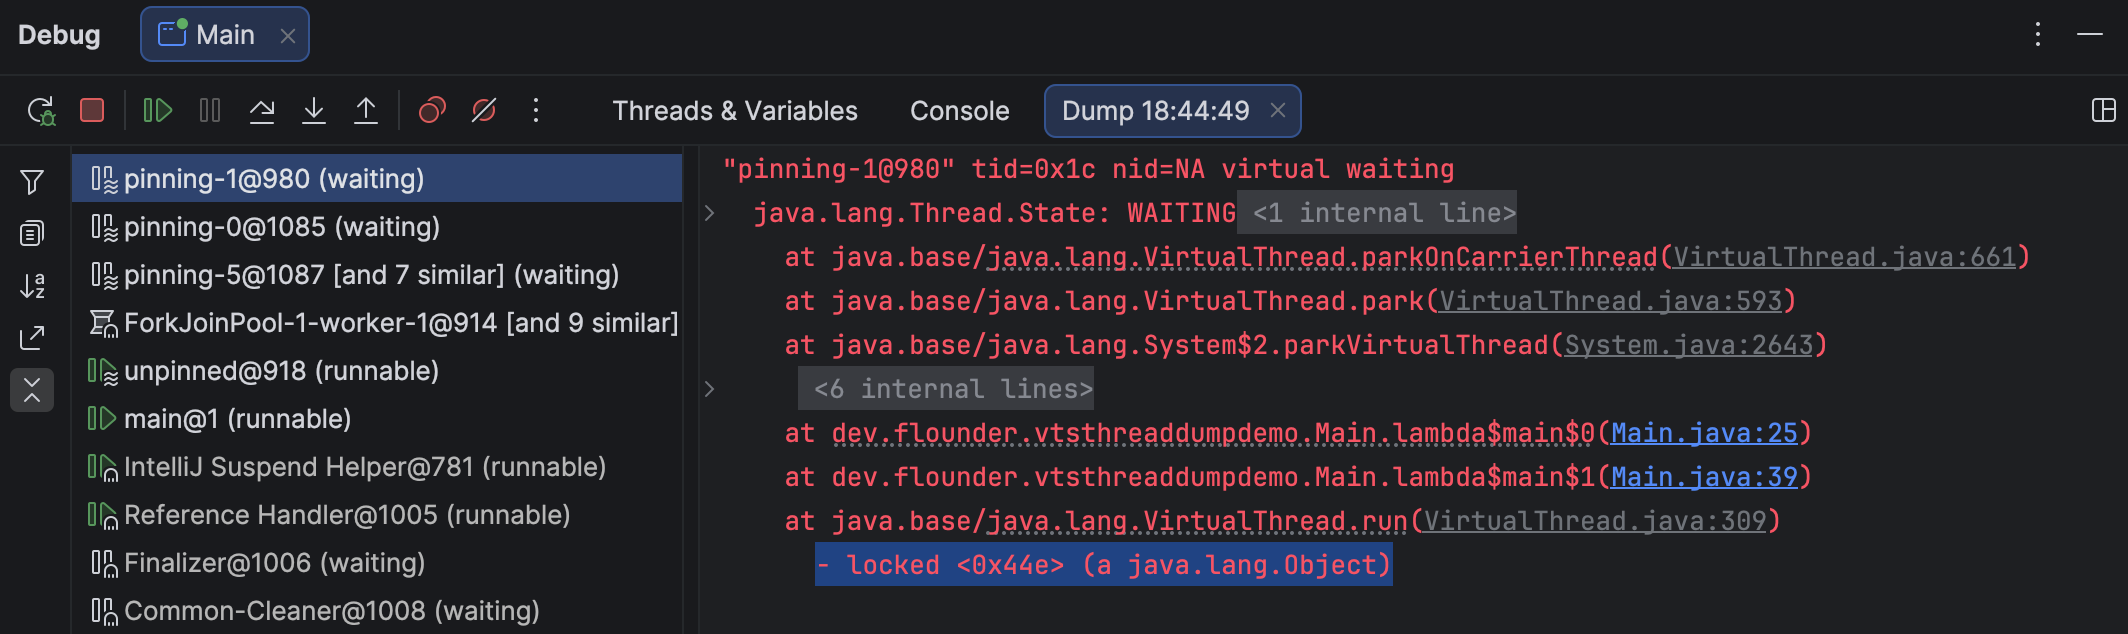
In this simplified example, the virtual threads synchronize on a new Object(), so finding this specific lock isn’t particularly useful. Still, the information is there – and invaluable when diagnosing real-world problems.
Supported targets
IntelliJ IDEA can attach to any Java or Kotlin process, whether local or remote.
When working in a remote environment, you can capture the processes remotely and view and export the dumps locally.
Thread dumps don’t have to come from IntelliJ IDEA at all. If someone provides a dump generated with another tool, such as jcmd, IntelliJ IDEA can open and analyze it just as easily as its own native dumps. We constantly monitor the planned changes throughout the ecosystem, so you can count on support for both the earlier and recent versions.
And as a bonus for Kotlin users: IntelliJ IDEA supports not only virtual threads, but Kotlin coroutines as well!
Summary
Java is ramping things up and bringing modern features into the domain of concurrent computations – and this is just the beginning. Structured concurrency, a paradigm shift in how Java developers reason about concurrency, is just around the corner. We’re in this together, vendors and users alike.
We encourage you to give thread dumps a try in IntelliJ IDEA – you’ll find that this post was only the tip of the iceberg. And our documentation is always worth a look. For feedback and feature requests, we invite you to check out the comments section or our issue tracker.
Let us know what you think!