Kotlin
A concise multiplatform language developed by JetBrains
Kotlin IDE Performance
The performance of your tools, and especially your IDE, has a significant impact on your development experience. For a long time, performance was a pain point for Kotlin developers, especially those who worked with large codebases or with complex code structures. This is why for the past year we’ve been focusing on improving this experience for you. Our goal is to make sure working with our tools is as smooth as possible. We’ve already done a lot of work on that front, but we’re not going to stop here!
If you have ever experienced the blight of a slow IDE, or if you get a kick out of software performance, you’ll like what we’ve prepared for you below. We’ll cover:
- How we measure performance to see where issues are and what to improve.
- How we’ve improved IntelliJ IDEA performance for Kotlin development.
- Our plans for the future.
Our recent versions have fixed a lot of performance issues. If you’ve been reluctant to upgrade because of concerns about breaking changes, we think you’ll be excited by the improvements we’ve made.
Measuring IDE performance
We use a variety of approaches to finding problems with IDE performance. Our primary resources for measuring IDE performance are synthetic and real-life benchmarks, anonymous statistics, and your feedback.
Synthetic benchmarks
We run benchmark tests for code completion and highlighting for internal components on basic code snippets on every build. Each test is performed several times, and the geometric mean of these runs is reported. Each suite of benchmark tests includes around 1000 tests. We run them in both before- and after- warm-up modes, roughly ~20 times in each (40 times total), and then we take the mean and geometric mean for each mode.
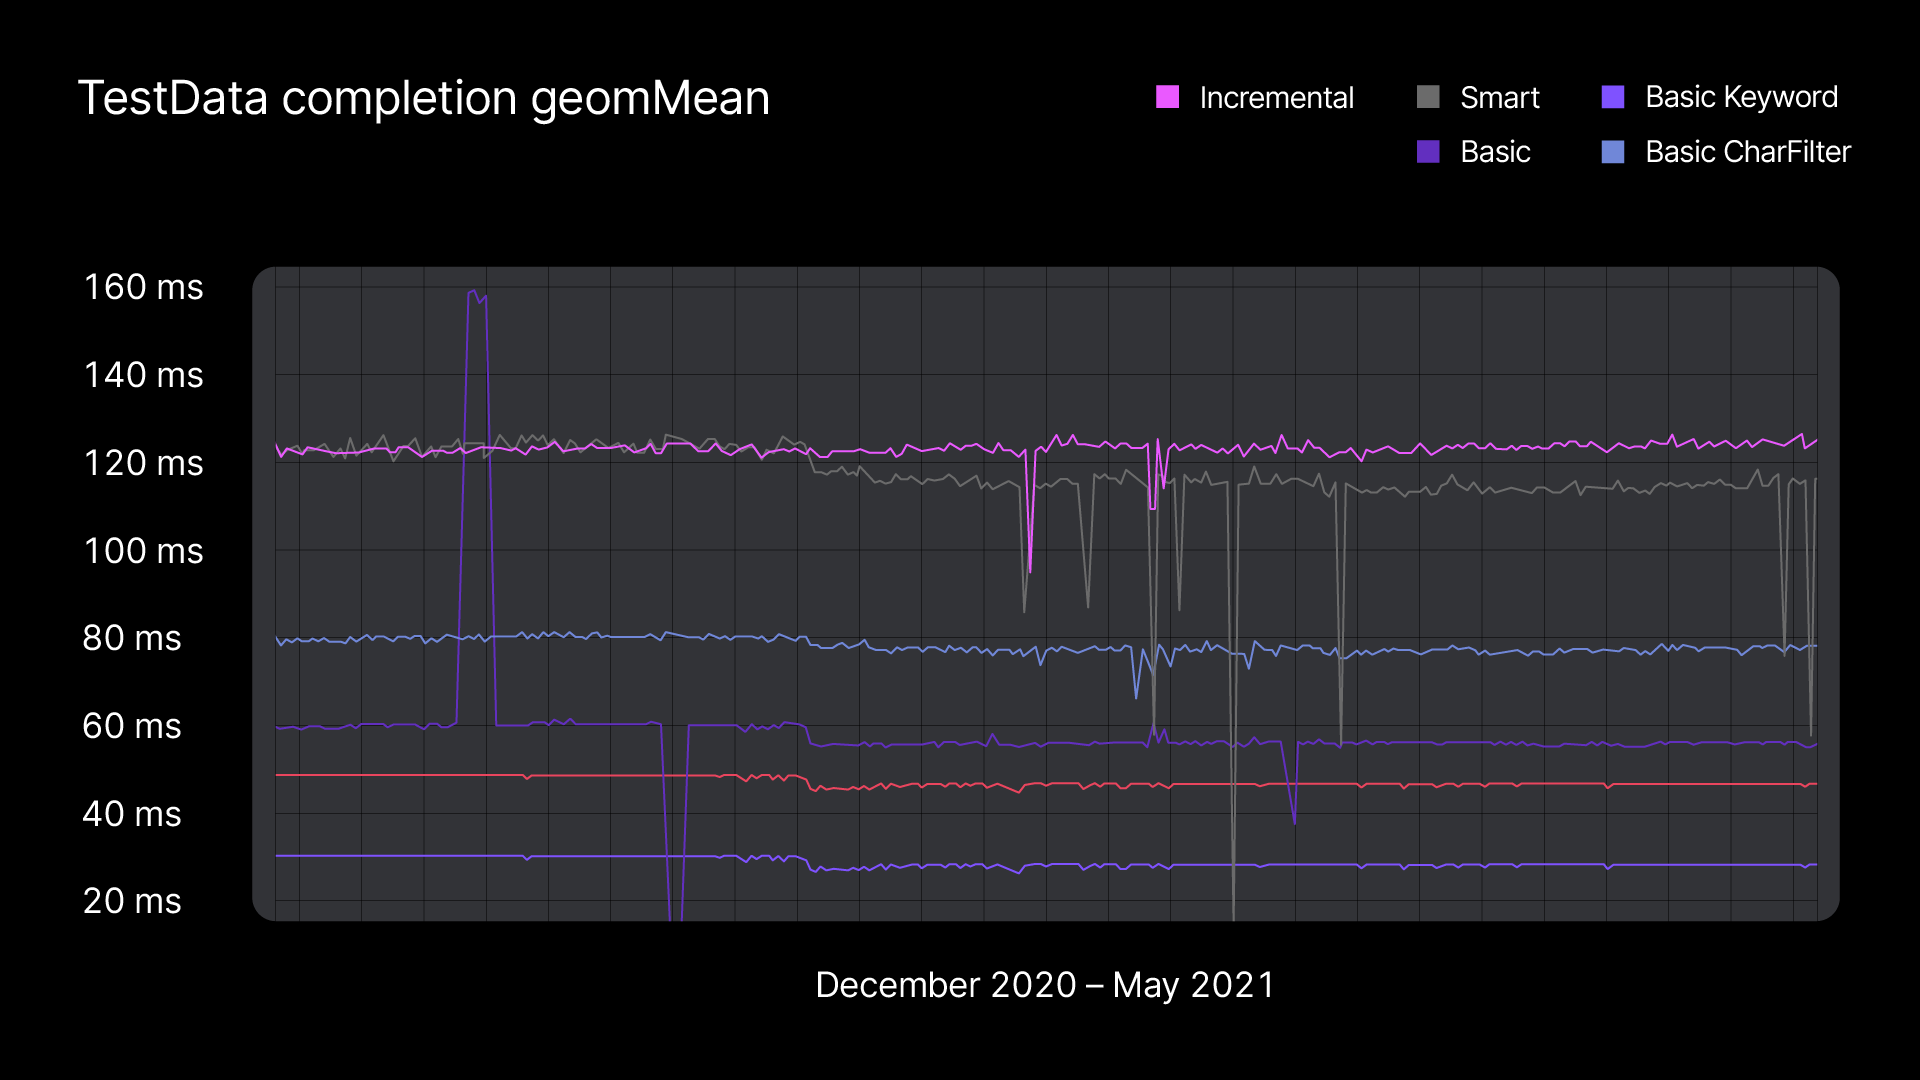
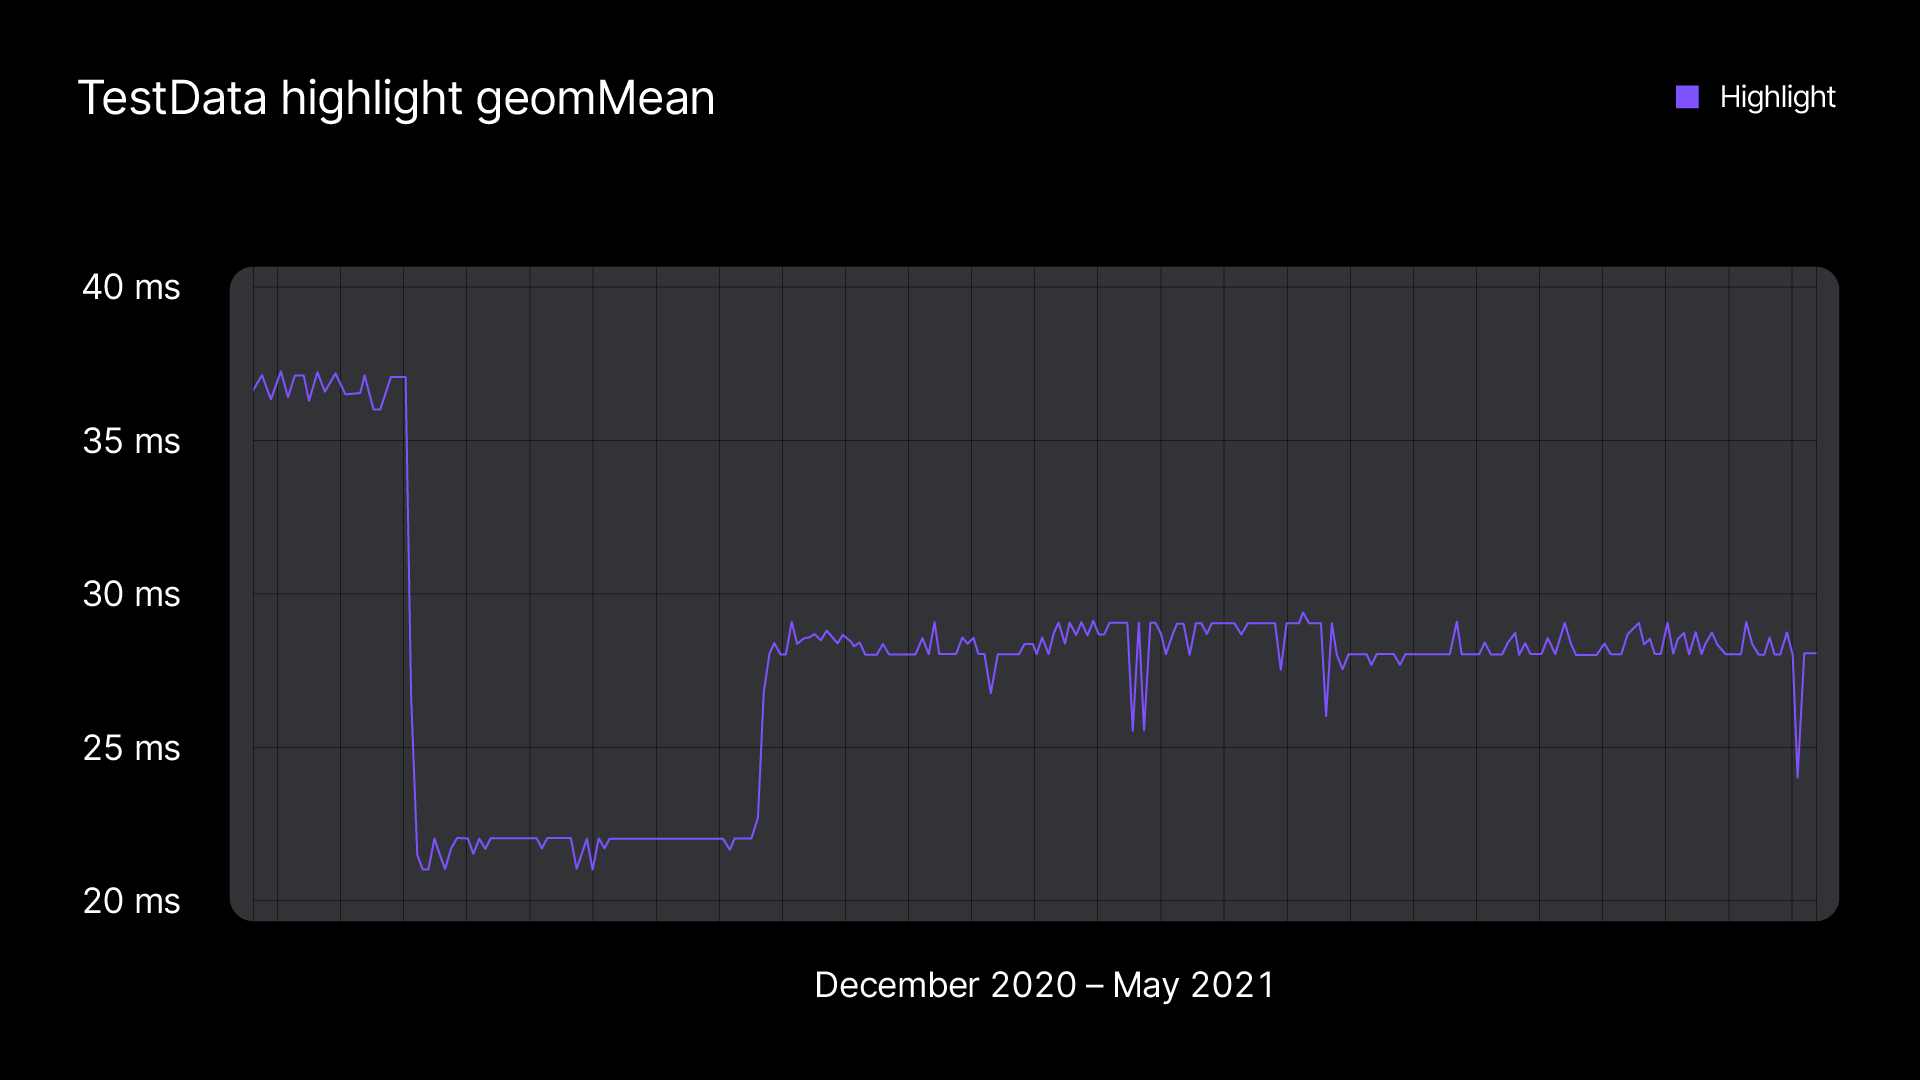
Such benchmarks help us catch regressions and estimate the performance improvements that result from changes in the algorithms in particular subsystems. A degradation in IDE performance can sometimes be caused by a change in another subsystem. Like in this case, where a change in the compiler’s frontend cache affected the speed of code highlighting. We discovered it, reported the problem to the compiler team, and they fixed it.
It is hard to use these representations to draw conclusions about the actual user experience because users just see the end result of the many integrated subsystems. Therefore we run a second level of tests.
Real project benchmarks
We use internal JetBrains projects – those using Kotlin – to test IDE performance. For instance, we use a JetBrains project written in Kotlin for our code highlighting tests. We categorize the files by complexity, from very simple ones to complex ones that contain many declarations and require a lot of calculations for type inference, semantic analysis, etc. The files have different highlighting times, which allows us to see how performance is affected in different situations.
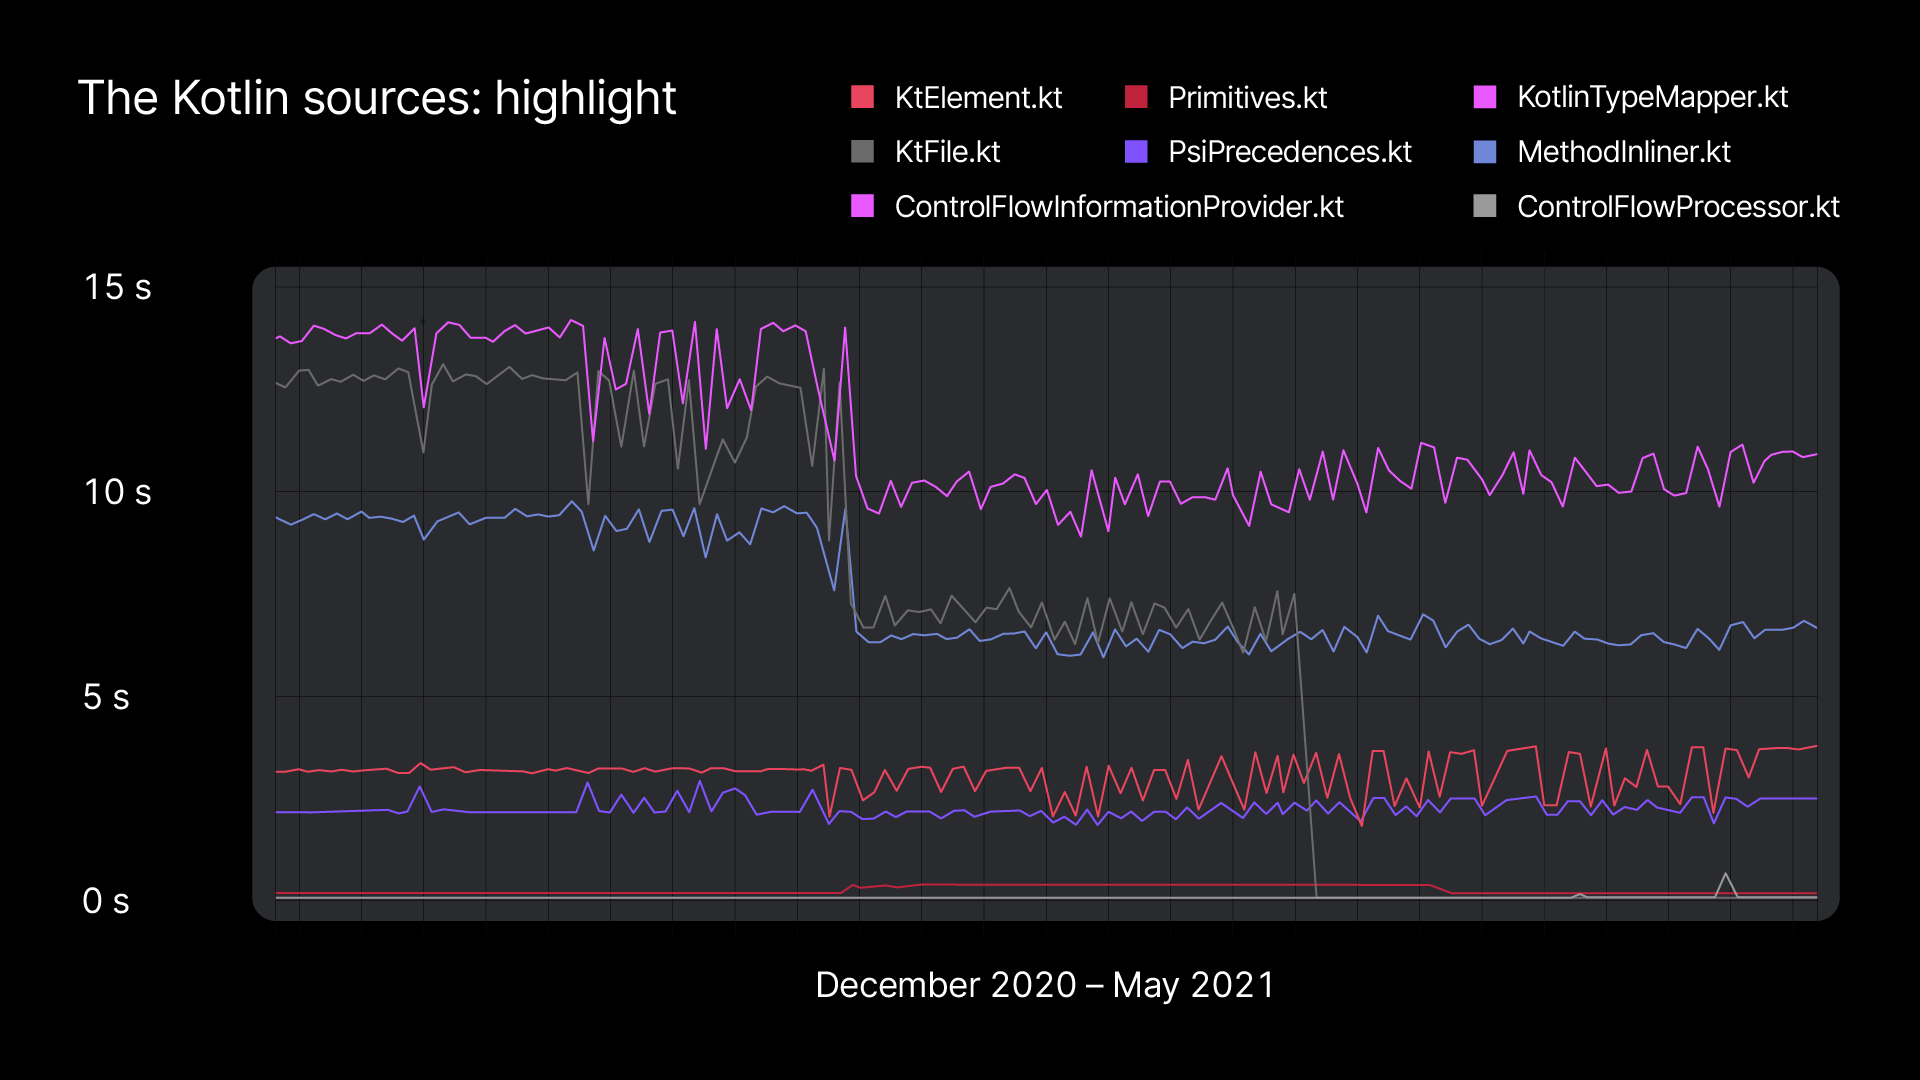
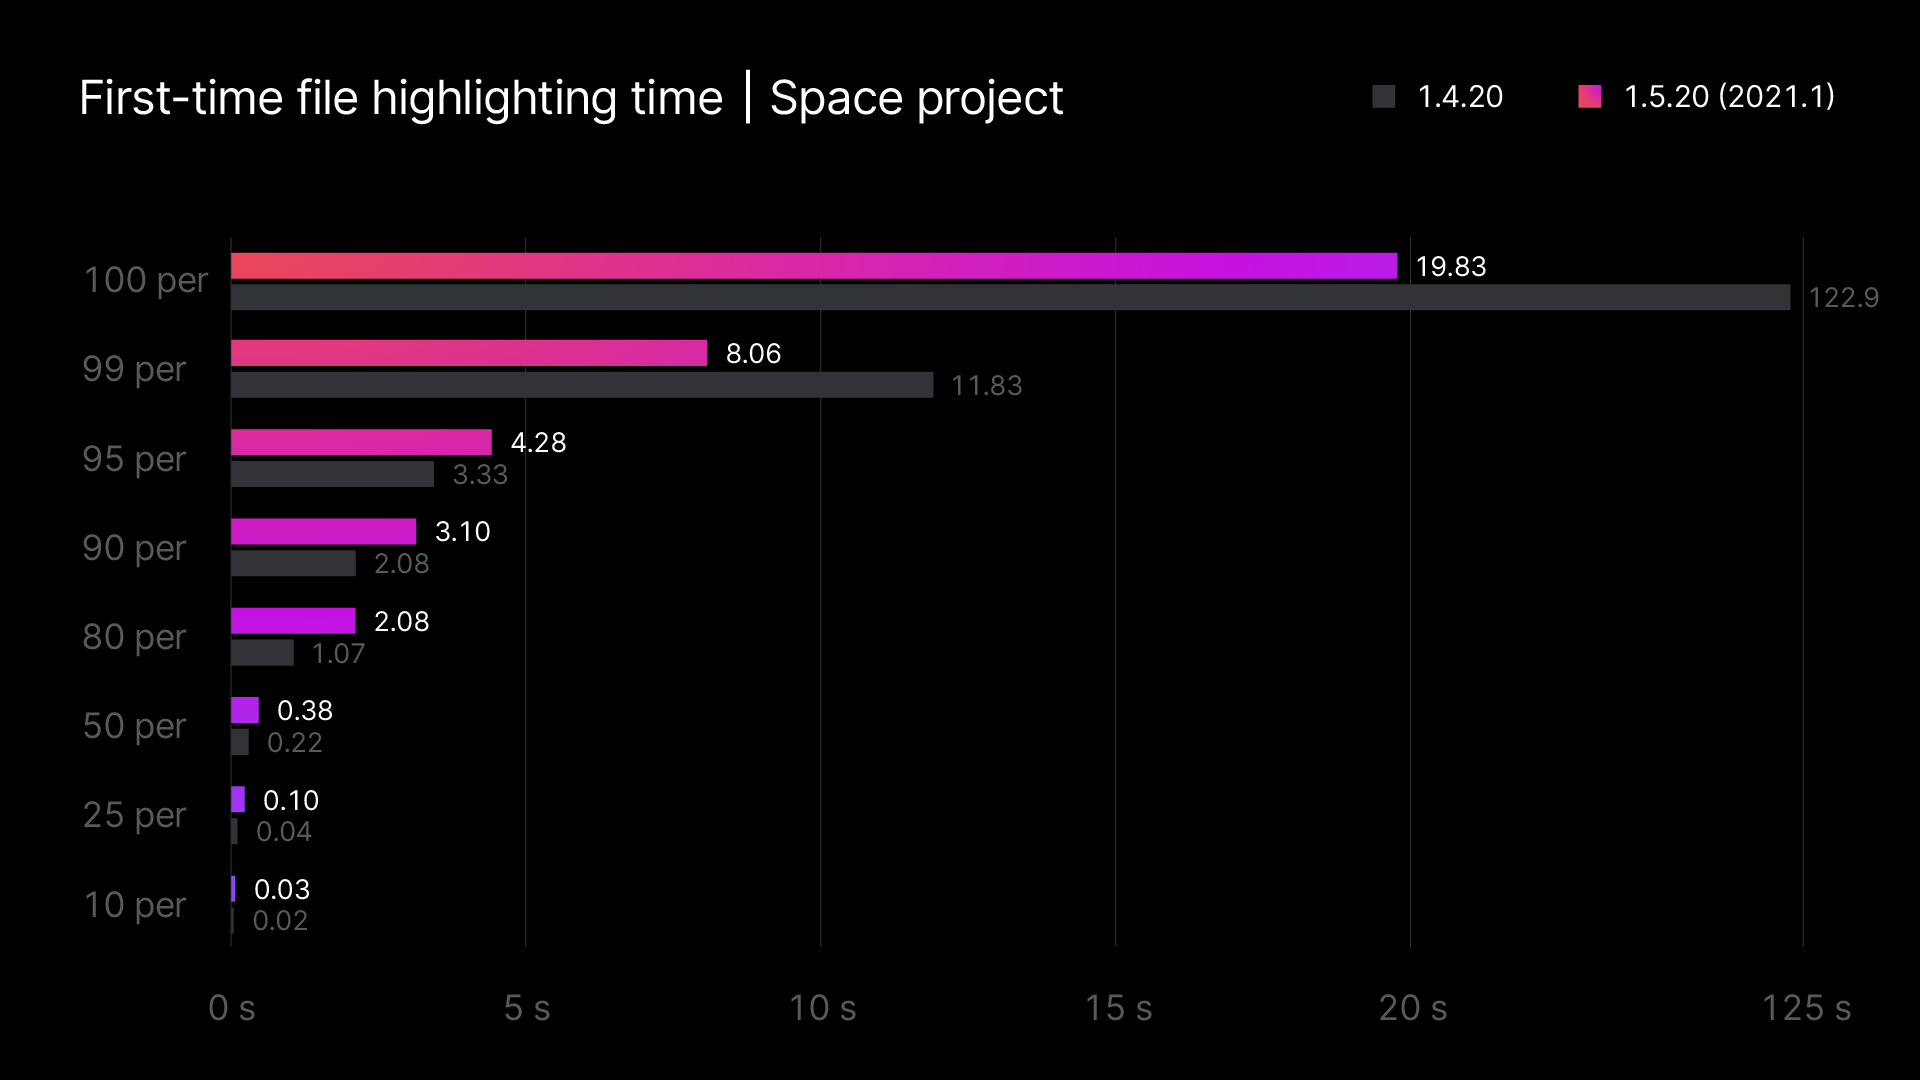
Additionally, we set up a highlighting test that runs over project files and presents a more general picture of the state of the code highlighting in the project for particular builds. The test takes 10% of the largest files, 10% of the smallest ones, and 10% of the files in the middle. It doesn’t make much sense to run it for every build, but it can be useful to see how the results of this test change from release to release. For instance, this is analytics of highlighting tests over Space project – the integrated team environment that was recently released by JetBrains.
We actually have a question for you regarding this. We are considering making these benchmarks public, but we aren’t sure whether you would actually get any benefit from them, and we don’t know what use cases they could help with. If this is something you would be interested in, please share your thoughts with us in this issue.
Share my thoughts on benchmarks
Anonymous statistics
The most accurate picture we can get of how our product behaves in user workplaces comes from anonymous telemetry data, which we gather from those who agree to share it. This data allows us to get a better understanding of your experience of IDE responsiveness. We log code completion and indexing times. And even though such data doesn’t tell us anything about code, we can understand how a feature’s performance changes relative to the numbers from the same user in the same project.
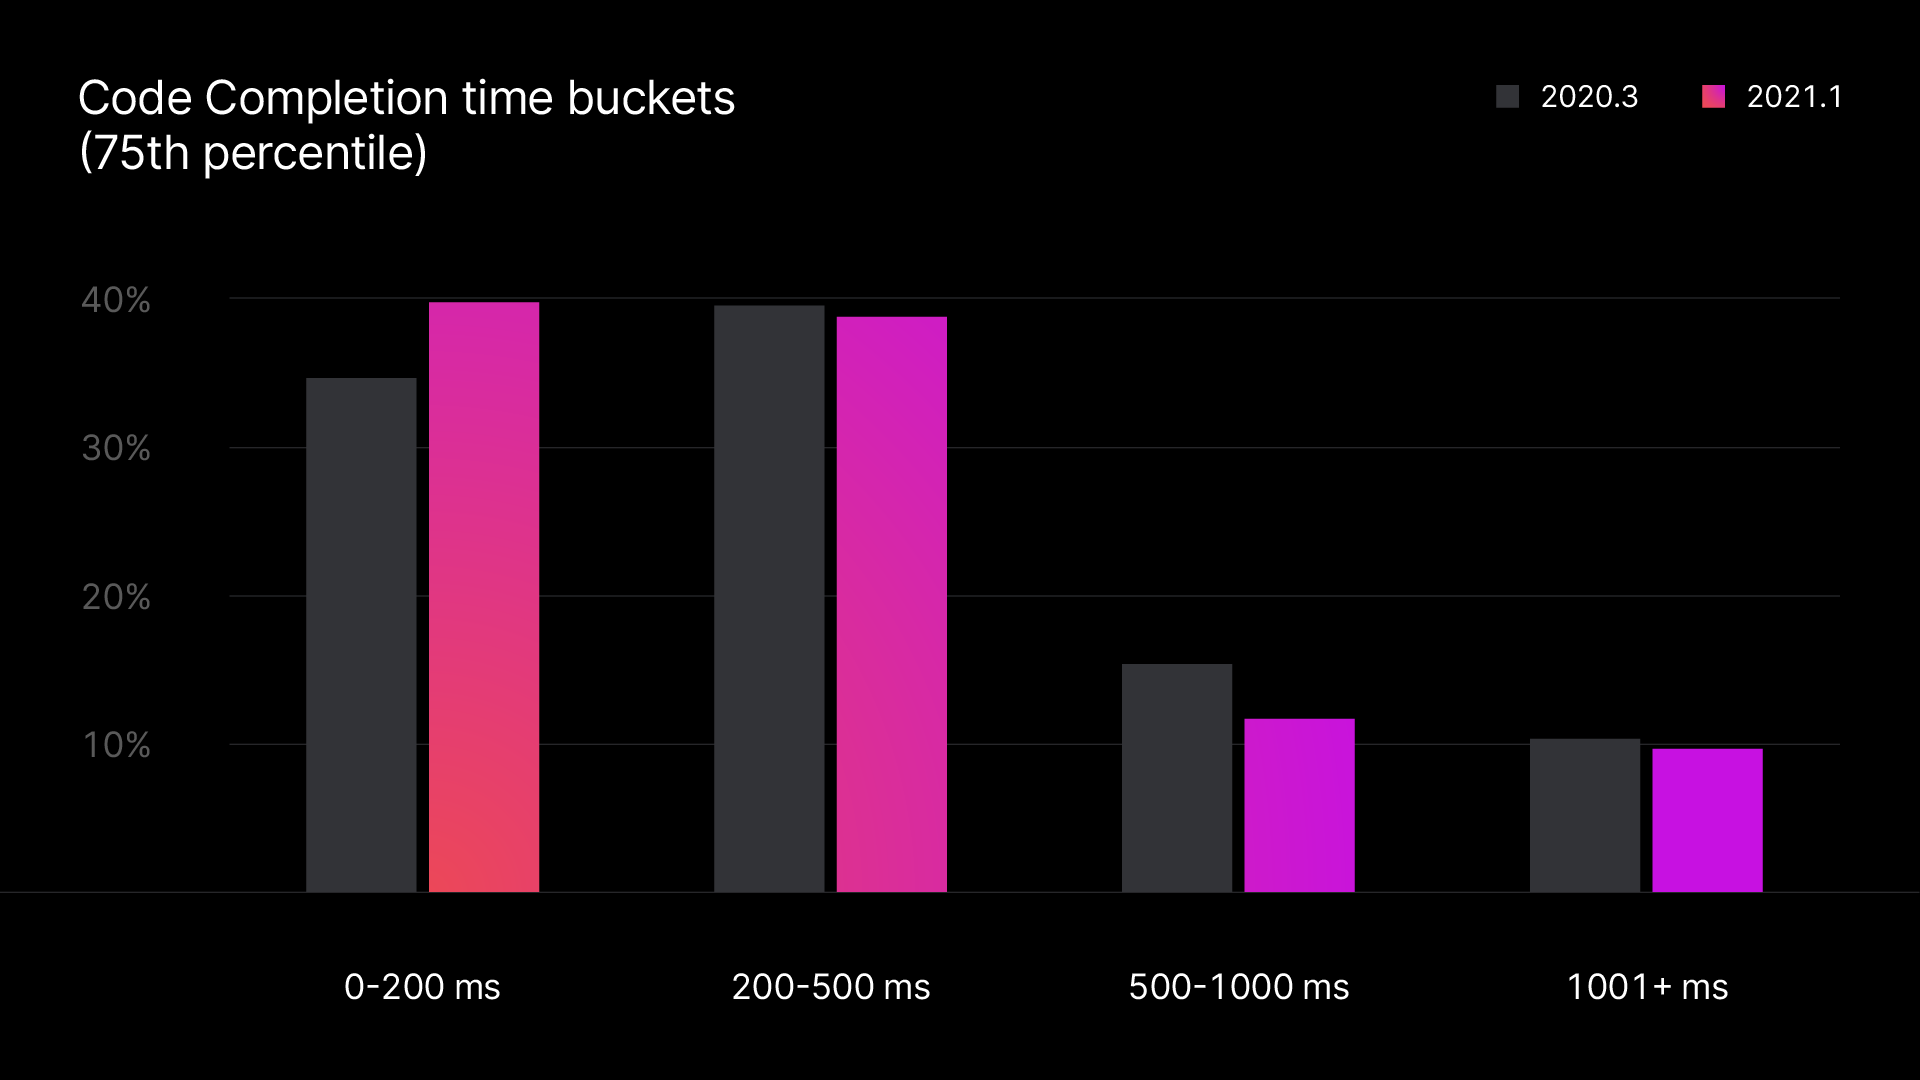
You could help us collect more real usage data by opting-in to send us anonymous statistics from your project. We won’t get any details about your code or project, as the statistics are anonymous and don’t contain any sensitive data.
Your feedback
And of course, we process all the tickets you report in YouTrack. By tracking their frequency, we can get a better understanding of what areas we should focus on. For instance, this is how we found a performance regression (KT-43554) in IntelliJ IDEA 2020.2.3. The call sequence was fixed and delivered in the next release.
So if you find any issues with the release, please don’t hesitate to share it with us in YouTrack.
Improvements in the latest releases
When preparing this blog post, the latest release versions were IntelliJ IDEA 2021.1 and Kotlin 1.5.0.
Reworked platform, plugin, and compiler API for code highlighting
We’ve made a bunch of improvements to the code highlighting system to make it faster.
For “non-red code”, the new highlighting annotation API in the IntelliJ Platform lets us see the results as soon as we receive them, instead of receiving them all at once. This task had two iterations, and each brought us visible improvements to code highlighting speed. The related YouTrack tickets are KT-36712 and a part of KT-37702.
The update is a bit different for “red code”. Here we do on-the-fly compiler analysis diagnostics reporting. We have reworked the IDE plugin, including by adjusting compiler interaction so that the compiler reports all diagnostics (like Unresolved Reference or Type Mismatch) as soon as it detects them. Previously, such diagnostics came bundled together in a related ticket: KT-37702.
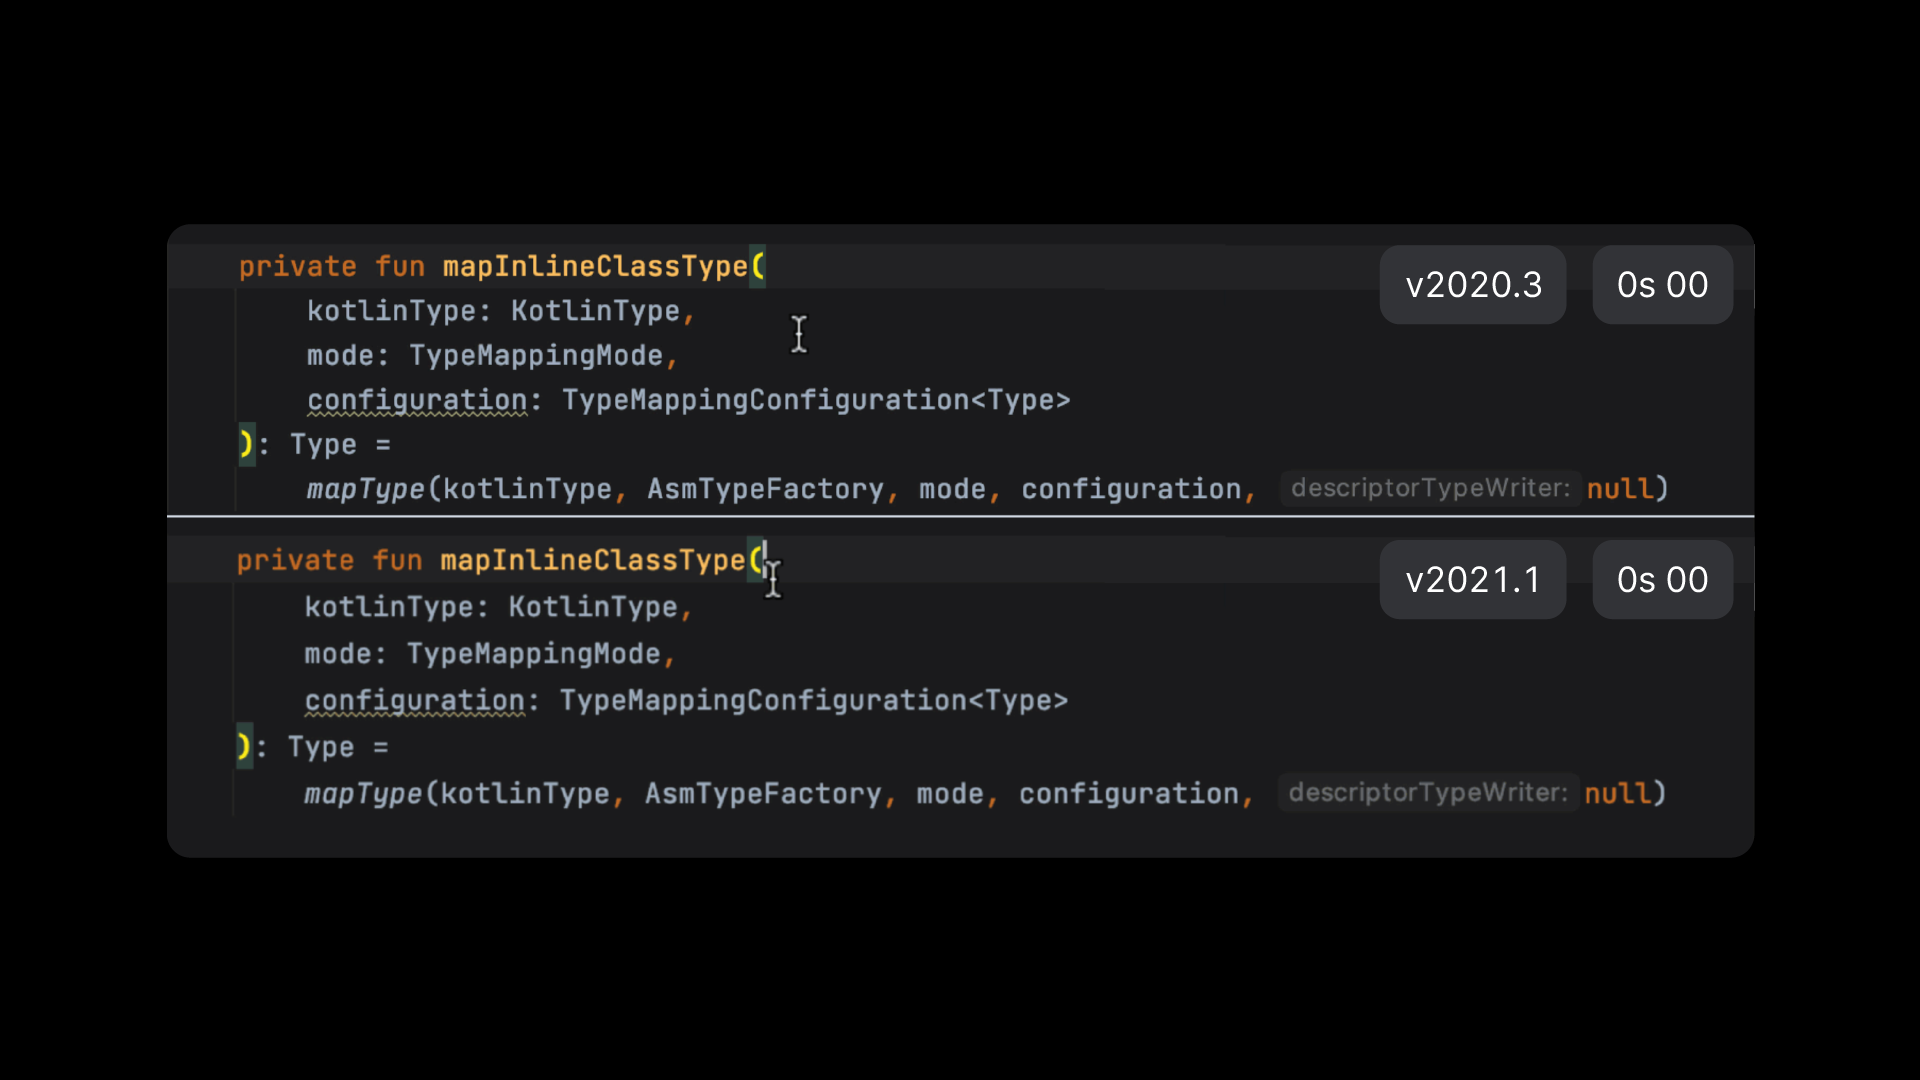
Also, all highlighting jobs (basic syntax, semantic analysis, code inspections) were previously being run simultaneously. But now, we’ve defined an order, putting syntax and semantic analysis before the other jobs; the related ticket is KT-37553.
Code analysis optimizations for code highlighting
We perform incremental code analysis where possible and where it makes sense. Also, we reduce the need to re-analyze jobs by optimizing the caches and analysis algorithms.
One of the biggest improvements was in the optimization of resolve calls – heavy operations that require compiler involvement. Before involving the compiler, we do all the possible code analysis within the IDE, like testing whether the code returns null and other lightweight checks, like here or here. Also, IntelliJ IDEA now displays the “Run test” gutter icons before semantic analysis starts. We managed to do this by introducing some heuristics – the related ticket is KTIJ-408. And here’s an example of how it works on a complex file with cold IDE caches.
Gradle Scripting support
To improve Gradle Scripting support, we concentrated on the interaction of three subsystems: IntelliJ IDEA, Gradle, and Kotlin. They all need to get all the data as fast as possible, but some operations are heavy and take time. We investigated such cases in order to minimize their effect on the user experience. Here’s what we’ve done:
- Rewrote the API, making it possible to distinguish operations in terms of their heaviness
- Changed the way IntelliJ IDEA and Kotlin get script configurations from Gradle
- Added more caches for heavy operations
You can find more details about the Gradle Scripting support in the dedicated blog post.
Polishing code completion algorithms
Code completion is a complex subsystem that includes searches, indexes, and prioritization algorithms. Code completion slowdowns are usually caused by high CPU/Memory consumption in another system. But sometimes we can find some ineffectiveness in code completion algorithms themselves and fix them, as we did for this issue and this issue. We make sure to keep track of how our algorithms perform and tune them whenever we notice some slowness.
IDE responsiveness
There are three main causes of IDE hangs:
- Heavy operations on UI threads.
- Inappropriate usage of “ReadAction” and “WriteAction,” the main actors in the IDE dynamics and memory model.
- Deadlocks – the problem of multithreading applications.
The most effective way to deal with the responsiveness problem is to collect diagnostics information from YouTrack reports, analyze it, and identify the problematic areas. Responsiveness issues can occur anywhere in the IDE: import management, formatting, copy/paste actions, code analysis, project configuration, etc. We have been looking into these for some time and are always trying to improve responsiveness. The list of fixed issues can be found in our YouTrack.
CPU/Memory consumption
To improve memory consumption, we profile problematic cases, detect leakages, and fix them. There is nothing surprising about this approach, and we do the same for a high CPU consumption. With the help of the diagnostics information you provide, we are able to detect places that cause infinite calculations or move many heavy processes into the most elevated priority pool.
To provide diagnostics information, you can follow these simple steps:
1. Create a ticket, which should contain diagnostic information about the state of the CPU or memory. It can be easily obtained from the description here.
2. Attach the logs from IntelliJ IDEA [Help → Collect Logs and Diagnostics data])
Our plans for the future
We’ve made some progress in code highlighting, completion, and IDE responsiveness, but what about other areas?
We are dedicated to building on what we have done and want to share with you our upcoming plans for improving performance further.
Search and Navigation
While investigating the possible benefits of deeper integration between the build tools and IntelliJ IDEA, we found we could reuse information from the build in the IDE’s search system instead of gathering it again just for the IDE. We expect to significantly speed up Find Usages, Navigation, and Search references by building a new index. This will be helpful for projects with large code bases, where regathering information is a notable issue.
Indexes rework
Updates to search and navigation are not the only improvements we’ll be making to indexing. We’re also planning to review all the indexes that the Kotlin plugin currently uses. We want to fix any outdated or improper API usages of the IntelliJ Platform index system to remove instances of unnecessarily repeating calculations. This refactoring should reduce IDE re-indexing, as well as failures of fast code analysis and search operations.
New compiler frontend
This is the longest running task, but it promises to be a game-changer in areas related to compiler execution time. We noticeably increased code processing speed. Also, we designed a better compiler API that allows IntelliJ IDEA to make more specific requests to the compiler and reduce the amount of work required for a particular job.
Shortening the feedback loop
Some big IT companies have a special department that is dedicated to providing the best development experience for their colleagues. Among other things, these departments measure how the IDE behaves with their project on new versions of plugins, the IntelliJ Platform, tooling, or libraries.
We see mutual benefit in cooperating with these departments to get detailed technical analysis and to deliver fixes more quickly. In return we will be able to improve performance in specific areas. These fixes will be beneficial to most of our users.
To this end, we are working on establishing a process with IT departments. If you are interested, please send an email at anton.yalyshev@jetbrains.com.
Summary
If you’ve been trying to decide whether to update to new versions of Kotlin or the Kotlin Plugin, our official position is yes! It totally makes sense to upgrade if you’ve been experiencing some performance issues, as there’s a good chance the recent changes have addressed the problem.
How to update to the latest version of the Kotlin Plugin in IntelliJ IDEA
IntelliJ IDEA will give you the option to automatically update to the new release once it is out. Or you can download the newest version and it will already come bundled with the latest Kotlin plugin.
Related links:
- How to share anonymous data with us
- Kotlin Plugin 2021.1 Released: Improved IDE Performance and Better Support for Refactorings
- Kotlin 1.5.0 – the First Big Release of 2021
- Improved *.gradle.kts IDE Support
- Kotlin roadmap


