Kotlin
A concise multiplatform language developed by JetBrains
Simple Steps for Improving Your IDE Performance

This blog post continues from the previous one about how we measure IDE performance and what results we’ve already achieved. We want to give you a few tips on what to do if you are still experiencing poor performance and show you how best to approach us with issues that bother you.
Features and solutions
Shared-indexes
Shared indexes were introduced in IntelliJ IDEA 2020.2. The goal was to reduce the time spent on project indexing by up to 75%. Now, you don’t need every computer to process and index the same external project dependencies, or all of your project if you are only working on a small part of it. This system lets you create a local storage for indexes, and connect to a global storage where, for example, JetBrains keeps indexes of the JDKs. To set up this feature for your project, check out these instructions.
IntelliJ LightEdit mode
We have all had times when we have just wanted to quickly look into a file, correct a quick line, or read a small piece of code.
It is not something you want to load the whole IDE and all of its features for. Your time is precious, so people often use a basic third-party lightweight editor. At the start of this year, IntelliJ IDEA began providing the ability to open files in a lightweight version of the editor that loads very quickly and has a limited set of basic features, which is perfect for these quick changes.

Code with me and Projector
These are new solutions that work with IntelliJ IDEA and our other IntelliJ-based IDEs. Basically, they let you set up an IDE instance on a server with high hardware resources, and access it remotely via different protocols. All the heavy operations are then run remotely on a faster machine so you can get results sooner.
With Projector, you can access the server using a browser. The web client is implemented using HTML5 Canvas API. In March 2021, we announced Projector 1.0. Let us know if you are interested – we’ll be happy to assist you with getting started. You can contact us anytime through YouTrack and Twitter.
With Code With Me, you install a lightweight version of IntelliJ IDEA on your machine and set up a connection with the host. Code With Me was initially intended for collaborative development purposes, where you share your IDE session with your colleagues. Later we found that using it in a remote development scenario with a server-based IDE instance works very well, too. To learn about how it works in more detail, please visit the product’s official page.
Tips for improving IDE performance
In addition to using these solutions and features, you can also modify your project and IDE configuration to make it work faster. Most of these tips are trade-offs between the smart capabilities of the IDE and the performance that you get, but they can really help you out if you are experiencing performance issues.
IDE and Project configuration
1. Disable all unnecessary plugins
Open the IDE’s Preferences/Settings → Plugins menu and make sure that you don’t have any plugins installed that you don’t use. IDE slowness can be caused by many things. We have received reports where the logs show plugin operations interfering with the code highlighting process, but a user may not realize this is the cause from the UI behavior.
2. Increase memory for IntelliJ IDEA
By default, the IDE requests a maximum of 2048 MB. You can change this option in Help → Change memory settings. According to the feedback from some of our users and colleagues with big projects, changing the option to 8GB significantly improves IDE performance.
3. Exclude folders and Unload modules
You can reduce a scope that the IDE has to index and use for searching operations like Find Usages or Code Completion. You can consider excluding folders that contain generated files, logs, project documentation, etc. For unloading – modules that you don’t need and you’ll not use. You can find more details in the IntelliJ IDEA documentation.
4. Disable on-the-fly import management
The IDE almost completely automates import management in source files. Although the majority of capabilities don’t use many resources, there are a couple that can make the IDE performance slower. The settings can be found at Preferences → Editor → General → Auto Import → Kotlin:
- Add unambiguous imports on the fly
- Optimize imports on the fly
The first option substitutes the explicit context actions call (Alt+Enter) on an Unresolved reference if there is only one available import. The second performs import list optimization after all possible relevant actions, instead of one explicit Optimize imports action call. We intentionally extracted these options because any additional value that they bring may be offset by performance degradation.
5. Pause inspections check
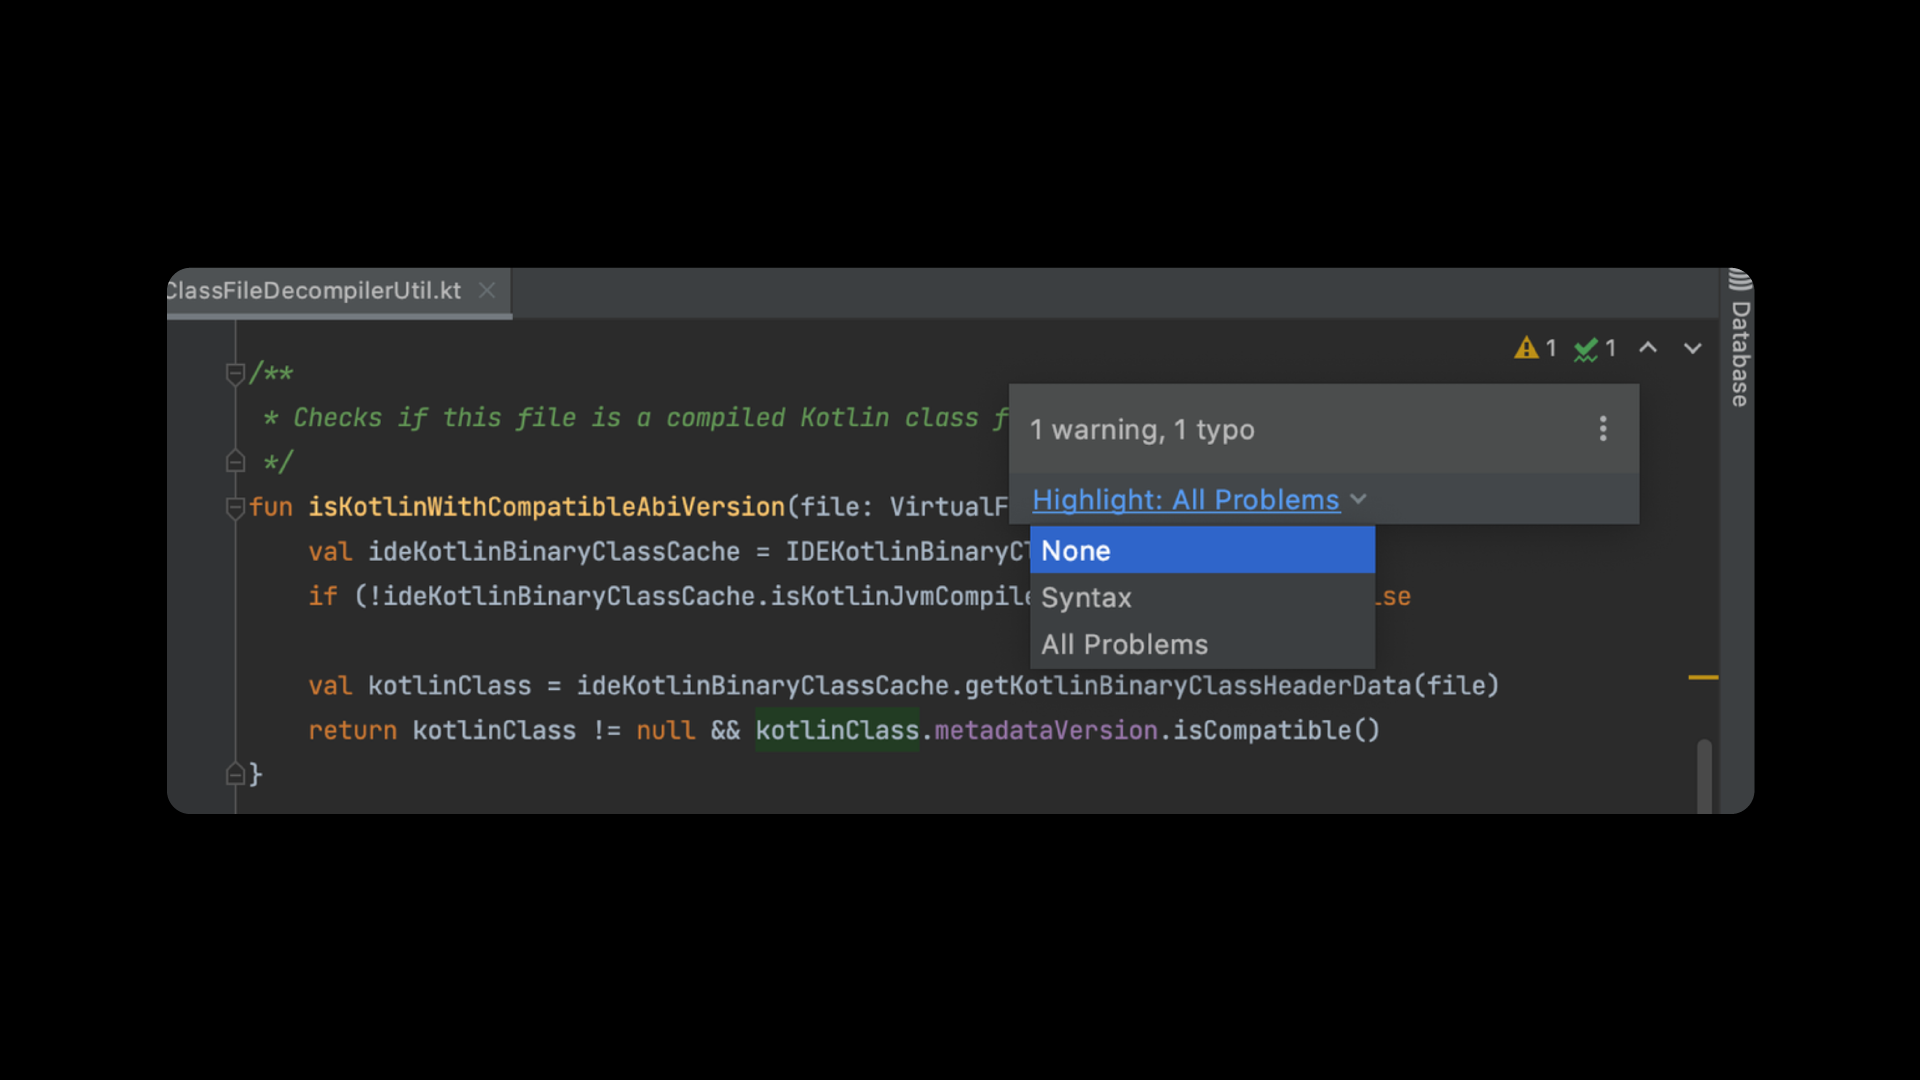
If you’re in the process of writing new code and warnings are not that important to you, you can change the highlighting level to Syntax. This way, code inspections won’t run and consume IDE resources. To make this change, hover over the Inspections widget and use the link at the bottom of the popup to change the highlighting level to Syntax or None.
Code Style
These suggestions are not a call to action, but rather things to consider if you and your teammates are okay with the established style in your project. Kotlin provides features like Type inference and Extension functions, but sometimes we see how those features, when overused, make code harder to read and also affect IDE performance by overloading the code analysis.
Explicit type annotations for public methods
Public methods and properties represent a so-called “public API,” which is a form of abstraction. Forcing API users to investigate the inner workings of public methods (or to guess the result type) is a sure way to break encapsulation and degrade code quality. Explicit type annotation makes public API well-marked and easy to use.
What’s also important is that explicit result types can greatly improve code editing performance. Unlike the compiler, an IDE has to re-infer types on each code update. To optimize the workload, IntelliJ IDEA tries its best to cache and preserve as much type information as possible. However, as the result type of a method with omitted type annotation can change, even on “external” update, IntelliJ IDEA has to re-process the whole content of such a method on many kinds of file change. In addition to that, type annotations on public methods increase the speed of incremental compilation by minimizing the amount of recompiled code.
File size
There’s no doubt that there are cases of long files when their structure is reasonable. At the same time, we know “code smells” like the “Long method” and “God class”. We also know about the Single-responsibility principle, etc.
Kotlin spec. discusses it:
Placing multiple declarations (classes, top-level functions, or properties) in the same Kotlin source file is encouraged as long as these declarations are closely related to each other semantically, and the file size remains reasonable (does not exceed a few hundred lines).
This is very important in terms of IDE performance. File is one of the scopes that the IDE considers when re-analyzing after every code modification. Optimization in code analysis algorithms helps, but it does not save us from performance degradation as a result of increasing file size.
How to report problems
We do lots of tests inside (read more in this post) to figure out things that might not work smoothly, but sometimes issues can only be found in specific situations encountered only in real-life projects. If you face something that doesn’t work the way you expected, the best way to get it fixed or changed is to tell us about it.
Reporting issues to YouTrack
Our public bug-tracker is the place to tell us about any performance problems you experience. The tickets are seen by the Kotlin team, who can properly process them. YouTrack helps us keep track of useful information – logs, comments, changes story, and links to other tickets. All of this helps us solve the problems.
How the process works:
- Report a ticket in our issue tracker.
- The Kotlin team analyzes all incoming tickets and classifies them according to the type of performance problem and the possible cause. Our technical support engineers may request some additional info, or add some findings they get from the information you provided to the comments.
- Kotlin and IntelliJ IDEA developers review the information submitted to the ticket.
- When enough data has been collected, and after some research, we usually identify a root cause for the slow behavior and fix it.
- After we are sure that we have fixed this problem, we close these tickets. Sometimes, there can be several problems behind a specific slow behavior that you report. Or, we can not be sure that the problem has gone completely after the fix. So we keep issues open until we have fixed all the problems that were discovered as a consequence, even after the main cause was fixed.
Uncertainties in a real status of opened issues usually appear when we rewrite some subsystems (e.g. Code Highlighting API). It’s almost impossible for us to know for sure how your case will behave under these new circumstances. We strive to have the information in tickets relevant and up to date (for the latest versions of the plugin and IntelliJ Platform). Here we ask you to retest the described behavior and attach new logs if the reported issue is still open after some time.
The best way is to create an issue in YouTrack is describing the problem and attaching the relevant logs so we can start investigating it
- Describe exactly how the problem arises, what you were doing, and where in the file it occurred.
- Provide diagnostic information about the state of the CPU and memory. It can be easily obtained following the instructions here.
- Attach the logs from IntelliJ IDEA, made with the action [Help → Collect Logs and Diagnostics data]
- Add information about the platform, plugins, and other versions from About IntelliJ IDEA. Hover the mouse over the list of versions and click on the Copy button that pops up. You may remove information about your License and Subscription.
- If the project is publicly available, please attach it or share a link to where we can download it.
- Otherwise, please describe some traits of the project: how many modules, files, or (Kotlin or Java) classes the project contains to give us a rough understanding of it. Of course, we don’t need an exact number but want to understand the magnitude.
- If the problem arises during the editing of a file, specify the approximate file size or how many classes of top-level function it contains. Or just let us know that there’s nothing unusual.
The list turned out to be quite long, and we don’t require you to report all of this – consider it a recommendation. Each of these pieces of information can help us to catch the real reason for the performance slowdown.
Also, to help us get more real usage data, you can opt-in to send us anonymous statistics. It’s easy, and we won’t get any details about your code or project as the statistics are anonymous and don’t contain sensitive data.
Related links
How we measure Kotlin IDE performance
Kotlin 1.5.0 – the First Big Release of 2021
Kotlin Plugin 2021.1 Released: Improved IDE Performance and Better Support for Refactorings
Nine Highlights from the Kotlin Roadmap
Coding conventions
Subscribe to Kotlin Blog updates