
A Step-by-Step Guide to Performing Data Analysis With Kotlin DataFrame

Introduction
This is the first in a series of tutorials on how to easily manipulate and visualize your data using the Kotlin DataFrame and Kandy libraries. The tutorials are aimed at regular Kotlin developers, so no previous experience of data analysis or similar frameworks (like pandas or Apache Spark) is necessary. You should, however, be familiar with the Kotlin language and have created Kotlin-based projects in IntelliJ IDEA previously.
In this tutorial, you will learn:
- How to create a dataframe from a CSV file.
- How to perform common operations.
- How to display or export your results.
You will be working within Kotlin Notebook, both for convenience and in order to have access to the Kandy plotting library. The core dataframe capabilities you will see are available in Gradle-based projects.
If you prefer, you can jump directly to the sample project, which contains data files and notebooks for all the tutorials in this series. However, developers who are new to DataFrame, may find it beneficial to build everything themselves from scratch, one step at a time. You can then compare your project against the sample project to ensure that you have built everything correctly.
All the tutorials use real-world data, which in this case, contains information about the top answerers on Stack Overflow. Please note that the results shown below are correct for the data that was downloaded at the time of writing and that is included in the sample projects. If you are fetching fresh data, then naturally this may contain updated values.
The sample data
You can obtain the sample data via the StackExchange Data Explorer. This allows you to run sample queries against a range of Q&A websites, including Stack Overflow. The results of your queries can be downloaded as a CSV file.
This sample query selects the top 500 users on Stack Overflow, based on an average score calculated against their answers to questions. Use the RunQuery button to execute the query, and then save the results via the Download CSV link:
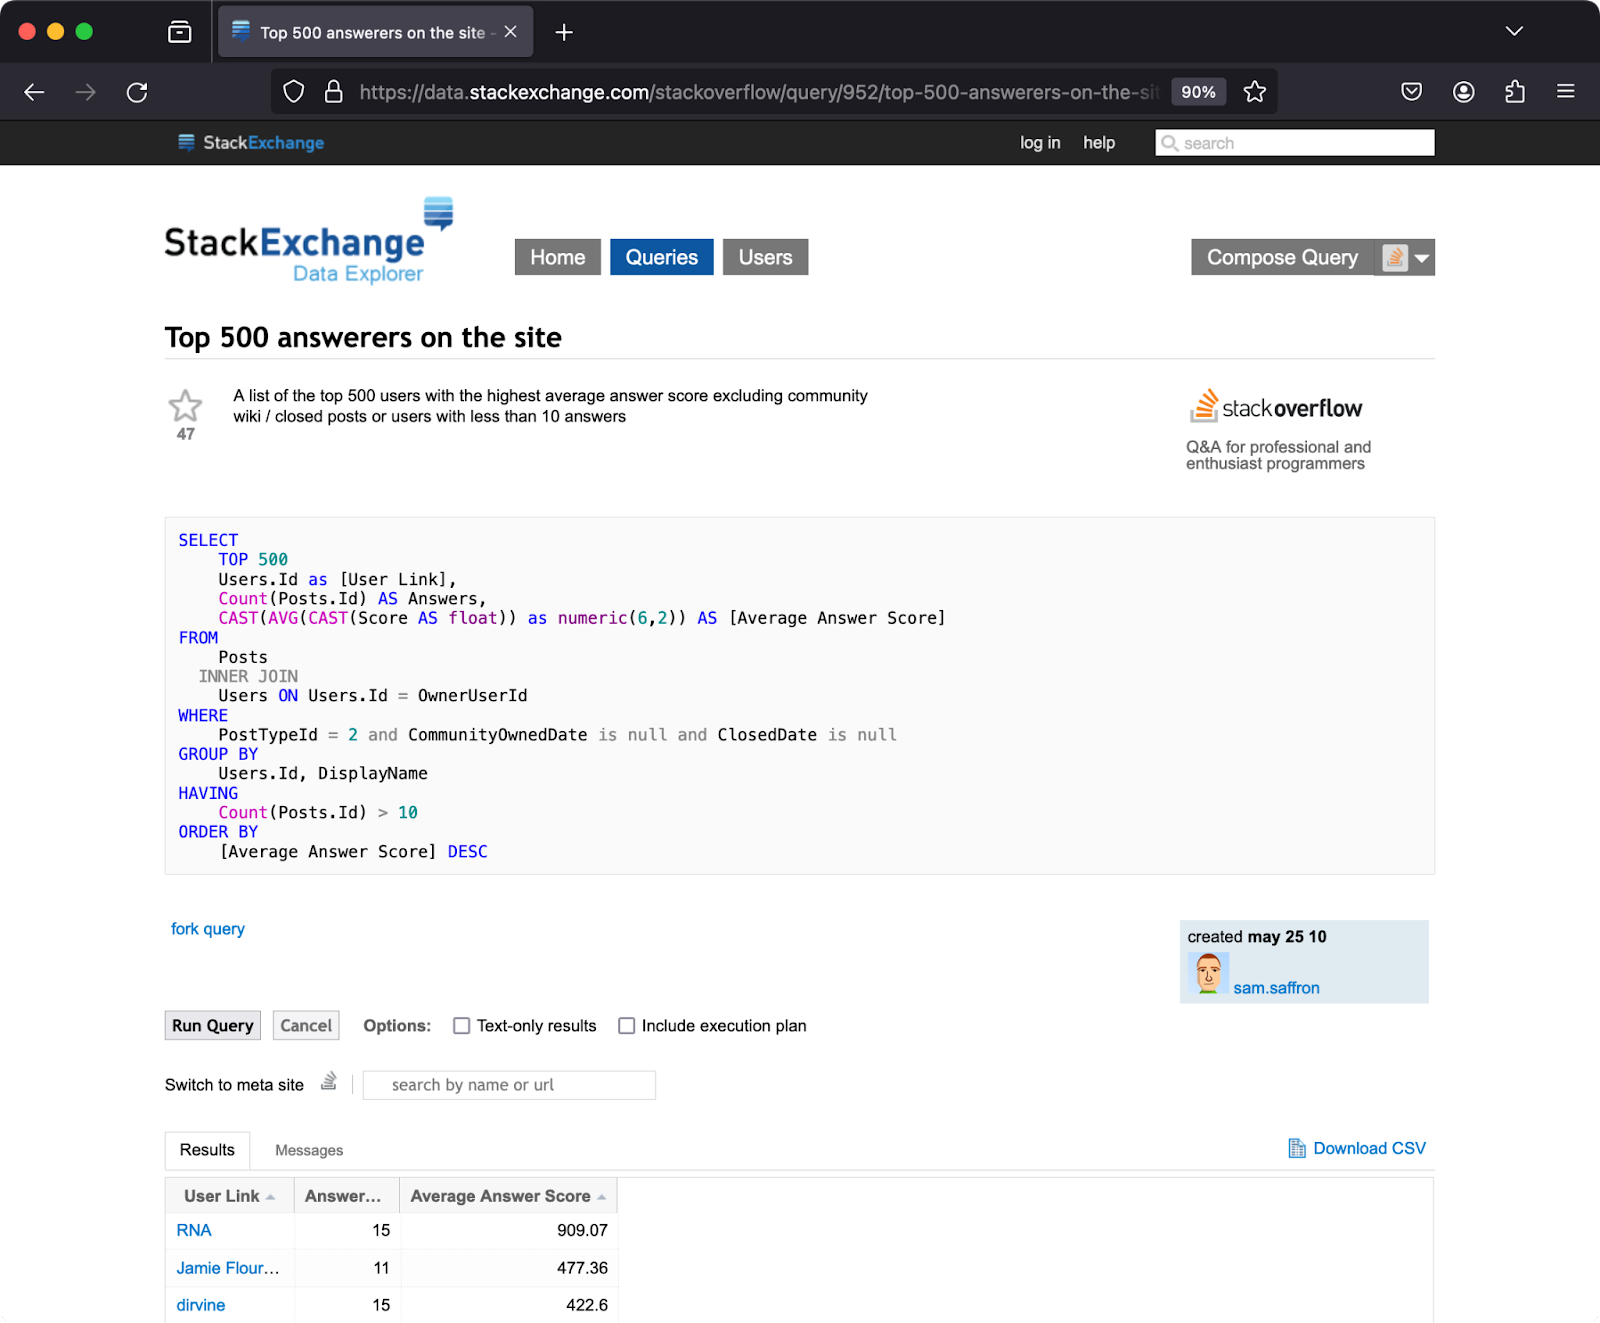
Once you have downloaded the file, save it under the name Top500Answerers.csv.
Creating your project
Open IntelliJ IDEA and install the Kotlin Notebook plugin, as described in this blog post. Then, use the New Project wizard to create a new Kotlin project, with Gradle as the build tool.
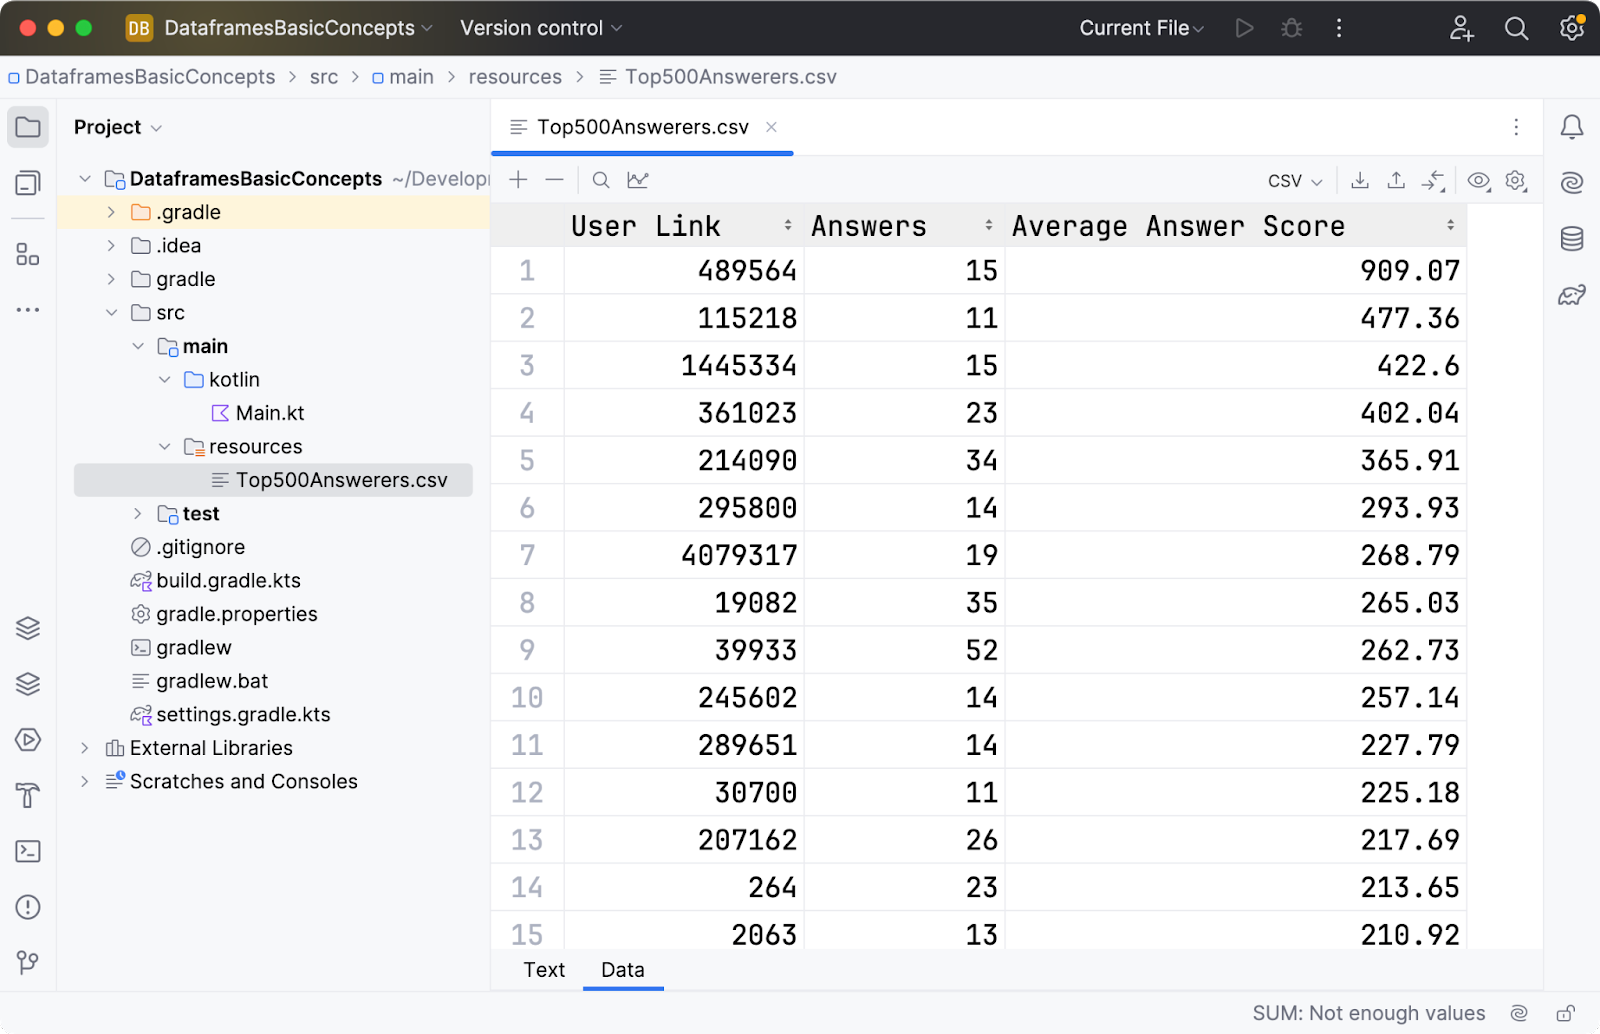
Copy the CSV file you created in the previous section into src/main/resources. You should be able to open the file in either the text or data views, as shown below:
Hello, DataFrames!
Right-click on the project name and choose New | Kotlin Notebook. You can save the file as whatever you like. Then, add and run the following two lines:
%useLatestDescriptors

%use dataframe
The use command will now load and initialize the Kotlin DataFrame library for you. Many popular libraries can be loaded using their name alone, while other libraries can be loaded based on their Maven coordinates. A lot can happen when a library is loaded, so it is a good idea to do this in a separate cell.
Now you can create a new cell and add the following three lines:
val path = "./src/main/resources/Top500Answerers.csv"

val topFolks = DataFrame.read(path)

topFolks.head()
When you run these, the output should be similar to the one shown below:
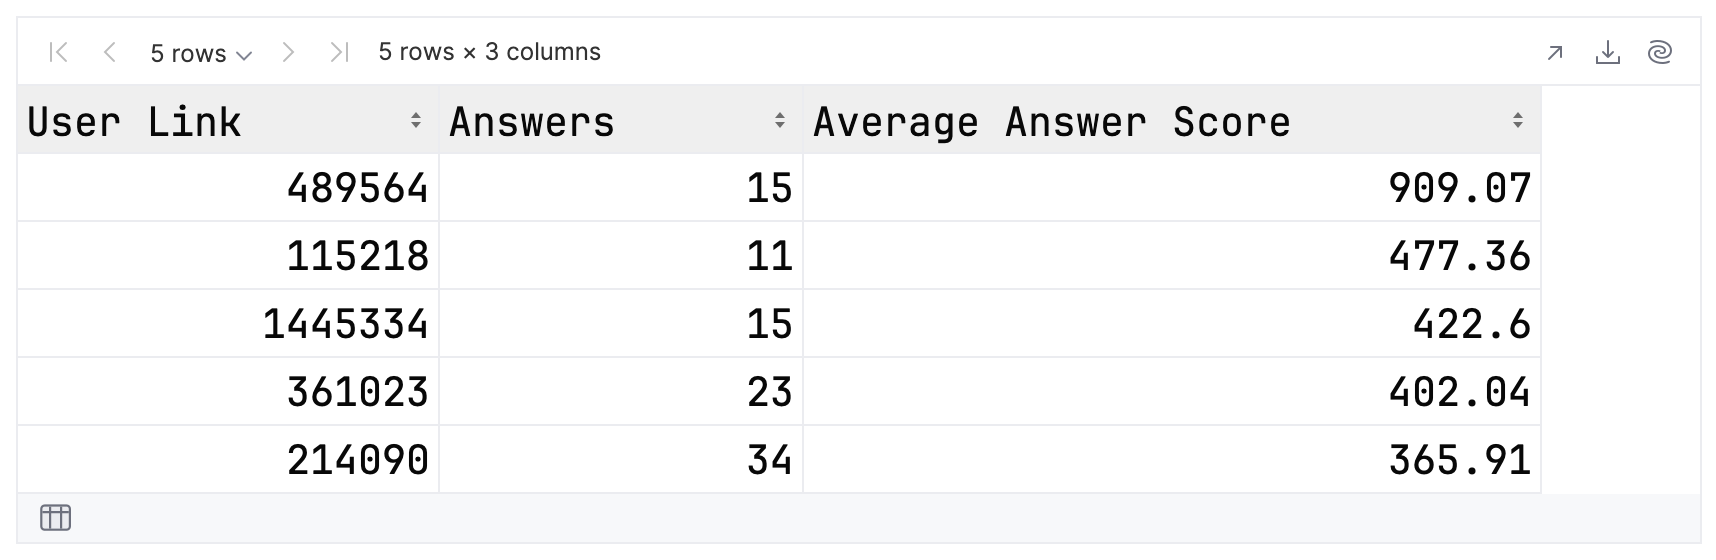
Congratulations! You have just successfully built a dataframe from a CSV file and printed out the top five records.
Displaying Data in Kotlin Notebooks
Now that you have some data, let’s consider how you can display it in a Kotlin notebook.
You can render content as markup via the DISPLAY and HTML functions. The example below sorts the users, takes the top five, and prints their details as an HTML list:
fun htmlLink(text: String, url: String) = "<a href=\"$url\">$text</a>"
fun soUrl(userID: String) = "https://stackoverflow.com/users/$userID"

val topFive = topFolks
   .sortBy { `Average Answer Score` }
   .tail()
   .reverse()

val content = buildString {
   append("<ul>")
   topFive.forEach {
       val userID = `User Link`.toString()
       val average = `Average Answer Score`
       val linkMarkup = htmlLink(userID, soUrl(userID))
       append("<li>User $linkMarkup with an average of $average</li>")
   }
   append("</ul>")
}

DISPLAY(HTML(content))
This is what should be displayed:
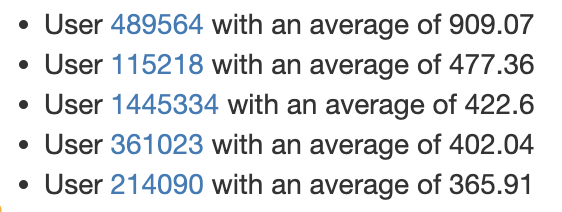
You should be able to click on any of the links to open a particular contributor’s page in your browser.
Displaying data as HTML is useful but requires effort to produce visually appealing results. As a simpler alternative, you can take advantage of the Kandy library to visualize the data. Let’s try it for our top five contributors using a bar chart.
First, load the Kandy library in a separate cell (for the reasons discussed above):
%use kandy
Then, plot the contributors, with their User IDs on the x-axis and their average answers on the y-axis:
plot {
   bars {
       x(topFive.map { "ID: $`User Link`" })
       y(topFive.map { `Average Answer Score` })
   }
}
This is what should be displayed:
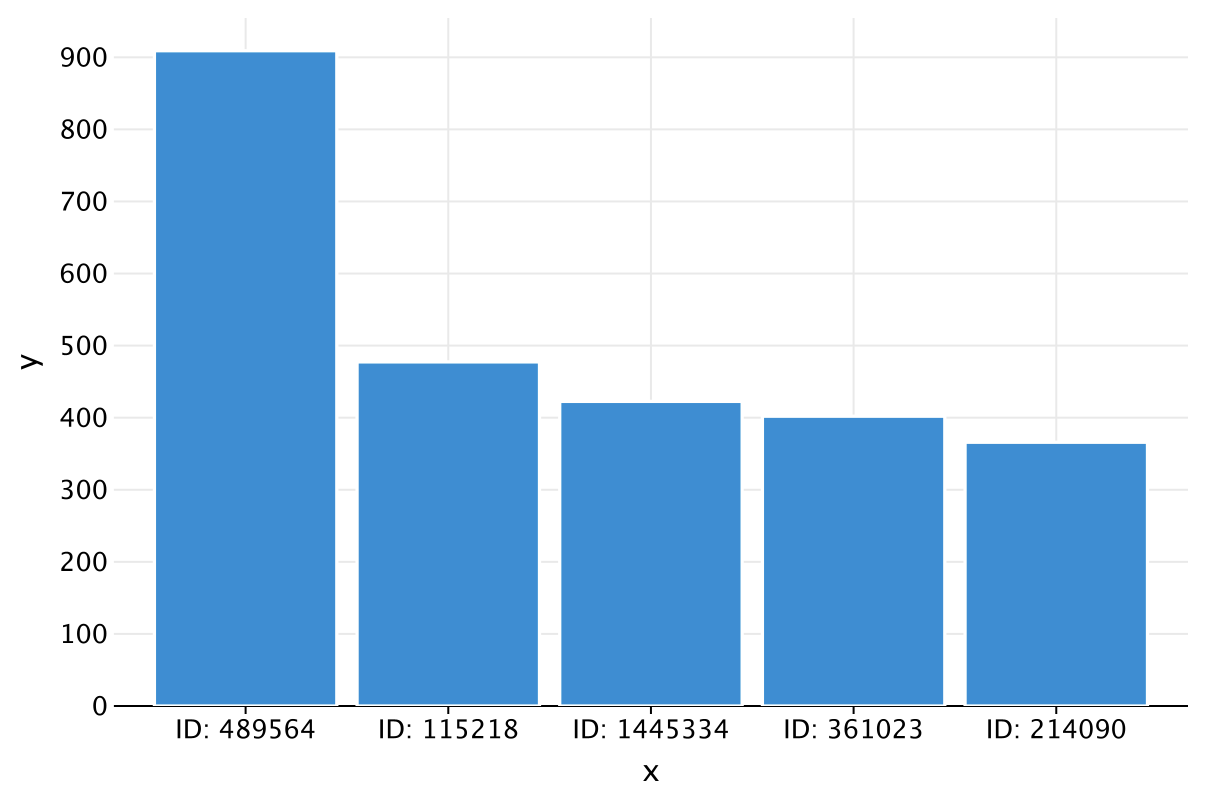
That is an impressive result for relatively little effort! Now that you have some idea of the power of the DataFrame library, let’s take a step back for a moment and review some core concepts.
What is a dataframe?
A dataframe is an abstraction for working with structured data. It is a table created by reading from a source such as a CSV file, a JSON document, or a database. The dataframe contains one or more named columns, whose content can be of different types.
The content of a column can be any Kotlin object, including another dataframe. This feature allows you to store and manipulate hierarchical data.
The DataFrame API implements all the operations a functional programmer or database admin might require. The API is immutable, so any operation that has the potential to alter the dataframe instead produces a new instance. The underlying data is reused whenever possible for efficiency and performance.
One of the greatest strengths of the Kotlin DataFrame library is that it is typesafe. You can generate strongly typed extension properties that correspond to the columns in the dataframe. You will explore this in depth in the next section.
Please note that when working in Kotlin Notebook, these properties are created on the fly.
Accessing values in dataframes
The good news with dataframes is that, if you have previously used Kotlin collections or any modern data structures libraries, then you can immediately start work. All the standard operators of functional programming work as you would expect, right out of the box.
Let’s add up the total number of answers of all the contributors. Add and run a new code cell containing the expression below:
topFolks.map { Answers }.sum()
You can use the familiar map and sum operations to calculate the total. For the purposes of this demo, you could use the general-purpose reduce operator:
topFolks.map { Answers }.reduce { a, b -> a + b }
This should give you the same result as before. As discussed previously, properties have been added to the dataframe for each of the fields in the CSV file. These extension properties make it simple to access and manipulate the data in a type-safe way.
You can manage without these extension properties if required, for example, by creating column accessor functions:
val Answers by column<Int>()

topFolks.map { Answers() }.sum()
Standard operations with dataframes
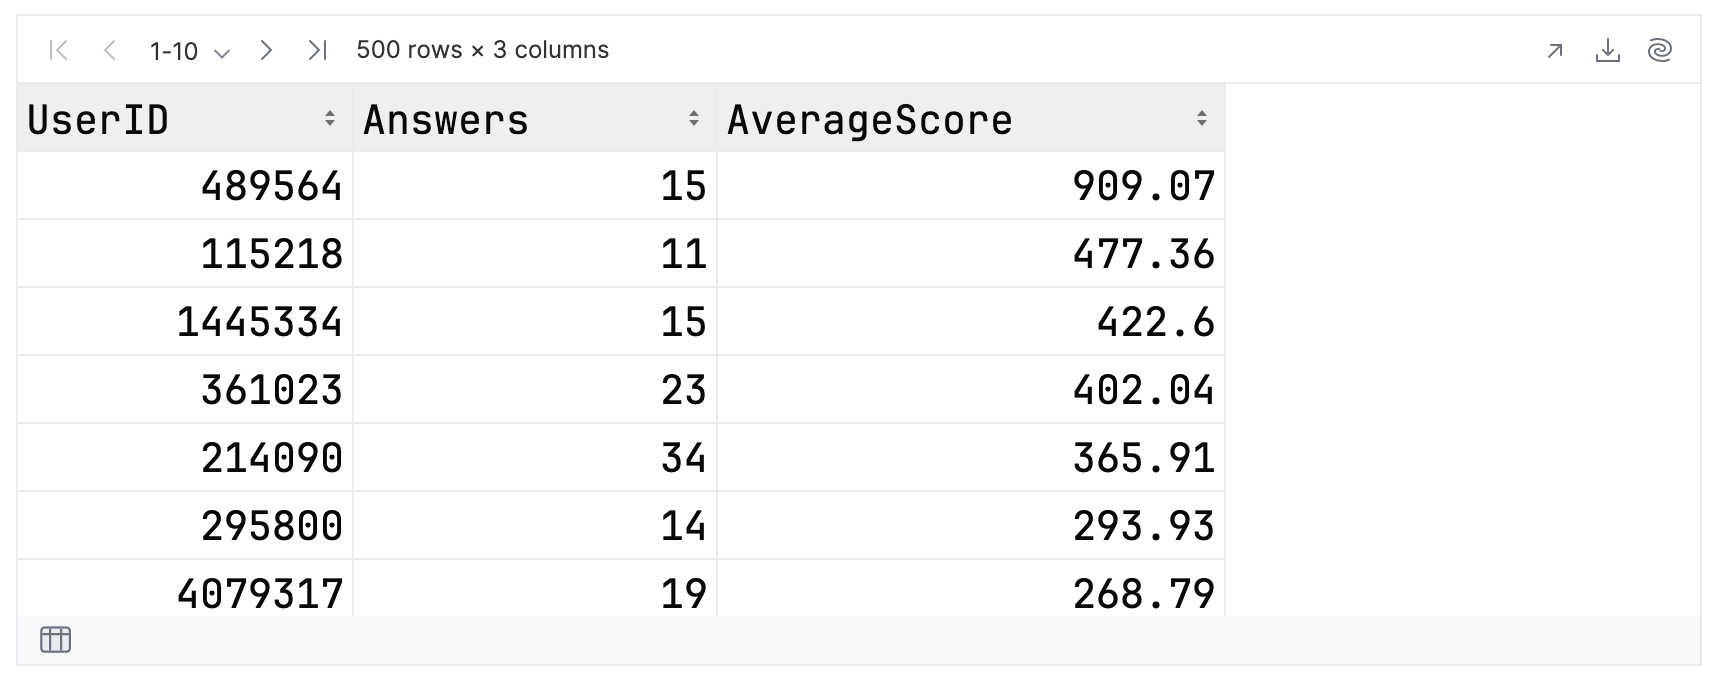
Before we explore some more of the built-in operations, we should first clean up the data a little. You can rename the last two columns for clarity and convenience:
val topFolksClean = topFolks
   .rename { `Average Answer Score` }.into("AverageScore")
   .rename { `User Link` }.into("UserID")

topFolksClean
You should see that the column names have been modified:
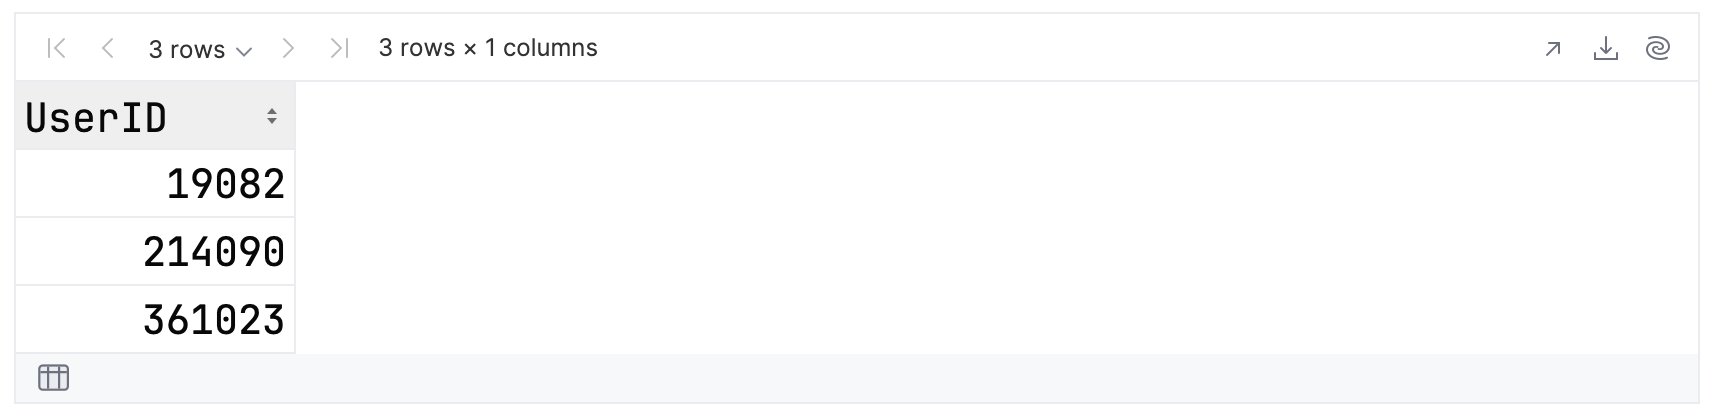
Now, enter and run the expression below:
topFolksClean
   .filter { Answers >= 20 }
   .sortBy { AverageScore }
   .tail(3)
   .select { UserID }
As you can see, you have a chain of operations, which:
- Filters the records to include only contributors that answered 20 or more questions.
- Uses sortBy to sort the remaining records in ascending order by the average score.
- Takes the top three results, which will be at the end of the sorted dataframe.
- Extracts the IDs of the contributors into the final dataframe.
Your output should be similar to this:
If you are familiar with SQL then the select operation will make sense to you, although now it appears at the end of the statement. You can think of the filter operation as the equivalent of the WHERE clause and the sortBy operation as the equivalent of ORDER BY.
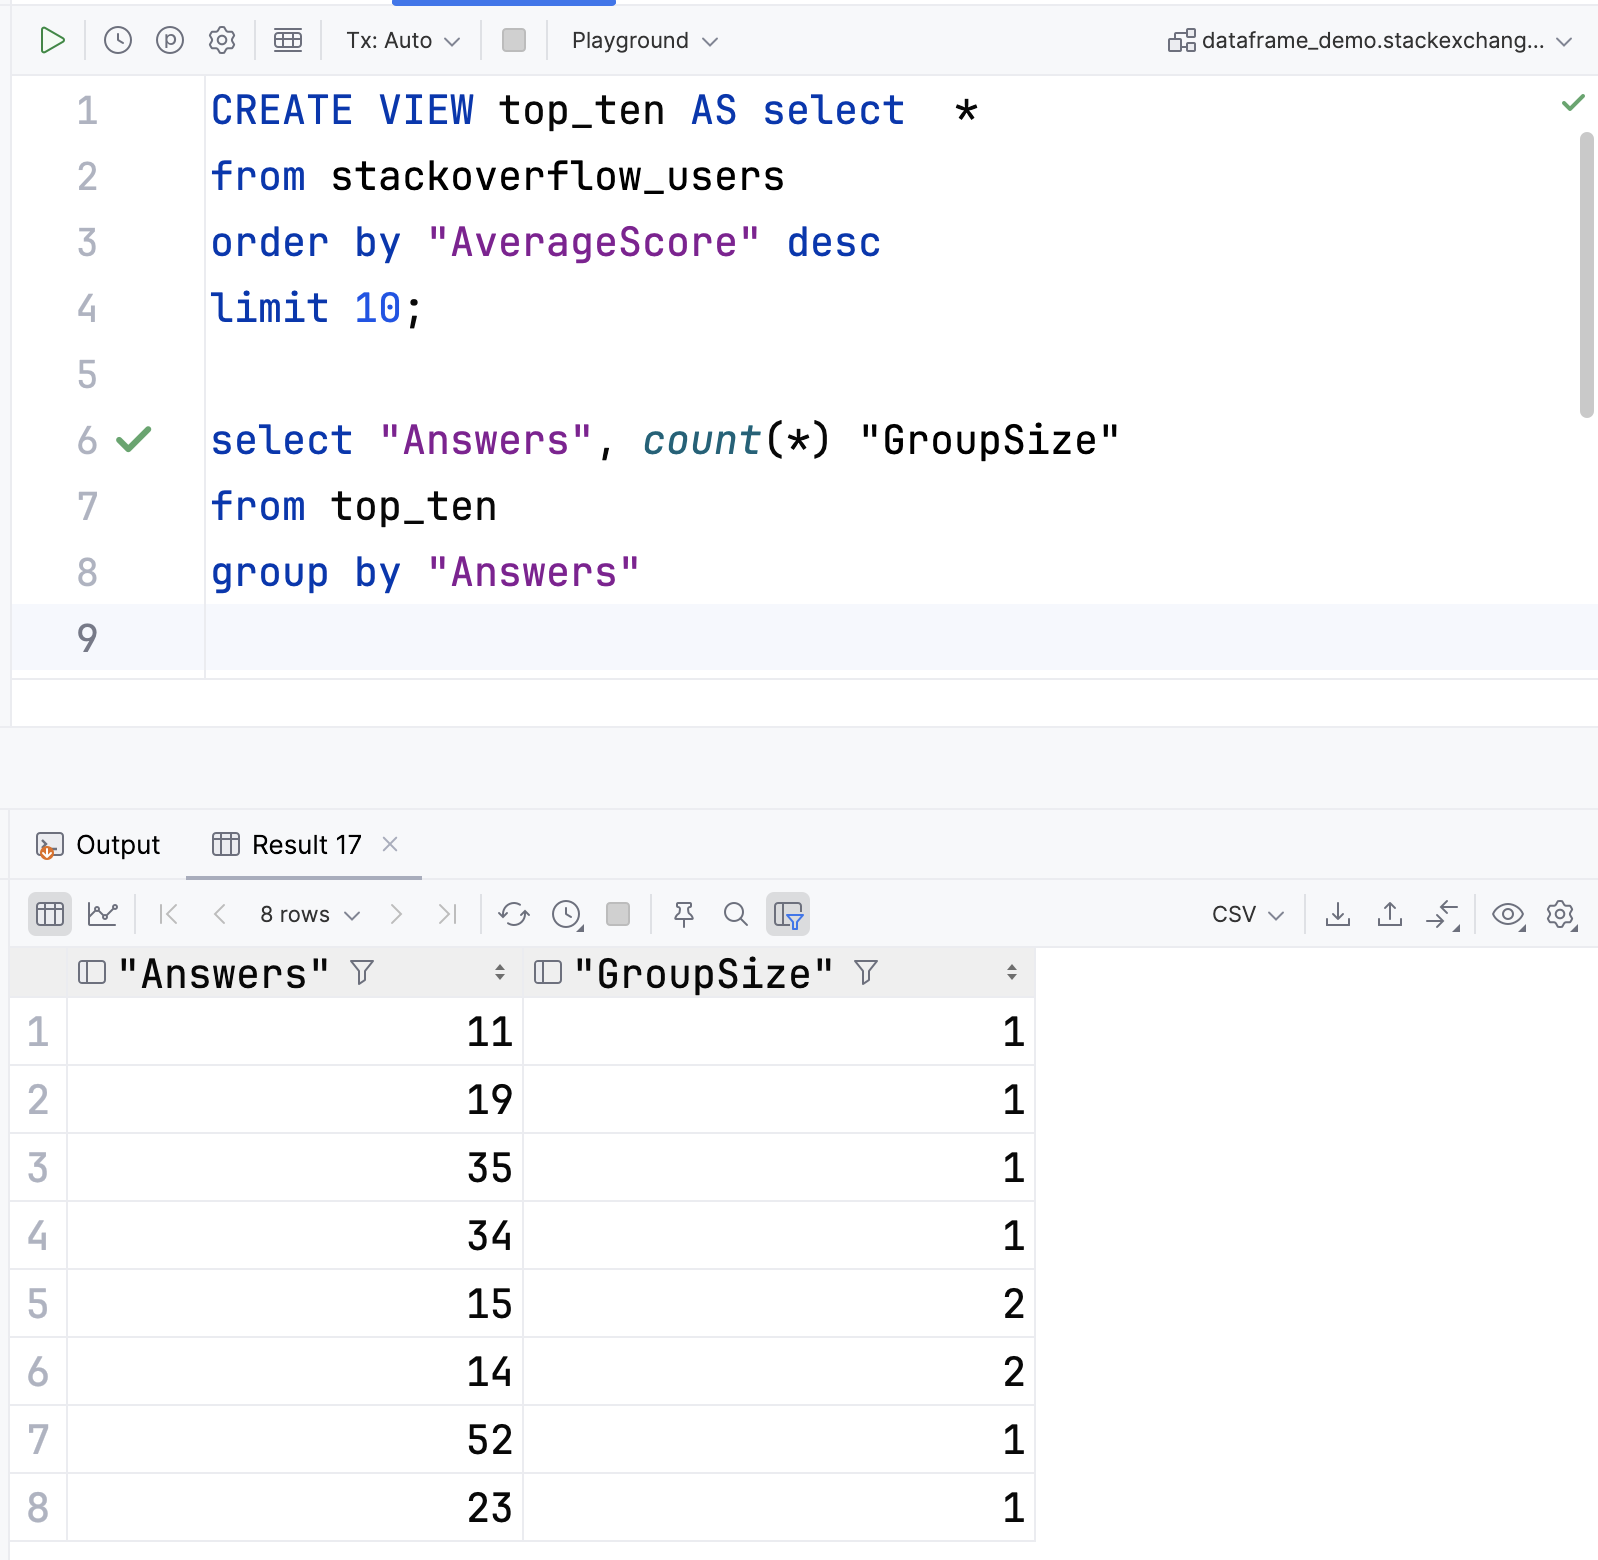
For example, given a database table in PostgreSQL, you could create and run the following query in DataGrip:
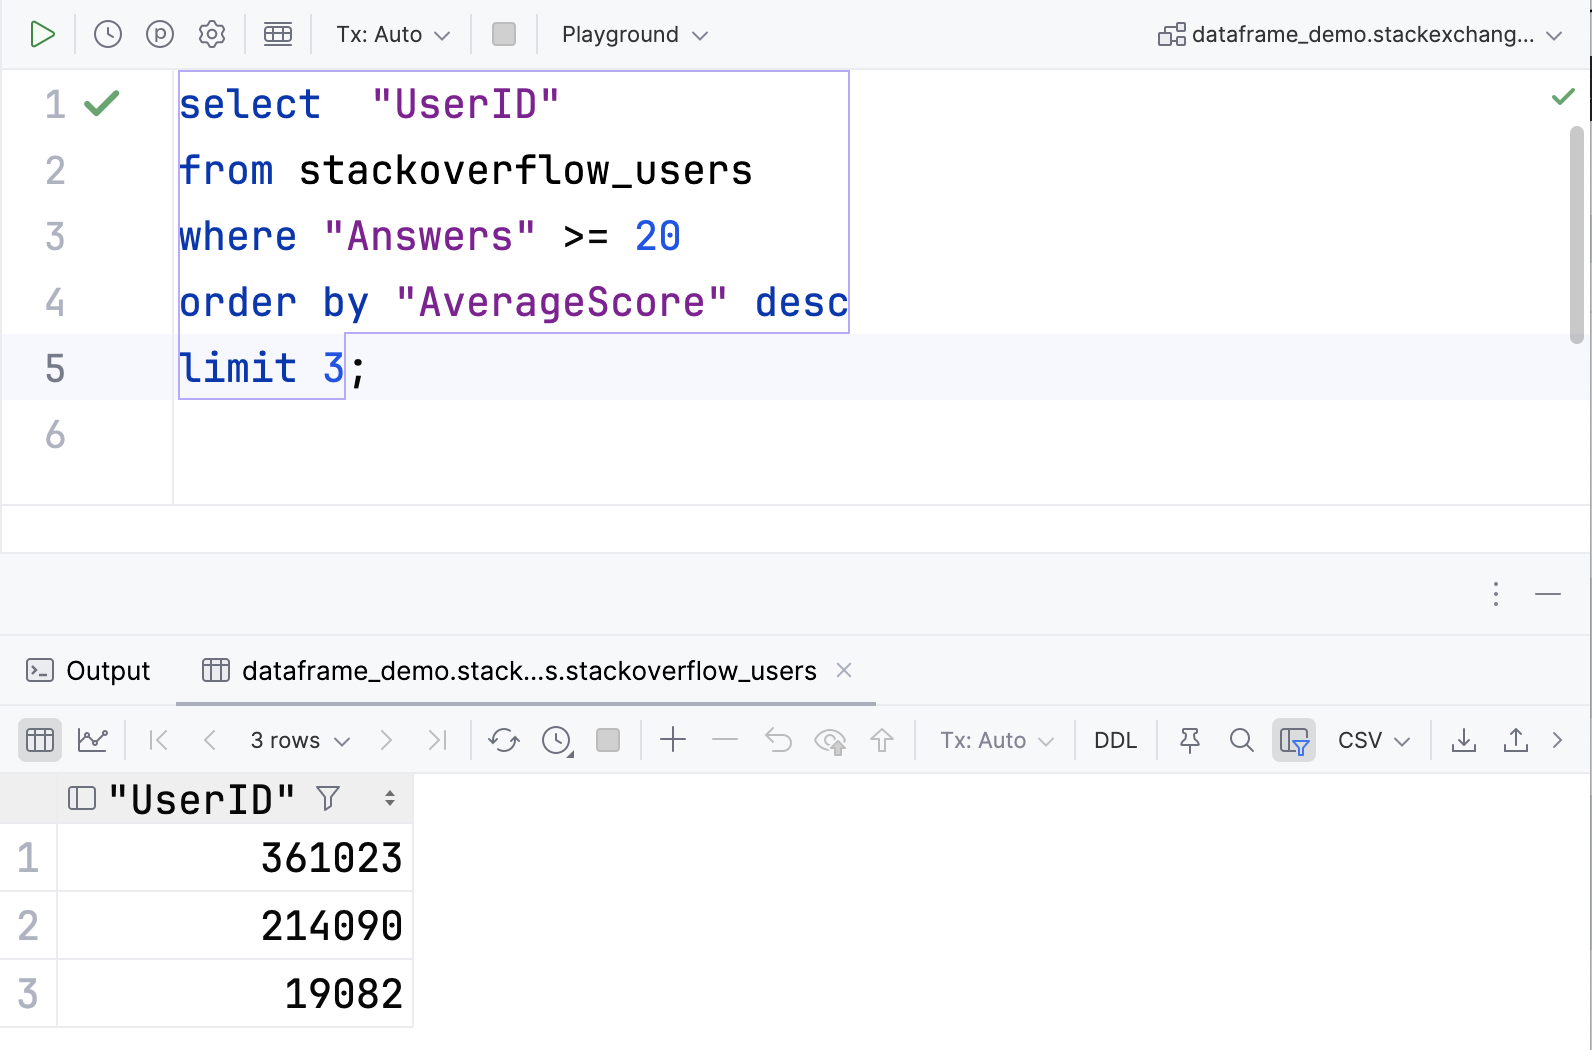
Note that the API contains both select and map operators for performing transformations.
distinct
From looking through the data you can see that the numbers of questions answered by contributors are not unique. For example, more than one contributor answered 15 questions. You can find out how many duplicates there are as follows:
topFolksClean
   .distinctBy { Answers }
   .count()
For the data at time of writing, this gives a result of 93, which means that the 500 contributors could be allocated into 93 groups, based on how many questions they answered. The distinctBy operation does not perform this grouping, it simply selects the first row from every group.
If you were to sort the contributors, by average answer score and in descending order, then the distinctBy operation should only select the highest-scoring contributor for each group. Let’s try to validate this, using the built-in operations.
You can first examine the original CSV file and pick a value from the Answers column, which occurs more than once. In this example, the repeated value is 15:
topFolksClean
   .filter { Answers == 15 }
This is the associated output. There are 22 rows, which the notebook will display in groups of 10.
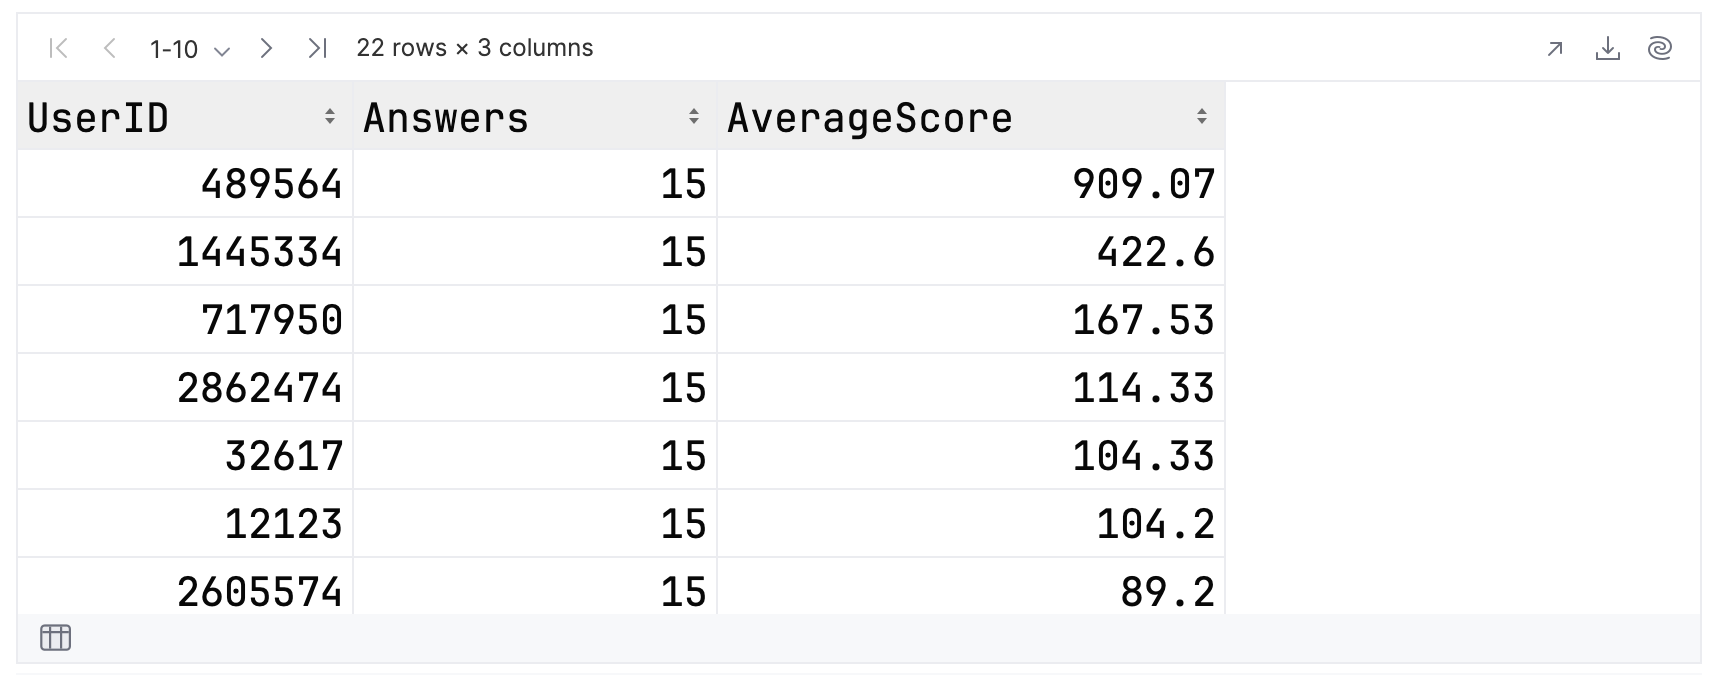
In our results, the highest score for this group is 909.07, and the lowest is 58.33. When examining your own results, don’t forget to page through the whole dataset!
If you sort in ascending order and use distinctBy, then there will be a single contributor with an Answers value of 15:
topFolksClean
   .sortBy { AverageScore }
   .distinctBy { Answers }
   .sortBy { Answers }
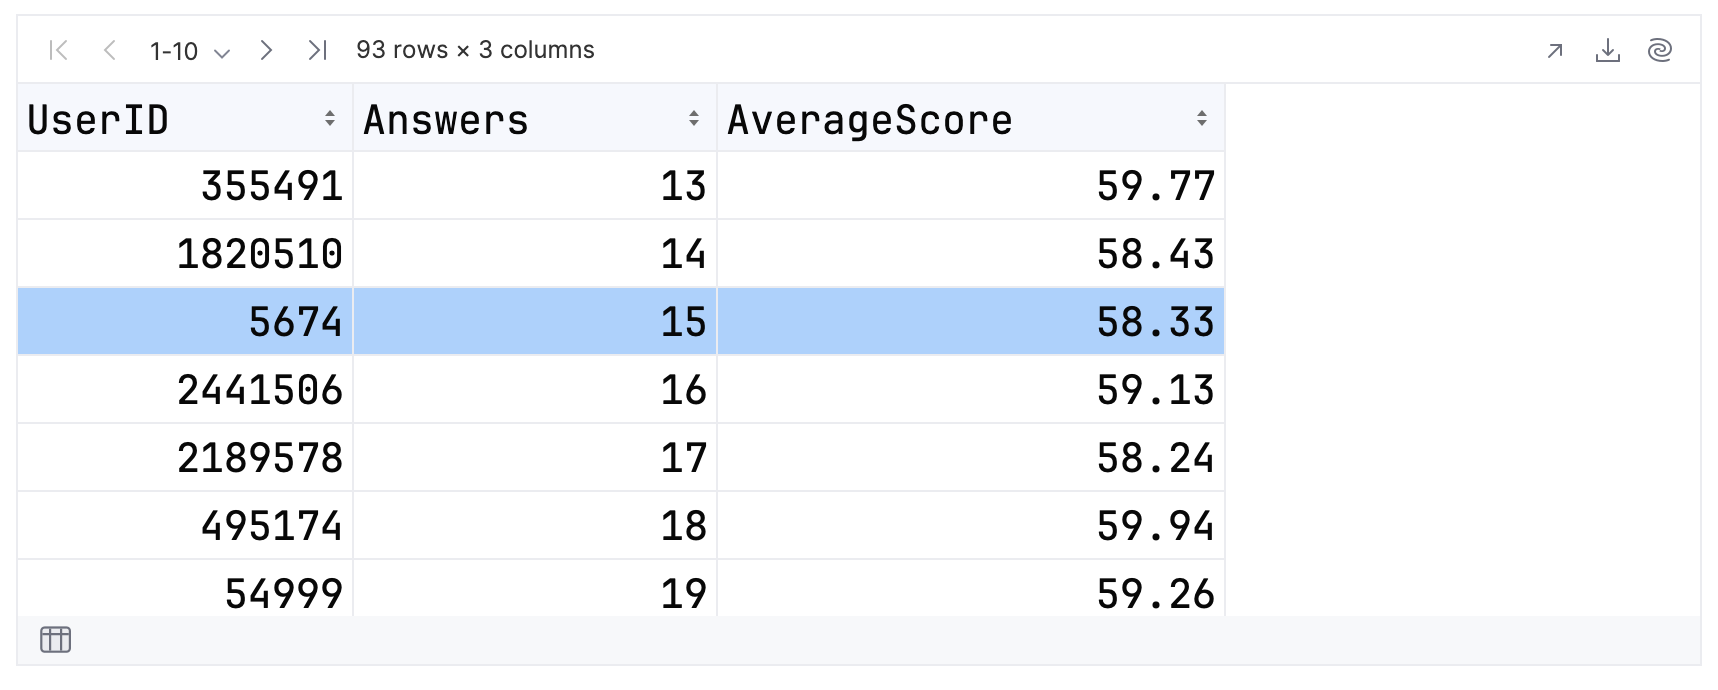
Since you are sorting in ascending order the single contributor will have a score of 58.33. As you can see from the highlighted row this is the case.
On the other hand, if you sort in descending order then the contributor shown in the results should have a score of 909.07. Let’s confirm this:
topFolksClean
   .sortByDesc { AverageScore }
   .distinctBy { Answers }
   .sortBy { Answers }
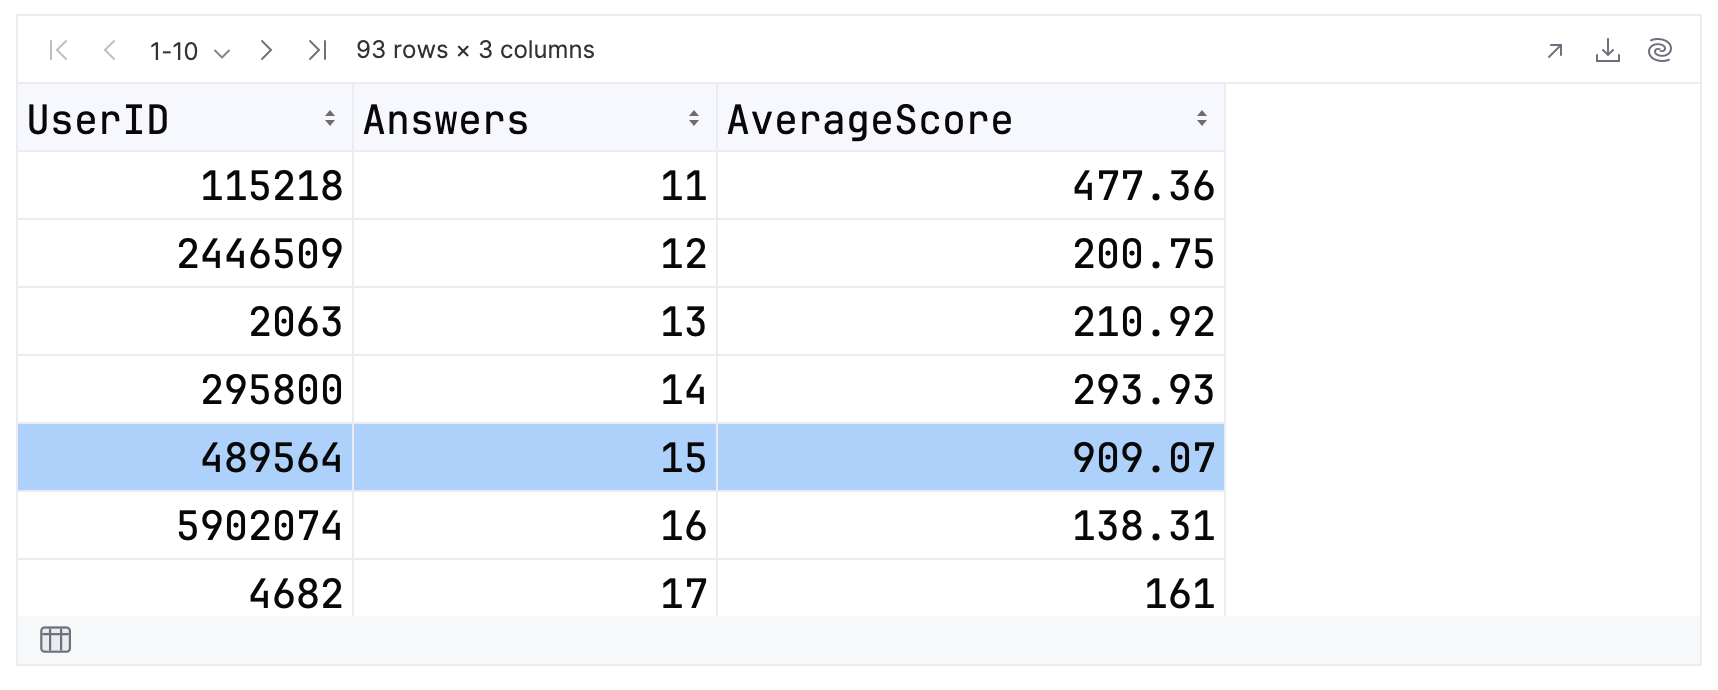
Once again, you get the expected score.
group
Now that you have a better understanding of the data, let’s go ahead and perform the grouping using groupBy. For simplicity, you will only group the top 10 results:
topFolksClean
   .sortBy { AverageScore }
   .tail(10)
   .groupBy { Answers }
The data returned by this result is a little more complex. You should see a column containing the keys for the groups, which in this case is the number of answers. Then you will have a column containing the data itself, as a nested dataframe.
This is how the result is represented in the notebook. Note that you can click on the groups to reveal their content:
If you have used the GROUP BY clause in a SQL SELECT statement, then this operation will be familiar to you. Here’s another example from PostgreSQL and DataGrip:
You can explore the grouped data gradually, starting by viewing the keys:
val groupedData = topFolksClean
   .sortBy { AverageScore }
   .tail(10)
   .groupBy { Answers }

groupedData.keys
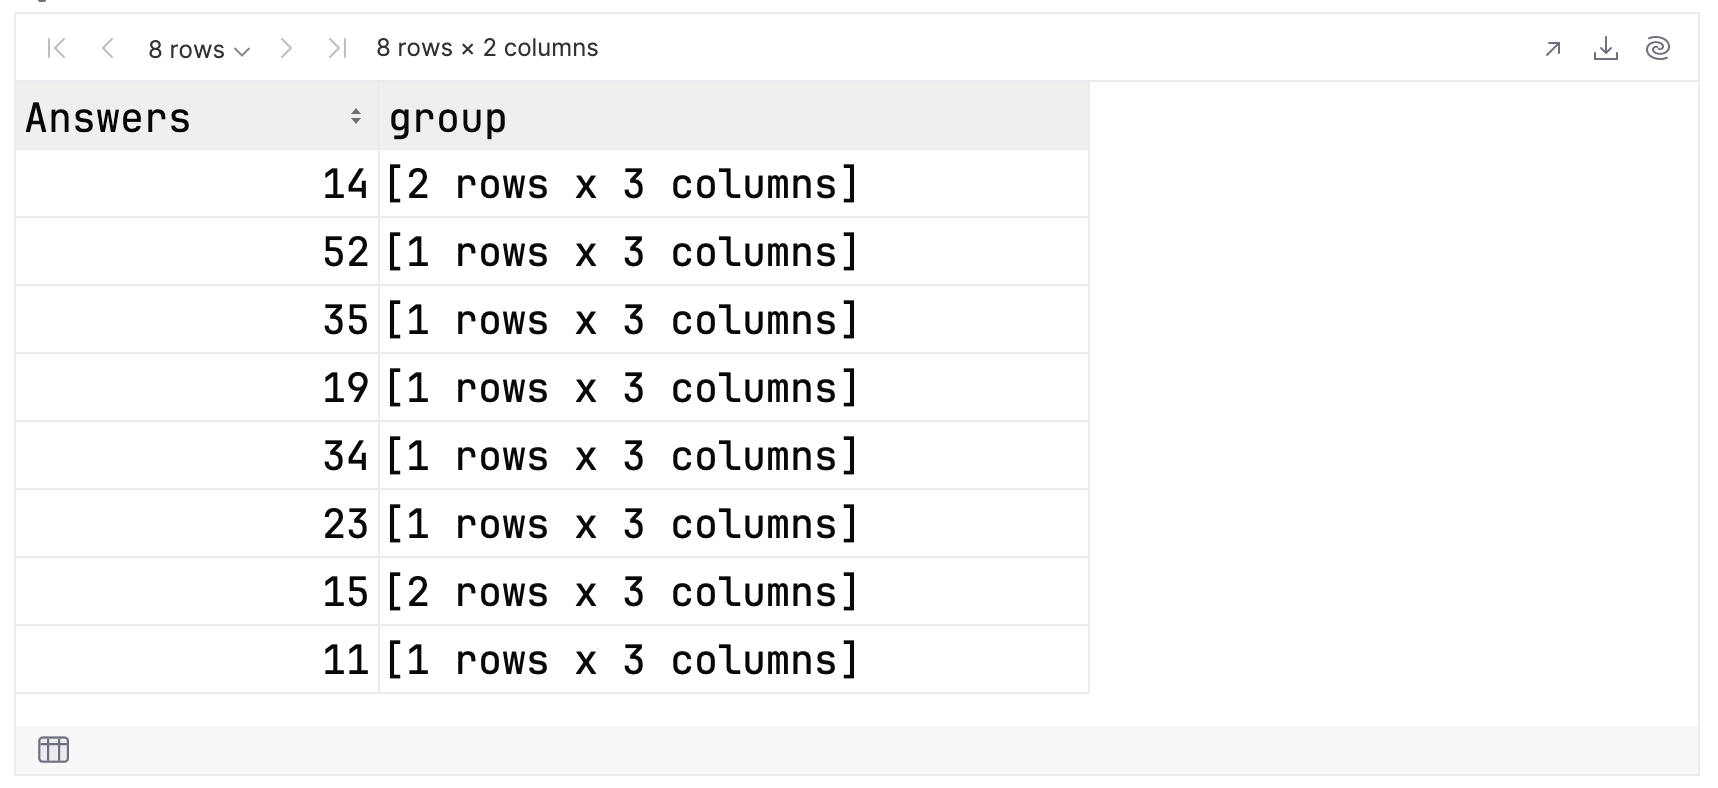
Then, you can print the groups:
groupedData.groups
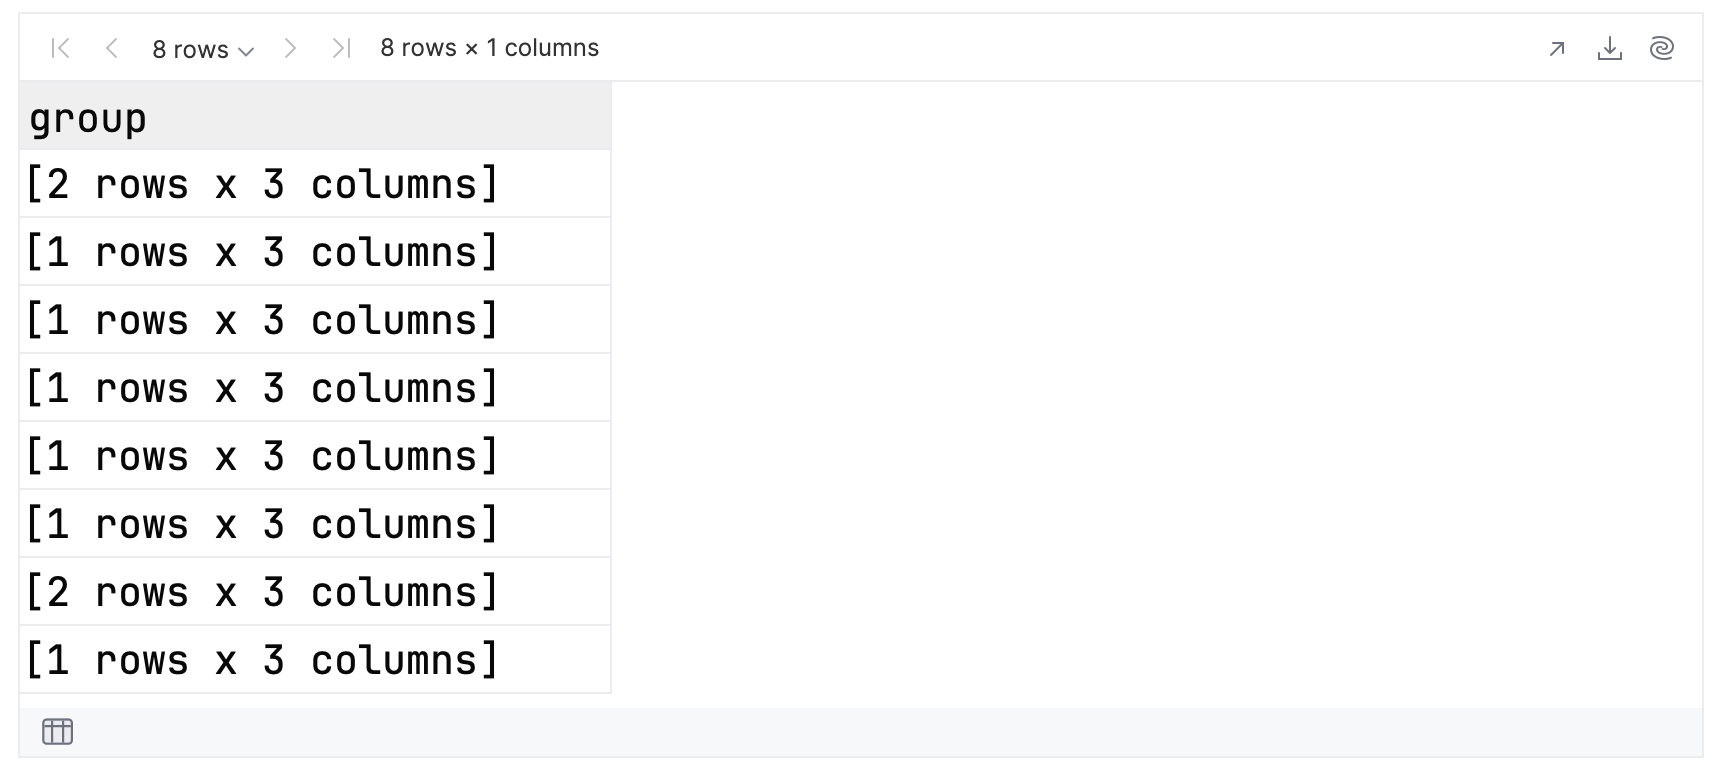
If you expand each group to view its contents, you can see that the groups for 14 and 15 answers have two members, and all the others have one. Hence, for the top 10 results, you have eight groups in total.
filter
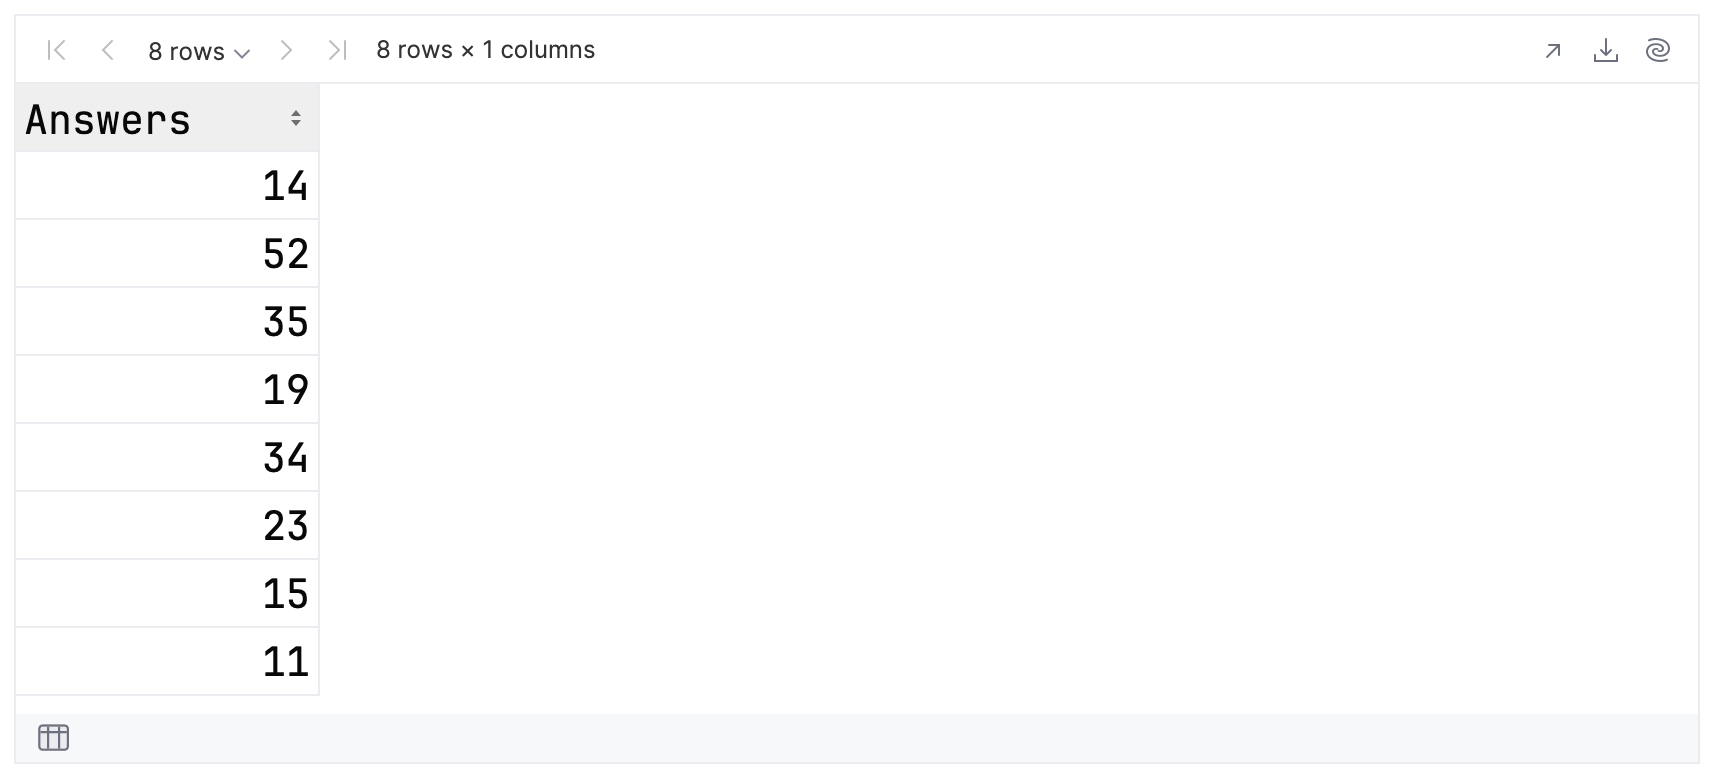
Let’s see if you can use the core operations to find and display the groups with more than one result:
groupedData
   .groups
   .filter { df ->
       df.rowsCount() > 1
   }.forEach { df ->
       println(df.first().Answers)
   }
This code filters the groups, to find those with more than one row. Then it iterates through each group, printing the number of answers. Each row in an individual group will have the same number of answers, so you can pick any row you like. In this example, we chose the first.
The filter returns two numbers:
14
15
Because groups is returning a column of dataframes, the signatures of the filter and forEach methods are slightly different. Each time your lambda is invoked, there will be a single parameter, whose value is the current dataframe.
Altering the DataFrame schema
When working with dataframes, you are not limited to the schema that was inferred when the dataframe was created. You can add columns, remove columns, and even change the data type of existing columns. Consider the example below:
val ratedFolks = topFolksClean
   .sortBy { AverageScore }
   .remove("Answers")
   .add("Rating") {
       when (AverageScore) {
           in 0.0 ..< 100.0 -> "Low"
           in 100.0 ..< 300.0 -> "Medium"
           else -> "High"
       }
   }
Here you take the sorted data, remove the Answers column, and add a new Rating column, which is derived from the AverageScore. This gives us a new dataframe, which you refer to as ratedFolks.
As an example, you can then view the first and last three rows by concatenating them into a new dataframe:
val topAndBottom = listOf(ratedFolks.head(3), ratedFolks.tail(3)).concat()

topAndBottom
This is what should be displayed:
Note that this is achieved via an extension function, added to the standard Iterable type. Extensions are a key feature in Kotlin for making libraries simple and convenient to use.
Visualizing your data
As you have already seen, you can take advantage of the Kandy library to plot the data. Let’s try to visualize which values of Answers occur most frequently in the data.
Enter and run the following:
val answersPairedWithCounts = topFolksClean
   .groupBy { Answers }
   .count()
   .filter { column<Int>("count") >= 20 }
This code will group the records based on the number of answers and then replace each group with its size. For simplicity, let’s view only those groups with 20 or more members:
answersPairedWithCounts
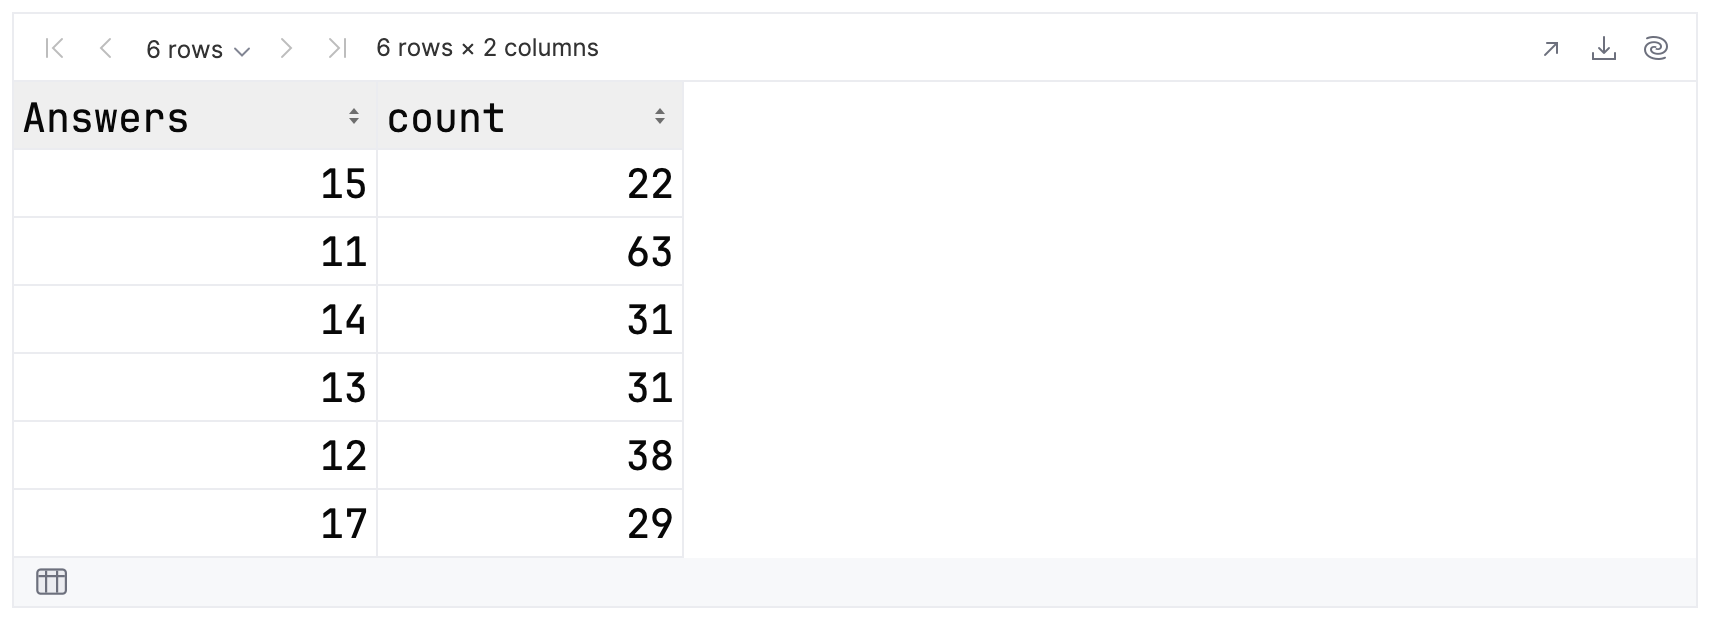
Now, let’s ask Kandy to plot this dataframe as a bar chart:
answersPairedWithCounts.plot {
   bars {
       x(Answers)
       y(count)
   }
}
This is the resulting chart:
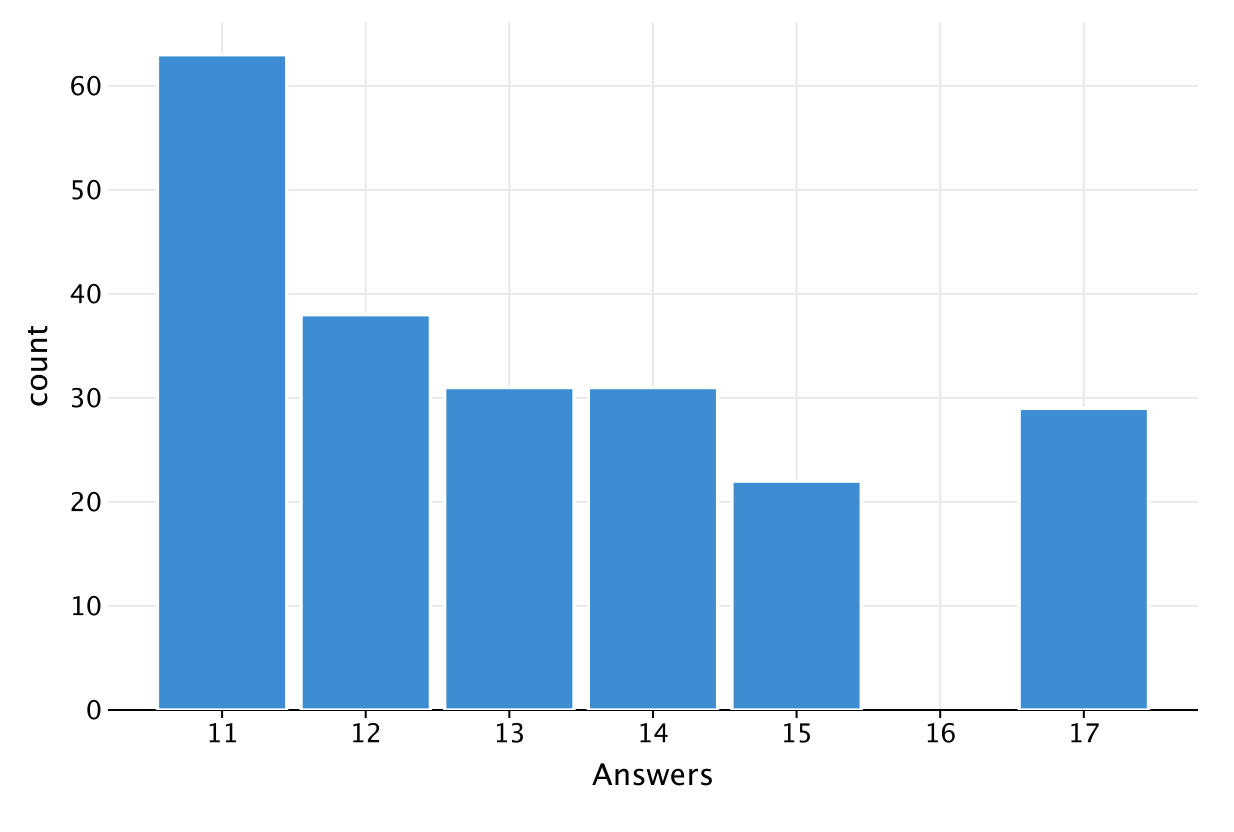
You can see that the most common number of questions answered was 11, occurring 63 times in the data.
Note that you already loaded the Kandy library in an earlier example:
%use kandy
If you skipped that example, then you will need to load the library now. As we mentioned earlier, it is best to do this in a separate cell.
Exporting your results
So far, you have only viewed your results and have not saved them. Let’s now take a look at how you can export data from Kotlin Notebook. In the two expressions below, you create a new dataframe and then export it as a CSV file and JSON document:
topFolksClean
   .sortBy { AverageScore }
   .tail(10)
   .toCsv()

topFolksClean
   .sortBy { AverageScore }
   .tail(10)
   .toJson()
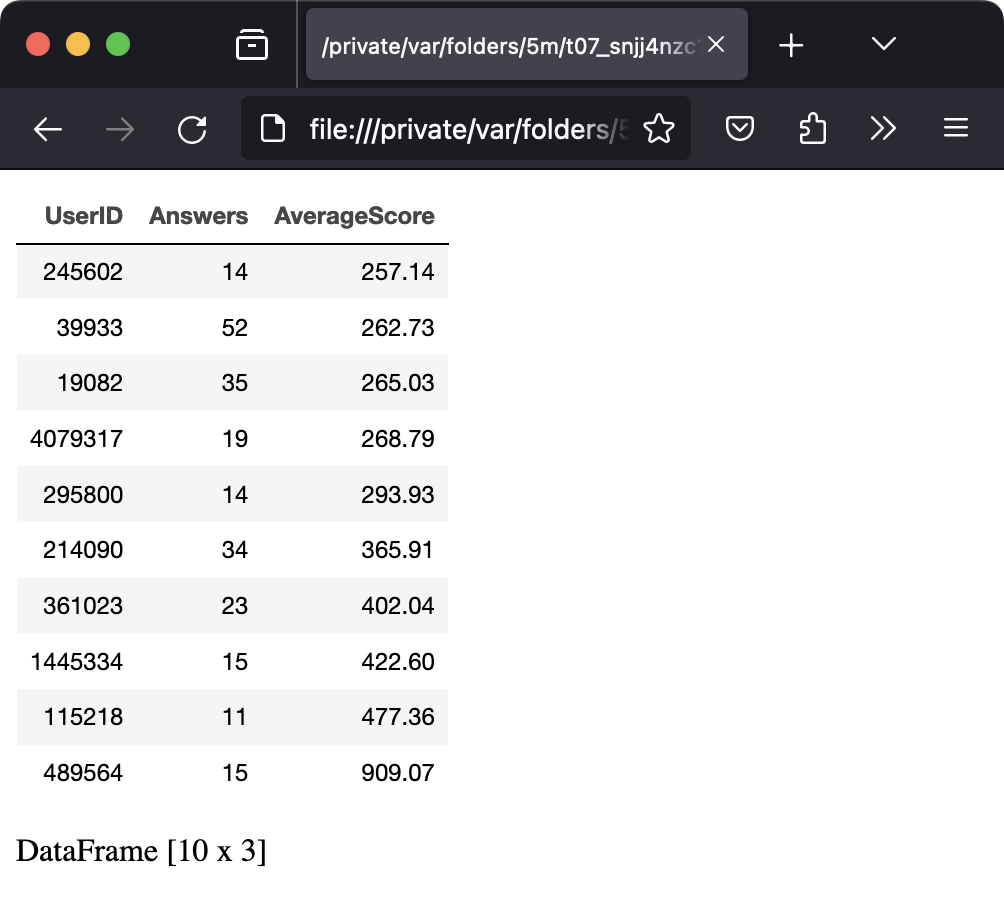
Exporting a dataframe to HTML works the same way. The toStandaloneHTML method produces an HTML document containing a table, with associated CSS styles and JavaScript event handlers. This document can be opened directly in your default browser:
topFolksClean
   .sortBy { AverageScore }
   .tail(10)
   .toStandaloneHTML()
   .openInBrowser()
Conclusions
Hopefully, this tutorial has demonstrated the power and utility of the Kotlin DataFrame library. Please remember that the sample project contains data files and notebooks for all the tutorials in this series. You can clone this project and easily modify the examples, or replace the sample data files with your own.
In the next tutorial, we’ll show how to work with the Stack Exchange REST API to obtain JSON data. The information in this next installment will be both more complex and hierarchical, allowing you to see more of the power of the DataFrame API.
Subscribe to Kotlin Blog updates


