Debugger Configuration Validation with PhpStorm

 While it’s very straightforward to set up PhpStorm’s debugger, nothing is more frustrating than not getting it to work because of a tiny configuration mistake in php.ini. Speaking for myself, I’ve missed xdebug.remote_enable on a number of occasions, which usually happen at the most inconvenient time.
Using the Debugger Configuration Validation introduced with the latest version of the PhpStorm 7 EAP, we can now easily validate our debugger setup and have PhpStorm tell us if we’ve missed something! PhpStorm can verify our configuration of Xdebug and Zend Debugger. Here’s how.
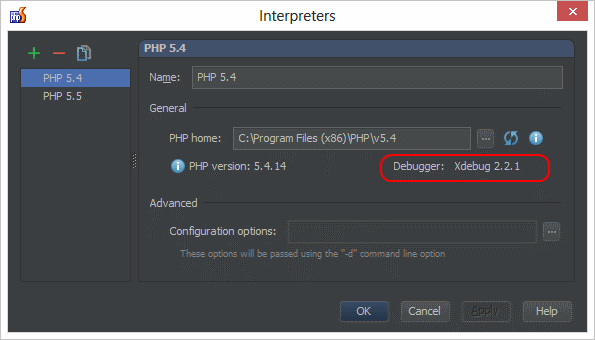
When configuring the PHP interpreter for our project, PhpStorm will inform us if a debugger is installed and will yield the Xdebug or Zend Debugger version used.
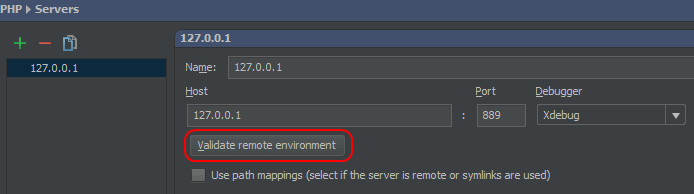
From the Settings | Project Settings | PHP | Servers window, we can validate our debugger setup using the Validate Remote Environment button.
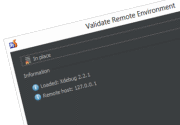
This will open a new window where we can test the deployment environment on which we want to attach the debugger and validate the debugger configuration. This deployment environment can be “In place”, e.g. a local webserver or a remote server which is accessible by PhpStorm. Once we click Validate, PhpStorm will tell us if anything is missing (and what). Note that it can do that for both Xвebug and Zend Debugger.
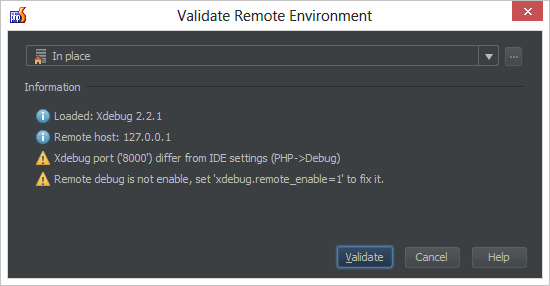
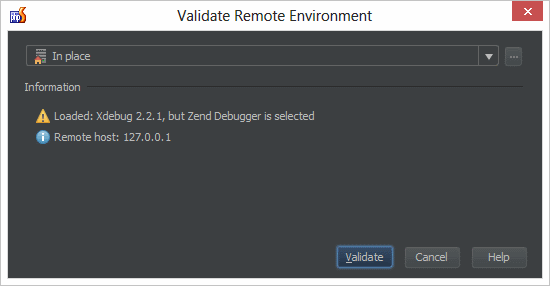
There we are! I missed xdebug.remote_enable again. If we select different options in PhpStorm from our deployment environment, Debugger Validation Configuration will detect that:
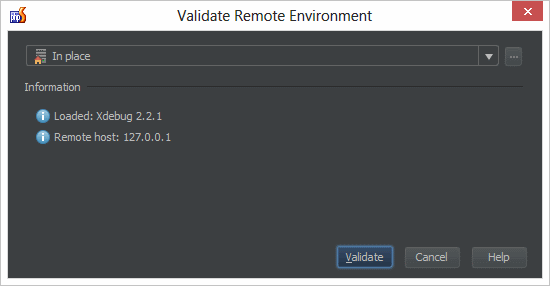
If we’ve configured everything correctly, PhpStorm will be happy to tell:
This new feature will save some time trying to figure out what is wrong with the debugger configuration. Give PhpStorm 7 EAP a try and as always, let us hear your thoughts in the issue tracker, through the comments below or in our forums!
Develop with pleasure!
– JetBrains PhpStorm Team