Just-In-Time debugging and PHP Exception Breakpoints with PhpStorm and Xdebug
 In every project comes a moment where code stabilizes and we don’t want to keep the debugger attached to our code all the time. Or maybe we just want to run our code and only attach the debugger when an error occurs or an exception is thrown. Meet Xdebug’s just-in-time (jit) mode and PHP Exception Breakpoints in PhpStorm!
By default, Xdebug will only connect to our IDE after we enable remote debugging and use a specific HTTP GET/POST variable to start the debugger. However, we can instruct Xdebug to connect only as soon as an error condition occurs, by using the xdebug.remote_mode setting. Setting it to jit instead of the default (req) will do. It can be done in php.ini or dynamically, per script: ini_set(‘xdebug.remote_mode’, ‘jit’);
The remote_mode setting for Xdebug specifies when the debug session will be initiated. req, the default one, will start a debugging session at the script start. jit will start debugging only after an error or Exception occurs.
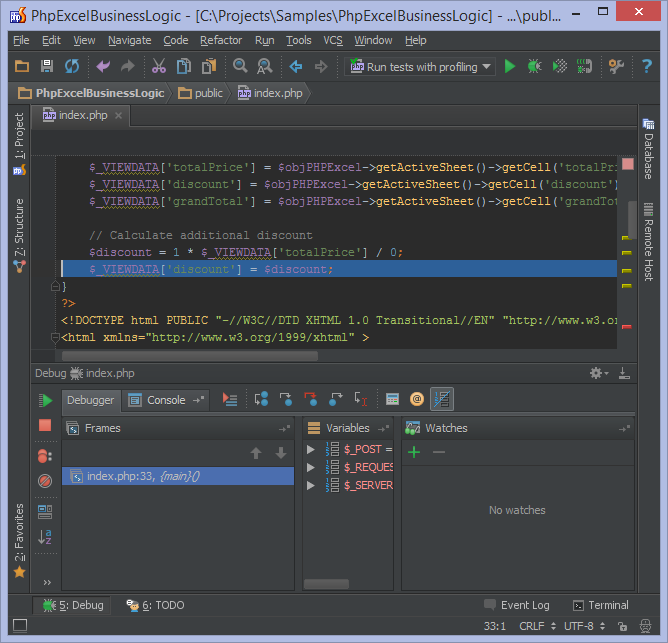
Let’s run some code. After kindly asking PhpStorm to listen for incoming debugger connections (from the toolbar or the Run | Start Listen for PHP Debug Connections menu), Xdebug will only connect to our IDE when an error occurs, such as this nice Division by zero which seems to have slipped into our code base:
From the above screenshot we can also see that PhpStorm halts execution on the line right after the error condition. The reason for that is PHP first has to run the erroneous code before it knows something is wrong.
Here’s another example to illustrate where PhpStorm will break when an Exception has been thrown. If it is handled, the debugger will break at the first line of the catch block if there is one, or the finally block when using PHP 5.5:
Note that when jit debugging is enabled in php.ini, traditional debugging options using HTTP GET/POST variables will not work. For that, Xdebug’s remote_mode setting has to be reverted to “req”.
PHP Exception Breakpoints
Next to jit debugging, the latest PhpStorm 7.1 features PHP Exception Breakpoints. With them we can initiate the debugger at the start of the script and break on our own breakpoints or whenever an error or Exception of a given type occurs. PHP Exception breakpoints do not require the Xdebug remote_mode to be set to jit.
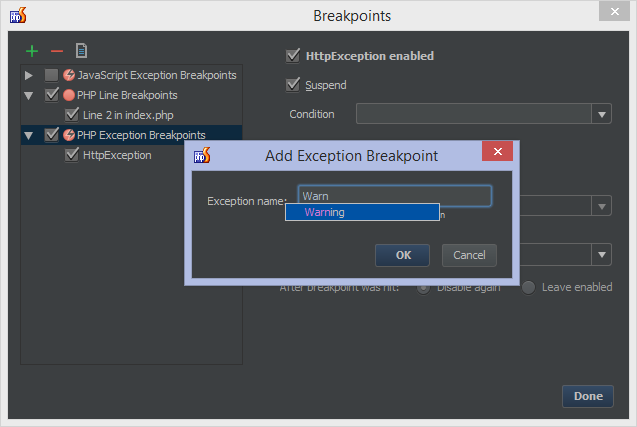
We can open the Breakpoints window (Run | View Breakpoints…) and add the errors or Exceptions we want the debugger to break on. In this window we can specify custom Exception types we want to break on or make use of Warning, Notice or Deprecated to break on PHP error conditions instead. Do note that E_ERROR, E_PARSE and E_COMPILE_ERROR can’t be handled as they halt execution of the PHP engine:
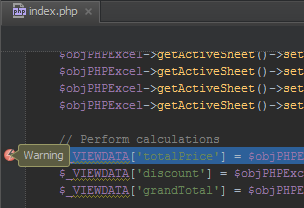
When the debugger breaks on an error or Exception, PhpStorm can give us some additional information about the actual error. To see the type, simply hover over the breakpoint which PhpStorm adds in the editor:
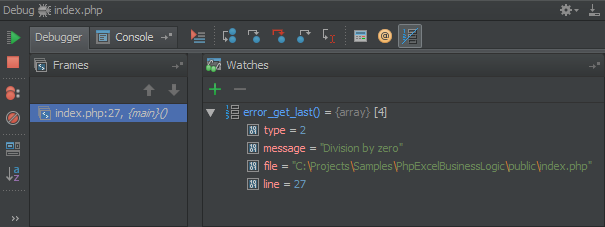
More information on PHP errors can be retrieved by adding a watch for the error_get_last() function:
Give it a try and let us hear your thoughts in the issue tracker, through the comments below or in our forums!
Develop with pleasure!
– JetBrains PhpStorm Team

