Tracing, debugging and profiling JavaScript code with spy-js in PhpStorm
 Forget about the NSA: PhpStorm 8 EAP comes with spy-js, our own secret service that allows tracing our code without console.log, debugging it without breakpoints and profiling it without any specialized tools. All while running our web app (and even other web apps out there on the Internet, it’s a secret service after all). Sounds like some serious espionage, right? Let’s have a quick look at what it can do for us.
A picture is worth a thousand words, and a moving picture is worth ten times that. So here’s a 7-minute introduction video to spy-js:
https://www.youtube.com/watch?v=vPIbwxzC5cU
Let’s order a Vodka Martini (shaken, not stirred), and get down to business.
Enabling spy-js in PhpStorm
While PhpStorm includes all features supported in WebStorm, such as spy-js, not all of them are enabled by default. We can enable the spy-js plugin for PhpStorm through IDE Settings | Plugins, clicking the Install JetBrains Plugin… button and adding spy-js to our IDE. Installing of NodeJS is also required (instructions on their website) because spy-js relies heavily on it.
Spy-js Run Configuration
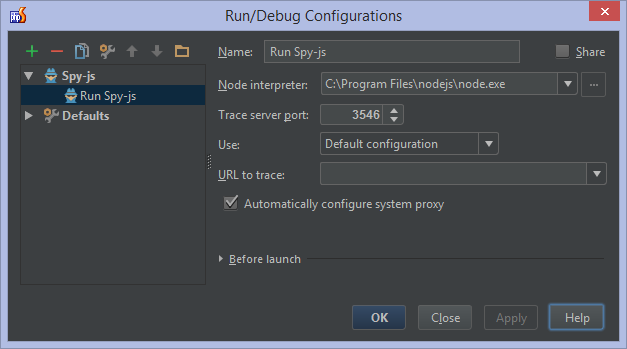
First of all, we will have to create a new Run Configuration. We can specify various options, such as the Node interpreter to use, the trace server port (spy-js will start its proxy server on this port), the tracing configuration and the URL to trace. Note that the URL is not required: if we don’t specify it, our tracing session will capture and display any events from other Internet or local websites (excluding HTTPS) that we visit while the session is still running.
Spy-js works by sending traffic through a proxy. Checking the Automatically configure system proxy option will automatically configure the system proxy on our machine when we start the spy-js Run Configuration, and revert the system proxy settings when we stop it. Mac OS X users may want to follow these instructions to avoid having to enter system credentials every time.
Spy-js in action
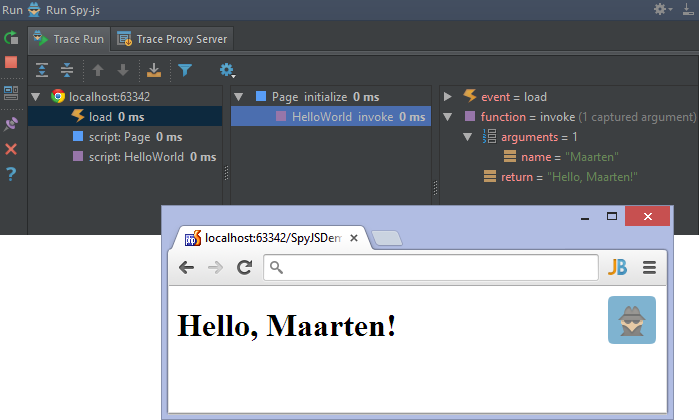
After launching spy-js, we can open our application in the browser. Spy-js will tell us it’s active by displaying its logo in the browser. Once that happens, the spy-js tool window in PhpStorm will also contain information about our app execution.
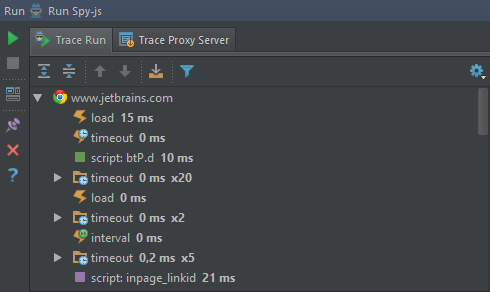
Let’s navigate to www.jetbrains.com and see what happens. Because we did not give spy-js a URL to the page to trace, it will simply trace all web pages we now visit (not for HTTPS). The Events pane will display all DOM events and JavaScript code execution roots. Script names have different colors so they can be distinguished more easily.
When we select an individual event, its stack tree is opened in the Event Stack Pane on the right. Stack tree nodes contain short file and function name, as well as the execution time of the function. We can search the tree for a file or function name by just typing while in the tree.
Some nodes may have their execution time rendered in blue. This means that the function is responsible for more than 50% of the execution time of the expanded stack level: a perfect candidate to look into for performance optimization. Nodes rendered in red have had an unhandled exception occur.
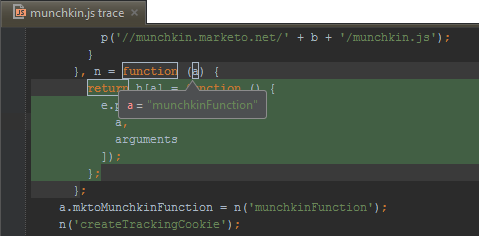
After locating and selecting the function we’re interested in, we can open its trace file with all code execution details. Code is highlighted and we can hover over variables to see their values, or functions to see their return values.
Much more information can be shown in trace files: we can see executed parts of logical expressions and parts of ternary operators. Imagine the code if (1 == 1 || 2 == 2): spy-js will show us only the first expression has been evaluated to enter the if statement’s body.
In this blog post, we’ve highlighted just a few features of spy-js. Head over to the WebStorm blog to dive deep into all the available features and what you can do with them.
Download the latest PhpStorm 8 EAP and give spy-js a test drive! We would love to hear your thoughts through the issue tracker, by posting in the comments below, or in our forums!
Develop with pleasure!
– JetBrains PhpStorm Team
Subscribe to PhpStorm Blog updates


