Debugging VVV Vagrant Setup With PhpStorm

It started with a Tweet:
Who do i know that uses PHPstorm with VVV and XDebug? I need some guidance on getting things setup.
— Andrew Woods (@awoods) June 21, 2016
Recently we’ve made a lot of changes to debugging in PhpStorm to try and make the process as simple as possible. So I decided to blog about not only how to get debugging working, but the process I used to figure out exactly what needed to be changed.
Varying Vagrant Vagrants is a Vagrant setup designed to make working with WordPress as easy as possible. It has various versions of WordPress running under separate URLs. For this exercise, I installed the plugins that the documentation recommended, and then cloned the repository, and used `vagrant up` to bring the box up and run its provisioners.
The good news is this was really simple and allowed me to hit the current stable version URL at `http://local.wordpress.dev` quickly and easily to see my working WordPress install.
The first thing I did was to open the project in PhpStorm. I’d cloned VVV into the `www` directory in my user’s home folder under the name `vvv`. I didn’t want to confuse everything by opening the various different versions of WordPress in one project, so I just used PhpStorm’s Open Directory option to open a project from `~/www/vvv/www/wordpress-default`. This gave me a project open that linked directly to the webroot of the `http://local.wordpress.dev` URL. It’s important to consider these factors when you are deciding what to make your projects root to make mapping paths easier — more on this later.
At this point, I have no idea how this vagrant box is configured. Is it using Apache? Is it using Nginx and PHP-FPM? Who knows! It’s really not that important, but generally, the first thing I do once I’ve opened the project is to tell PhpStorm which PHP install I’m going to use. Doing this straight away tends to make potential problems less likely to appear further down the line.
The settings we want are found in the Preferences pane under Languages & Frameworks then PHP (if you are as lazy as I am, you can use CMD/CTRL+SHIFT+A to search actions and then type `interp` to go right there). We’ll need to define a new interpreter, so click the […] button next to the Interpreter: drop down, to be taken to the Interpreters management screen.
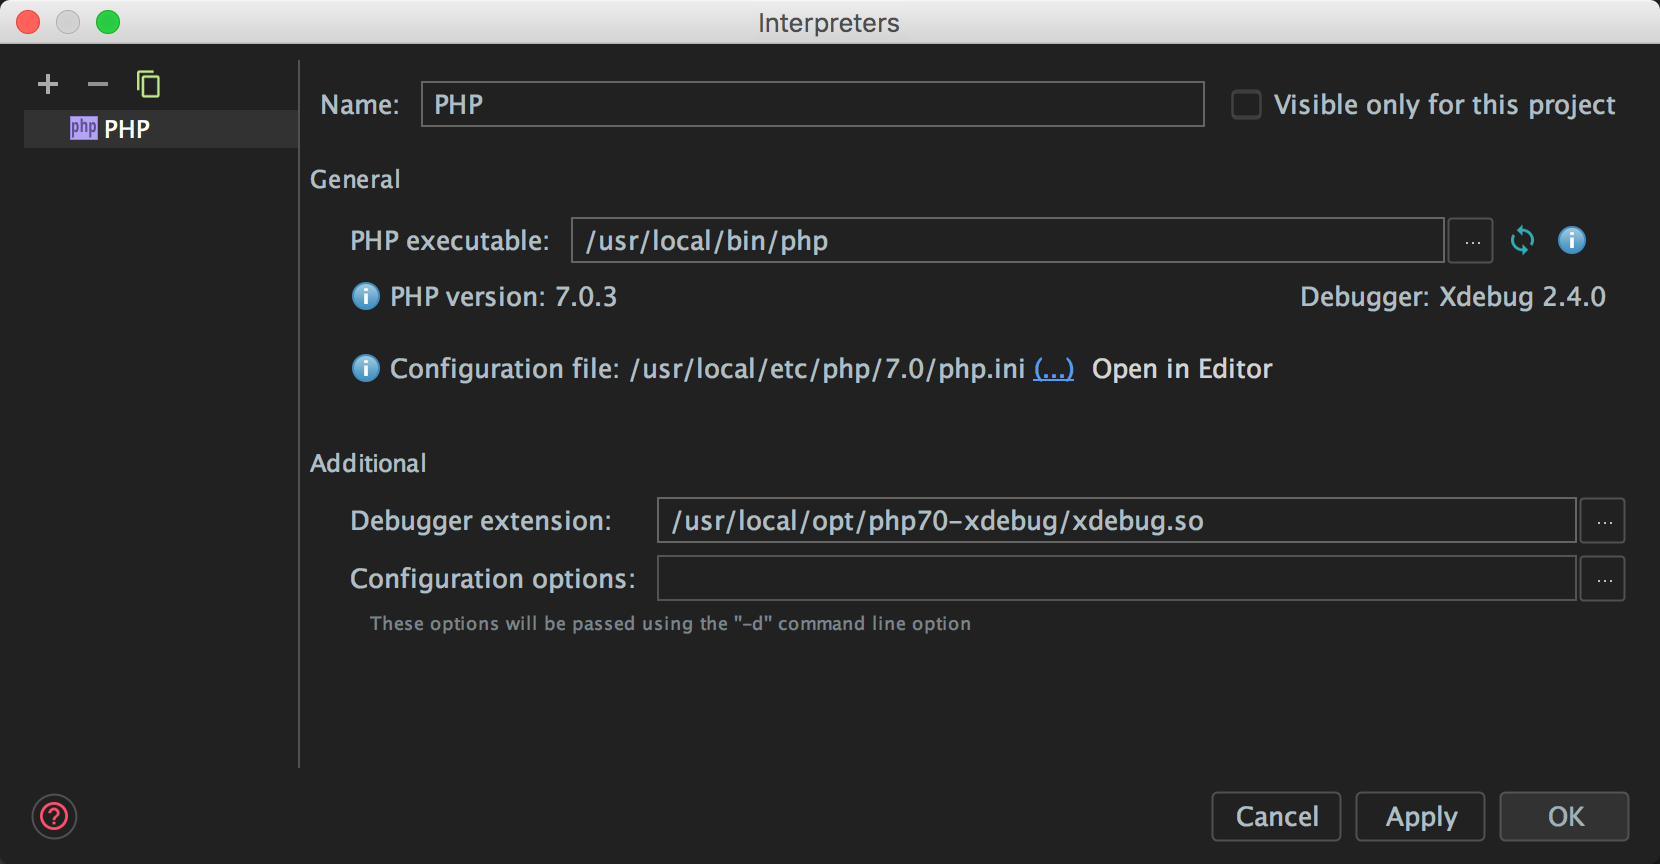
You can see that currently I only have my global local PHP install configured, so we’ll need to create a new interpreter for this Vagrant box to tell the project to use it. It’s relatively straightforward to create an interpreter for a vagrant machine; I used the following steps:
- Clicked the [+] to add a new interpreter and then selected Remote.
- Selected the Vagrant radio box, and in the Vagrant Instance Folder I put the root folder where I cloned VVV – `~/www/vvv/www/wordpress-default`
- PhpStorm thinks for a minute and then fills in the rest of the information correctly, once it did I clicked OK.
- PhpStorm connected to the Vagrant box and confirmed all is well, and then it opened the completed interpreter setting dialog.
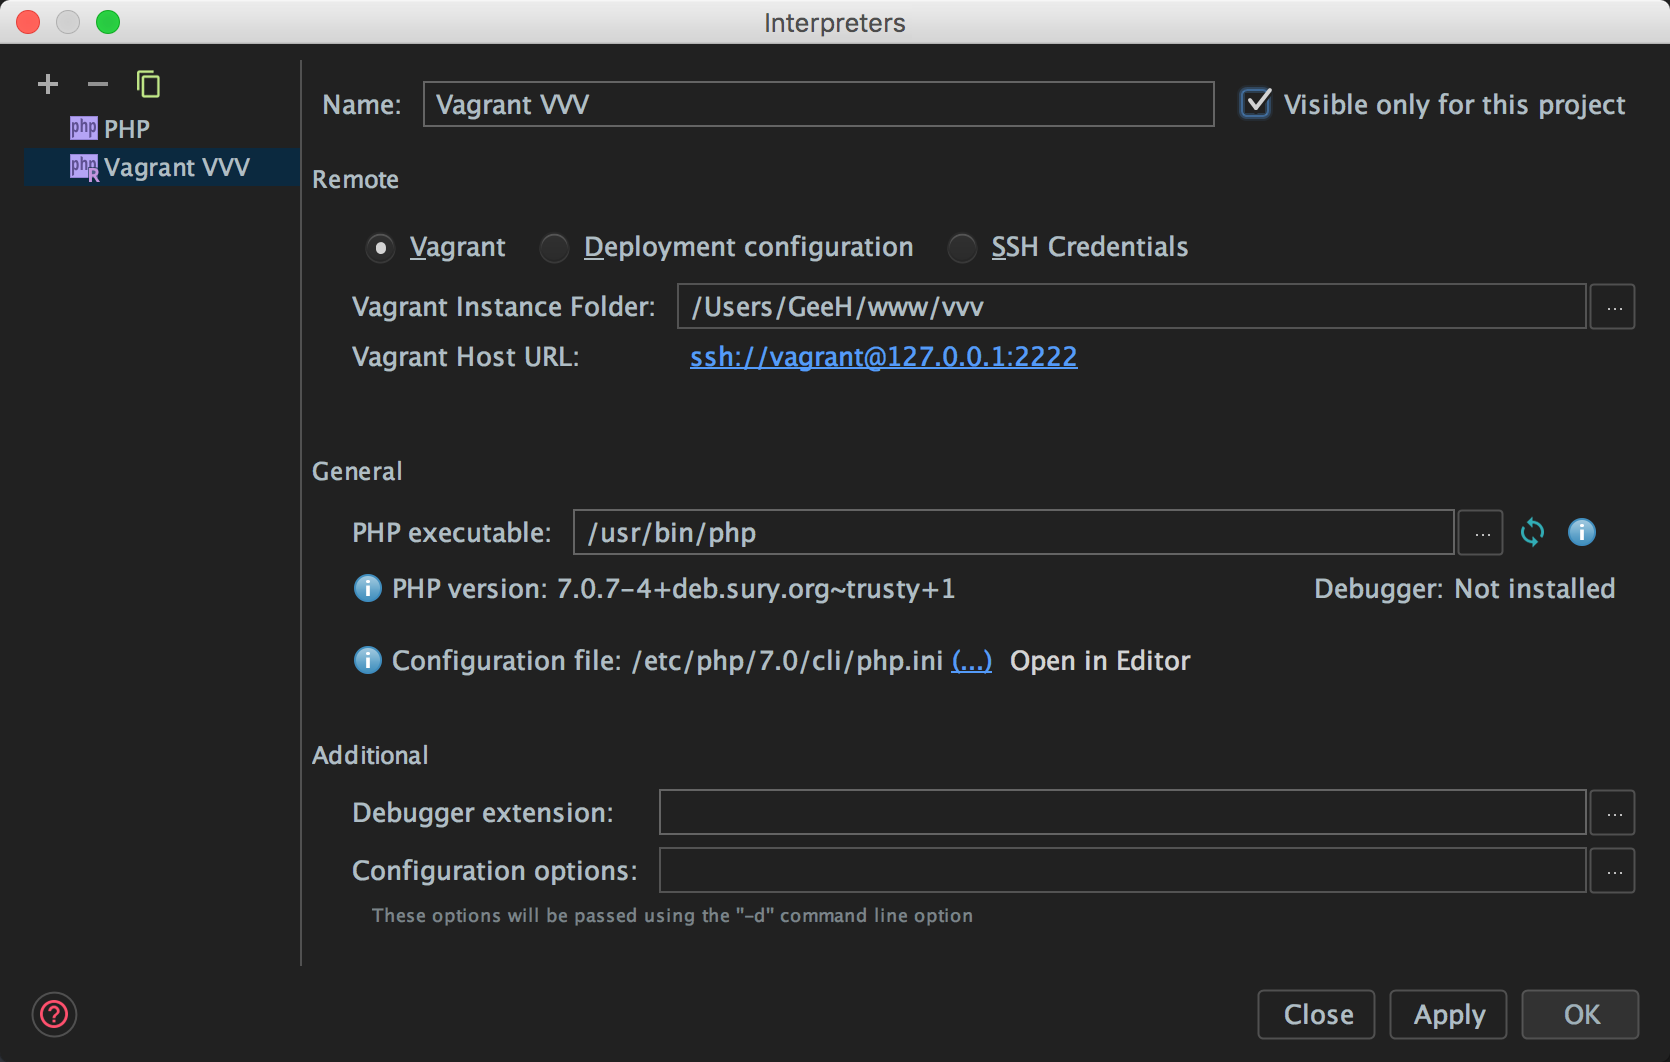
There are a few things to note here. First, I ticked the Visible only for this project box, as I don’t want to see this interpreter in other PhpStorm projects. I also noticed that the PHP executable has been detected correctly (yay! PHP 7!), but that there is no debugger installed. I’m not too worried at this point, I have no idea how this machine is configured, and it may have Xdebug only set for HTTP requests, and not for CLI.
With things looking right here, the next thing I want to do is to check if Xdebug is installed, and if so, how it’s configured. Recent versions of PhpStorm ship with the Web Server Debug Validation tool (found under the Run menu). Before we can run that, we need to create a deployment server so that PhpStorm knows the locations of local files, and how to map those to files on the server, I selected the Remote Web Server option, and then clicked the […] button to open the Deployment Server dialog.
We also need to create a deployment using SFTP. This may be a little confusing because we’ve already told PhpStorm we’re using Vagrant, and it should be able to infer this from there. We only need to create a deployment configuration for the debug validation tool so that the tool knows where to create a file and be able to call it via an HTTP request. This may seem painful, but we only need to do this to be able to run the validation tool:
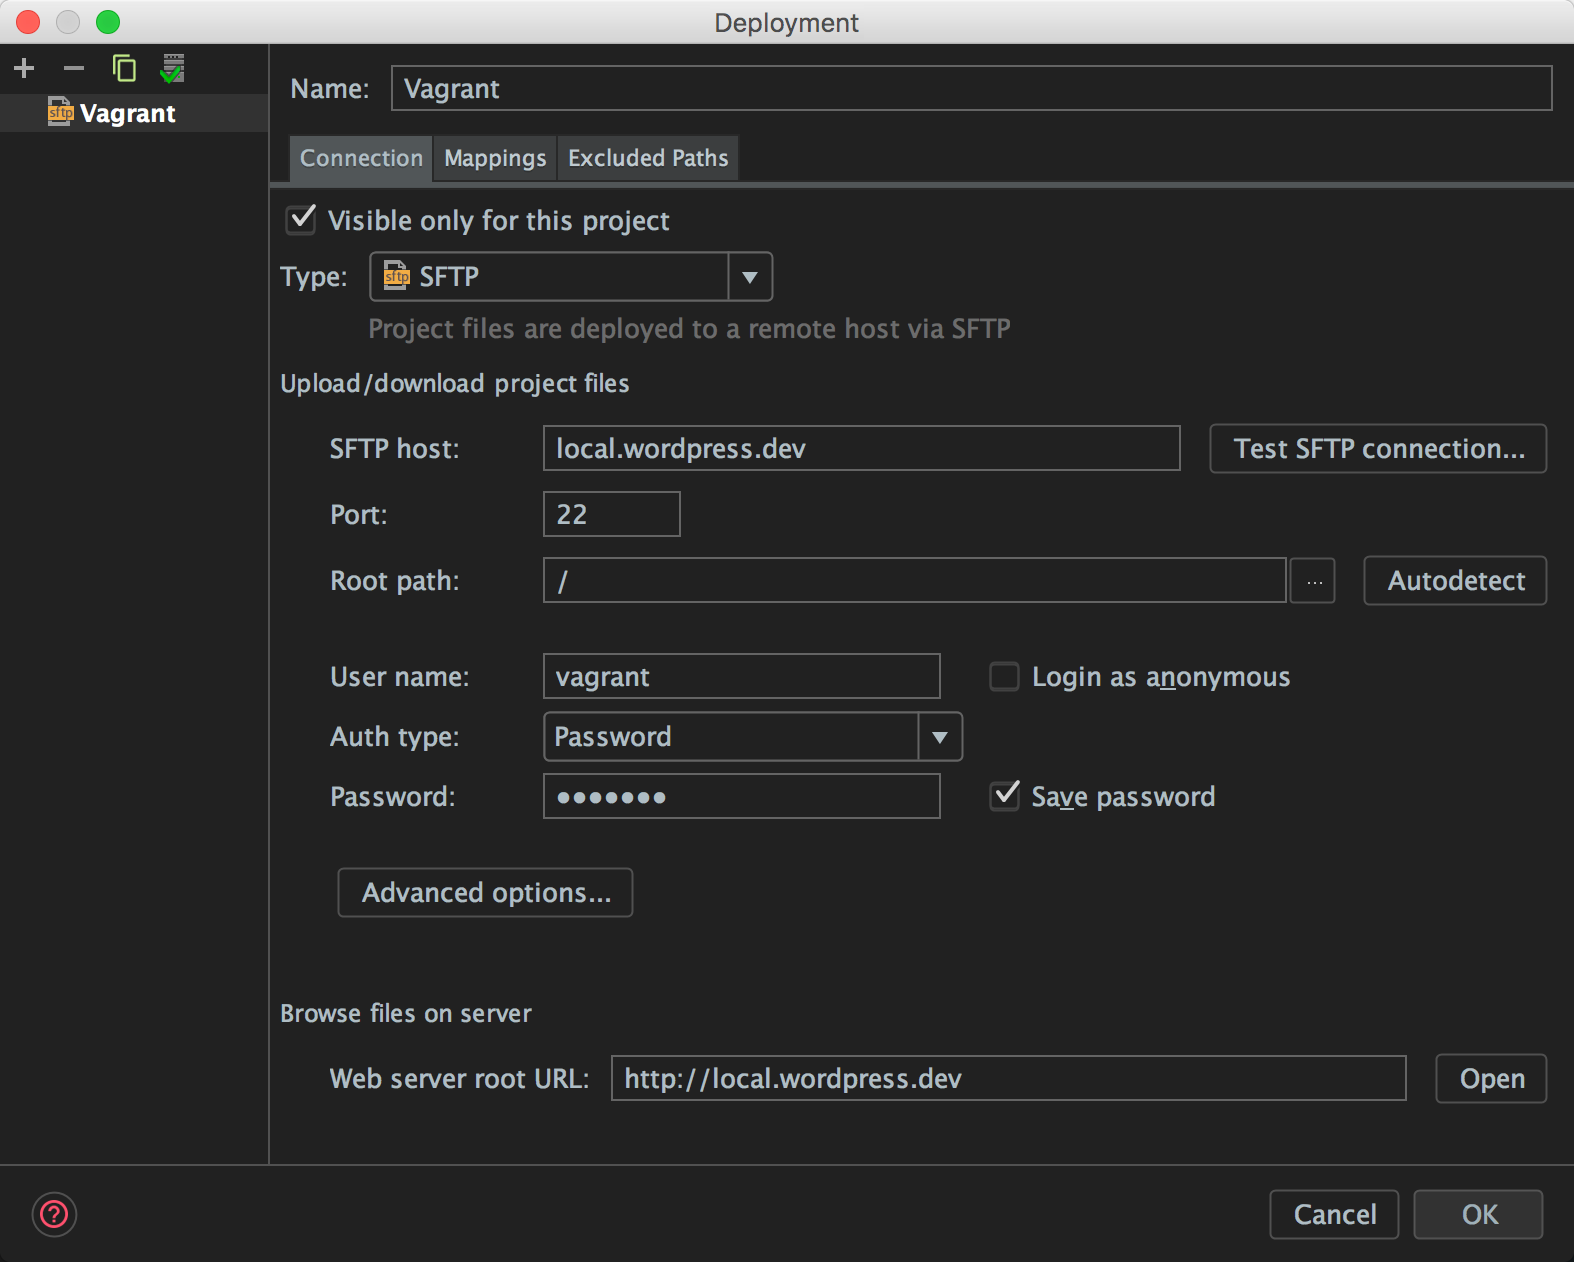
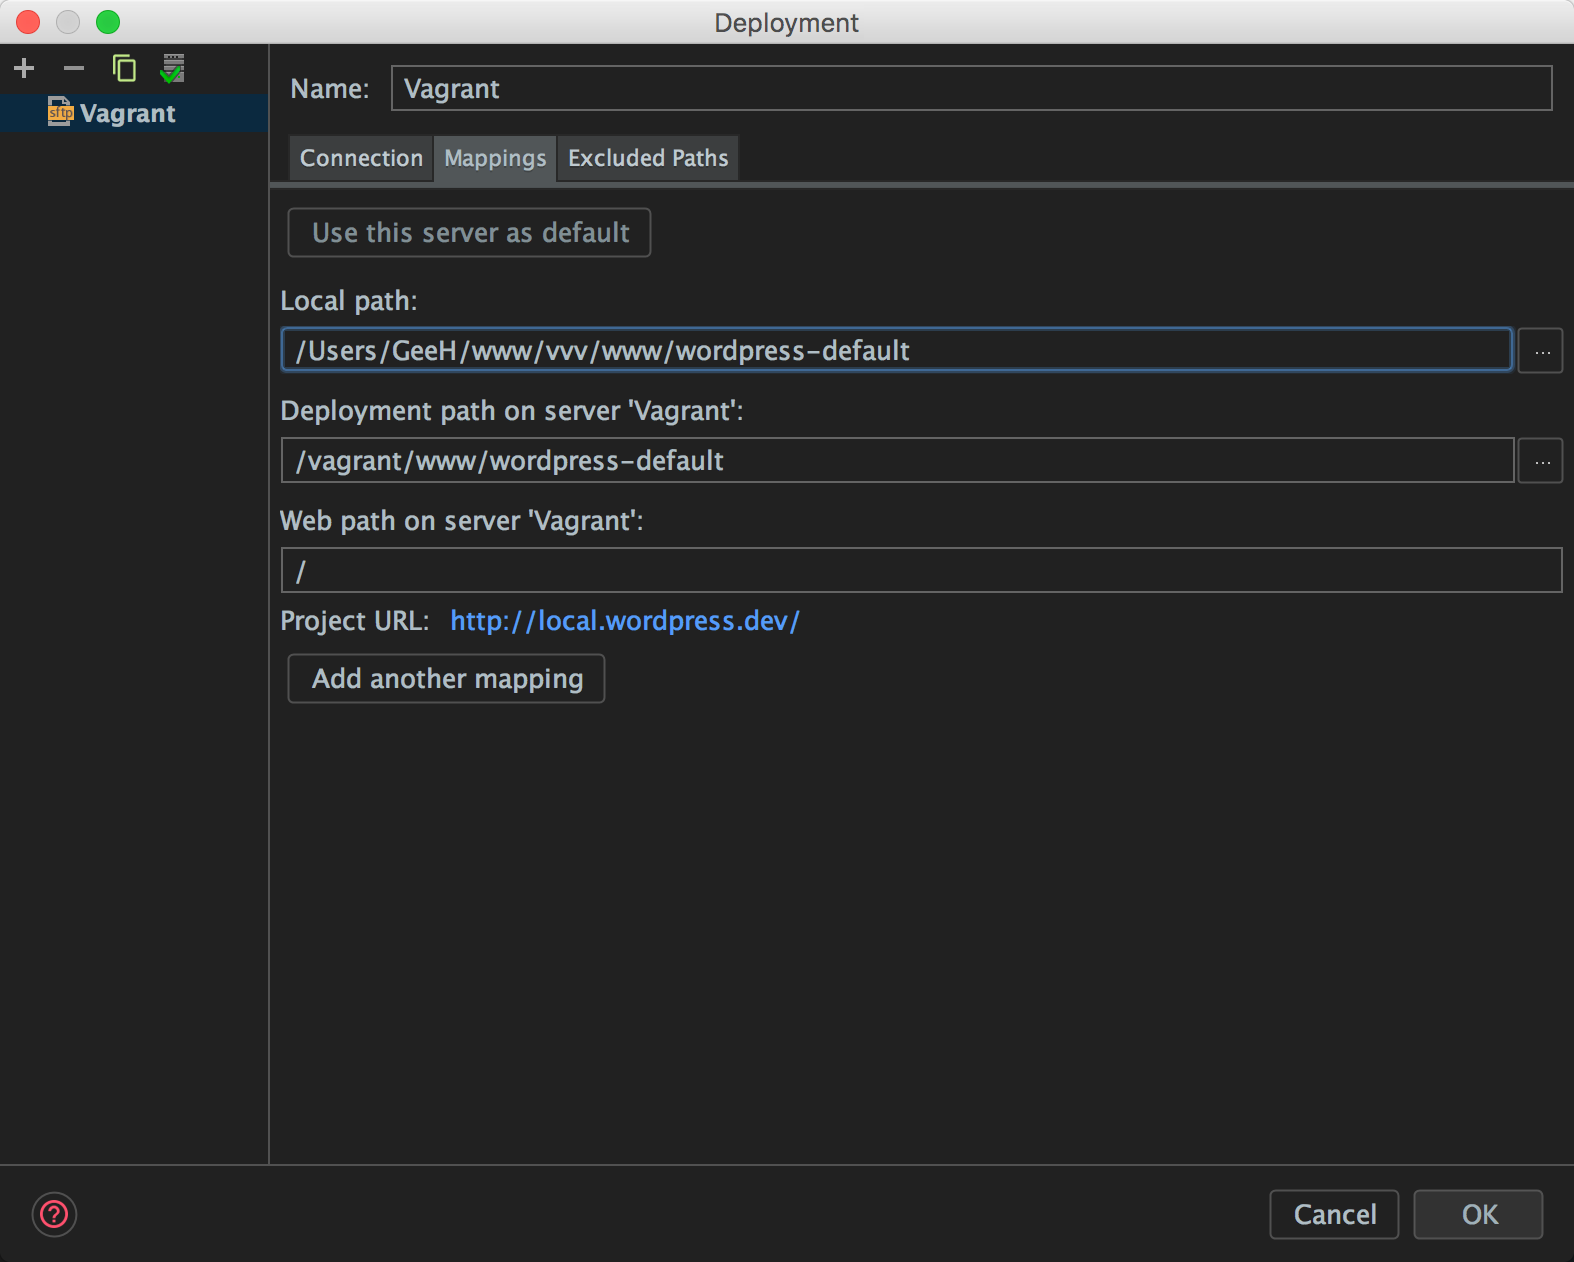
Notice how I had to use the URL I’m using to access the site as the SFTP Host rather than the IP address, and I’ve added a simple mapping from the project root on the host machine to the project root in the virtual machine. After we run the debugger configuration validation tool, we see this:
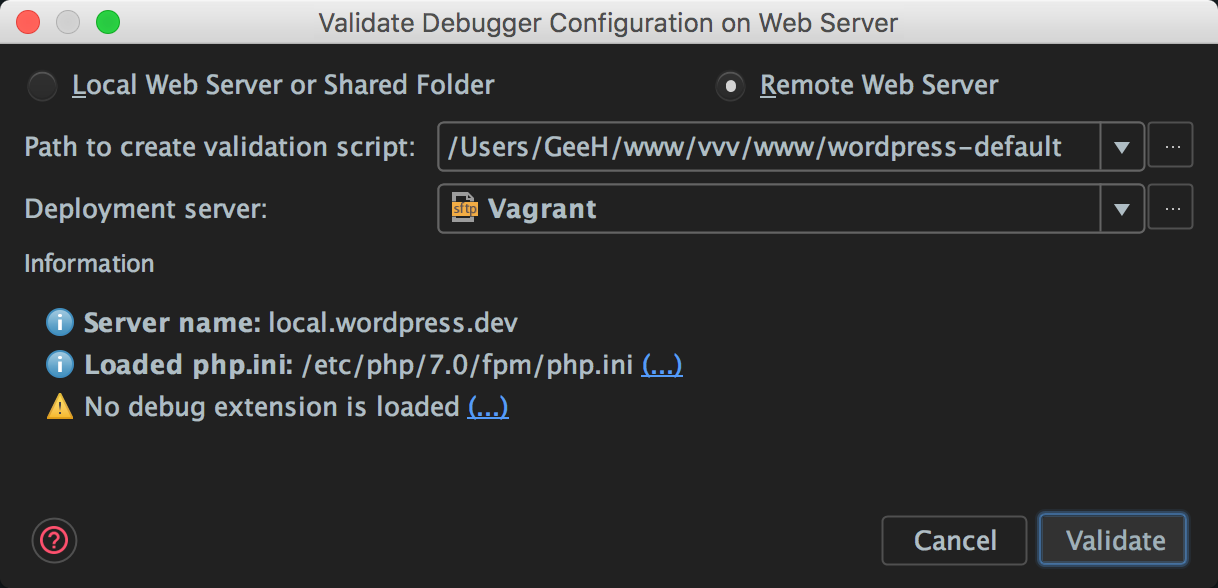
My earlier fears when creating the interpreter are correct – PHP on the virtual machine doesn’t have Xdebug installed and configured. After some investigation with the VVV documentation, I found this is an easy fix; we can simply `vagrant ssh` into the Vagrant box, and run `xdebug_on` to install and configure Xdebug.
I took a look at the settings that this script configured Xdebug with, and they looked good to me with the exception that I prefer to use the `xdebug.remote_connect_back` setting to send debug sessions back to the IP address that made the request, rather than to specify the IP address manually. I left the settings as VVV configured them.
Heading back to PhpStorm, we can run the debug configuration validation tool again, and this time, we see everything looking promising:
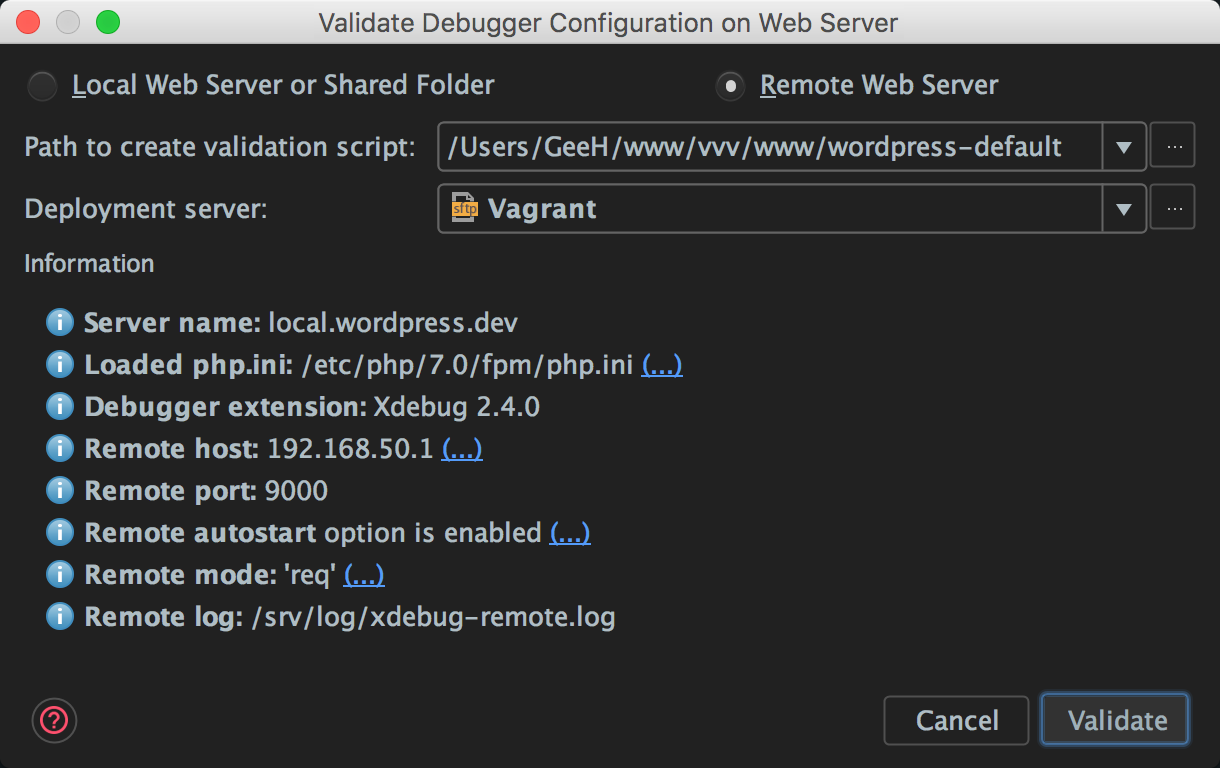
Now we see that everything is blue, and I have confidence that the debug session will work as expected.
To test the debugger, I opened `index.php` and set a breakpoint on line 17 just before the actual WordPress main file is required. At this point, I’m not interested in actually debugging anything, I only want to check that the script stops, and PhpStorm is opened with step debugging available. After listening for connections, I head over to Chrome and enable debugging via the Chrome extension I use, then hit refresh…
Nothing happens, the script hangs, but looking at PhpStorm I can see that a debugger session has started, but PhpStorm appears to be just sitting there without actually debugging. This is a common problem when PhpStorm can’t figure out how to map the files on the server to the files in your local project — we have a path problem. Clicking on the Debugger tab in the Debug pane that has opened, there’s a message that confirmed the problem is as suspected:
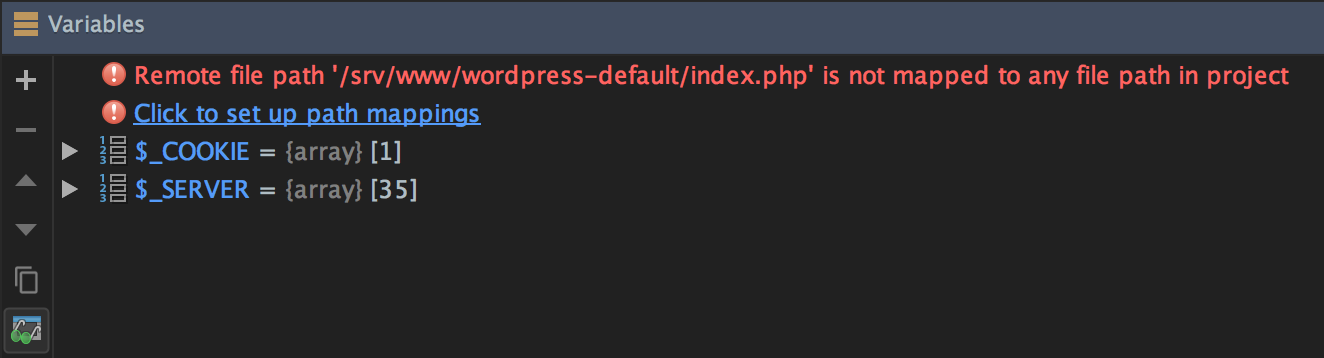
Even though we’ve already told PhpStorm previously how to map files from our local machine to the Vagrant host, there is a problem here (and it’s actually one that took me a while to spot). We mapped the local path to the shared folder path on the Vagrant box, which is `/vagrant`, but the actual files are being served from `/srv/www`. This is probably because of symlinks, or other such trickery; I looked but couldn’t figure it out in my 2-minute cursory glance.
If you look carefully at the error, you’ll see the mapping you need to create to make all things golden. We need to tell PhpStorm where to find `/srv/www/wordpress-default` in the local project, and we can do that by clicking on Click to setup path mappings. In the box next to the local path to `wordpress-default`, add the location on the server as `/srv/www/wordpress-default`, and press Enter.
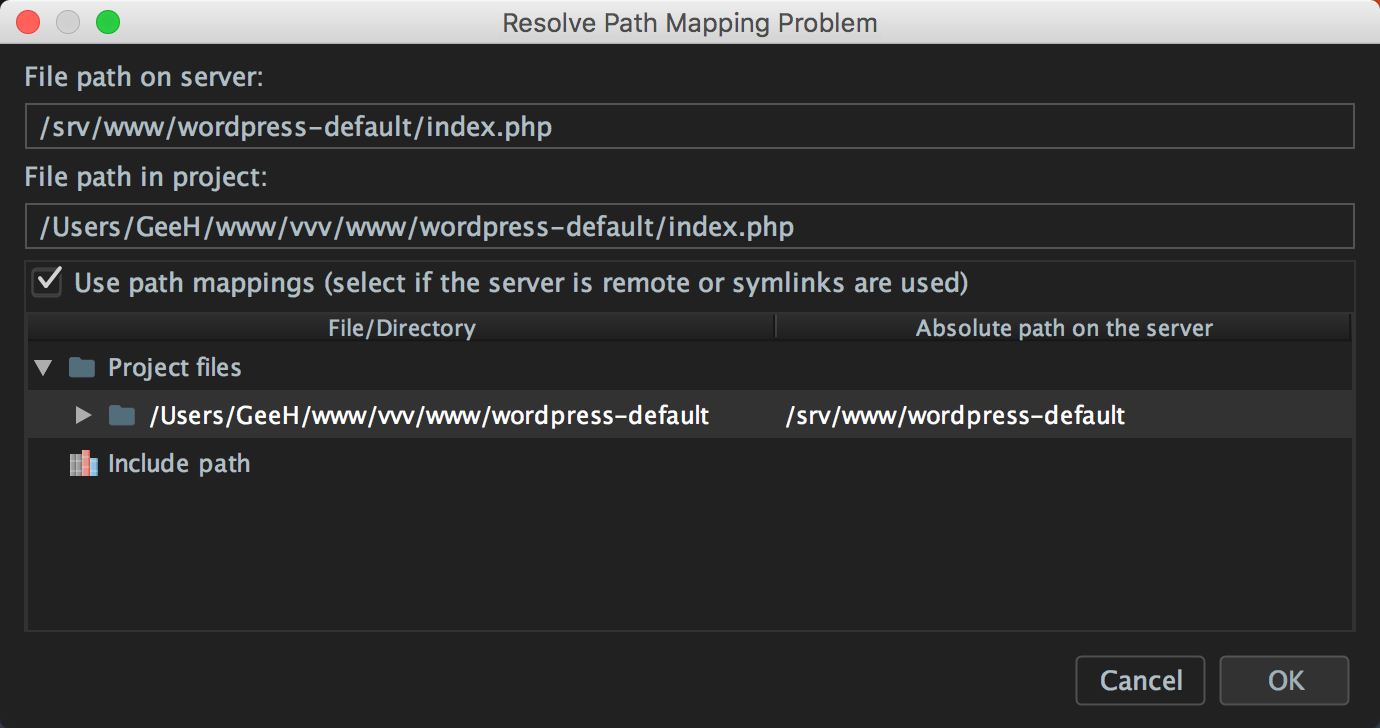
The OK button should become enabled. Again, it’s worth pointing out that we only need to create this additional mapping because there is a discrepancy between the shared folder that we’ve already mapped at `/vagrant` and the location of the webroot at `/srv/www`. In most other configurations we wouldn’t need to do this.
When we hit OK, everything works as expected and we can start debugging WordPress as needed. It took me around 35 minutes to get debugging working, mainly because as a developer and a human being I didn’t read the error in the debug pane that explained the problem. I just glossed over it and assumed it was a mapping problem with the `/vagrant` folder and not the `/var/www` folder. Once I actually read the message, it took 20 seconds to actually get debugging working.
This is a long post intentionally. I wanted to explain my process for actually solving debugging problems step by step rather than just give the actual answer to this problem. Hopefully, that helps other people to solve their debugging issues, particularly when you’re working with a 3rd-party virtual machine or container that you have no experience with.
Let me know if this helps you.
— Gary and the PhpStorm Team