Xdebug On Demand for CLI PHP Scripts in PhpStorm 2016.2

You may have noticed recent versions of the Composer dependency manager has come with a warning if you have Xdebug enabled:
![]()
Jordi added this warning because Xdebug does wondrous things when you are developing, but it slows down execution of PHP scripts massively. Turning Xdebug on and off depending on the situation can be a painful chore… Until now.
PhpStorm 2016.2 introduces Xdebug On Demand mode where you can disable Xdebug for your global PHP install, and PhpStorm will only enable it when it needs to — when you’re debugging your scripts, or when you need code coverage reports.
To use the great new feature, first, you need to disable Xdebug for command line PHP scripts. Usually, this is a case of either renaming a config file, or commenting out the lines that load the extension. While you’re working with the configuration that enables Xdebug in your actual PHP install, it’s worth taking a note of where the Xdebug extension lives on your system as you’ll need that later.
What you are looking for is when you run `php -v` from the command line, you don’t get the “with Xdebug by Derick Rethans” line:
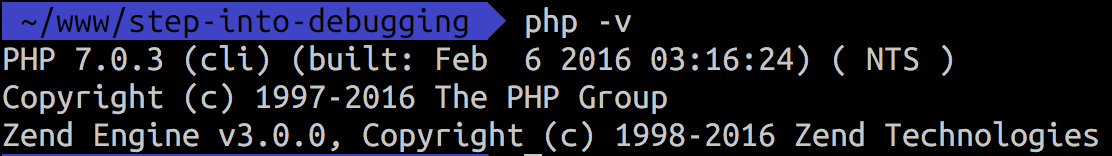
Now we don’t have Xdebug installed, and our command line scripts (including Composer and our unit tests) will run much faster.
Next, we need to tell PhpStorm where to find Xdebug when we need it. To do this, navigate to Languages and Frameworks and then PHP in the preference pane. You’ll see a list of your configured interpreters in a drop down, pick the relevant PHP install and then press the … button to see it’s settings:
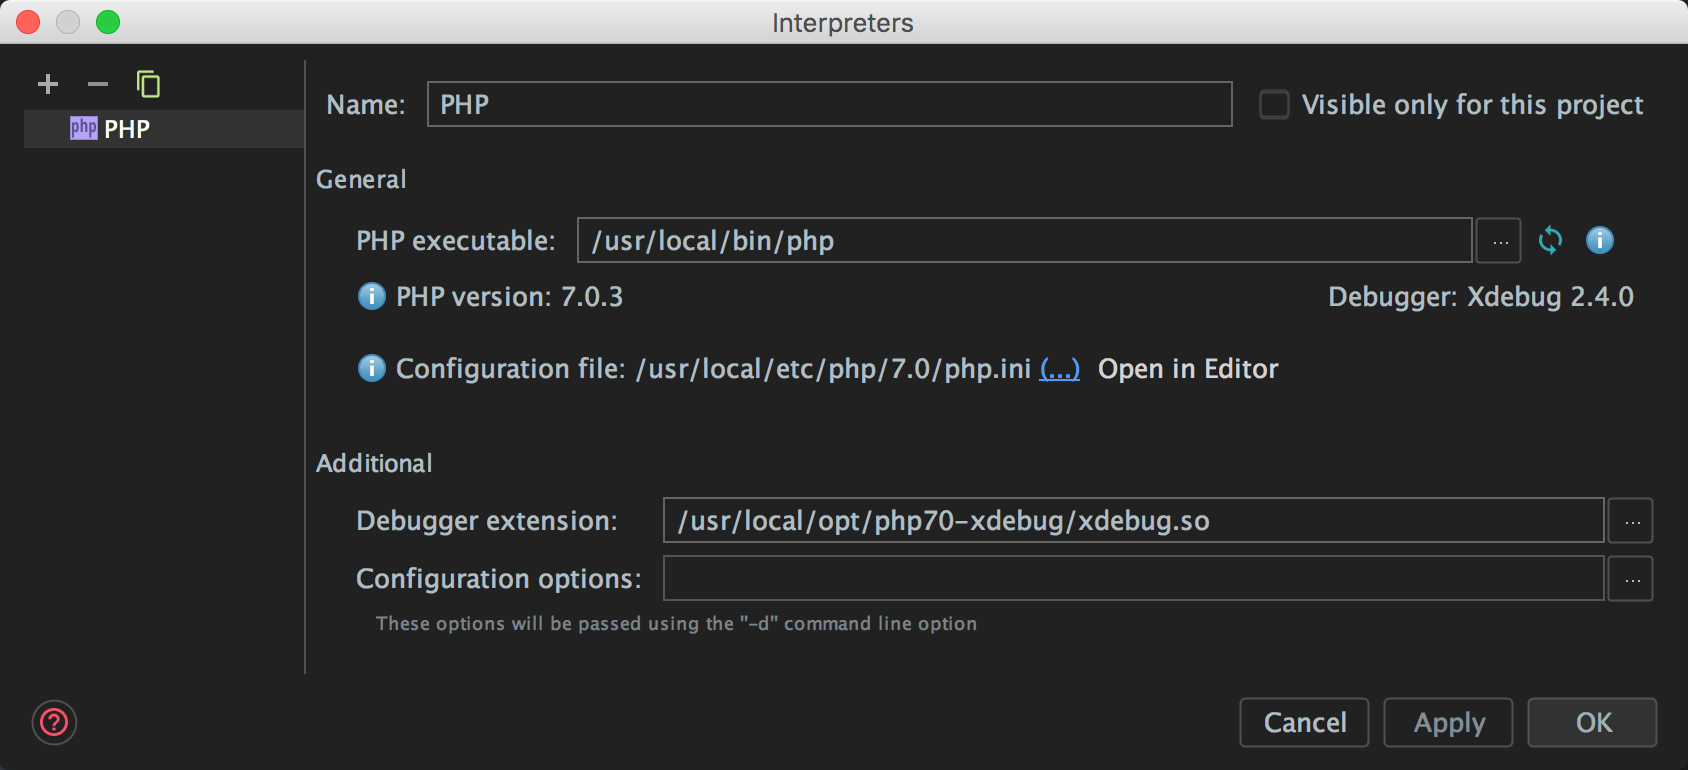
We just need to tell PhpStorm where to find the Xdebug extension in the Debugger extension field – that’s the location you should have taken note of earlier when you were looking at the config files. When you opened this screen, the Debugger information to the right of the PHP version said Not installed, but once you’ve set the debugger location, hitting the refresh icon above it will confirm that the extension is found and can be loaded; it will change to the version of Xdebug you are running.
Now we can debug as usual. If it’s a simple PHP script, then either use the Debug toolbar icon to start a debugging session (as usual), or if you don’t have a run configuration, right-click anywhere in the file, and select Debug and then the file name with the PHP file icon next to it. This will allow you to start a debug session right there without even running the debug session listener.
If you want to debug your PHP Unit tests, assuming you have a PHP Unit runner configured and you can debug your unit tests in the same way; by selecting the PHP Unit configuration from the drop-down in the menu bar, and then hitting the Debug button.
Making debugging easier and quicker is a definite goal in recent releases of PhpStorm, and personally, I think this solves a very annoying problem and speeds up execution of tests and other command-line scripts in the 90% use case; when you don’t need to debug or profile.
I hope you are excited as I am with this feature, give it a go and let me know what you think!
— Gary and the PhpStorm Team