Twig and Blade templates debugging

In PhpStorm 2019.1, we’ve implemented debugging of Twig and Blade templates.
The problem was that template files are not the files your application runs. They are first compiled into regular PHP and saved to a cache directory, and then the application runs those compiled files.
So before PhpStorm 2019.1, your only option was to identify the compiled file, something like b84f5d6c0f0d85bb9187843.php, locate the line you want to place a breakpoint on, and then debug this file instead.
Luckily, things have changed, and you can now debug your template files directly – there’s no difference between them and regular PHP files in this regard.
To start debugging your templates:
- Set up your PHP debugger.
- In PhpStorm, go to Settings/Preferences | Languages & Frameworks | PHP | Debug | Templates and specify the directories where your compiled files are stored:
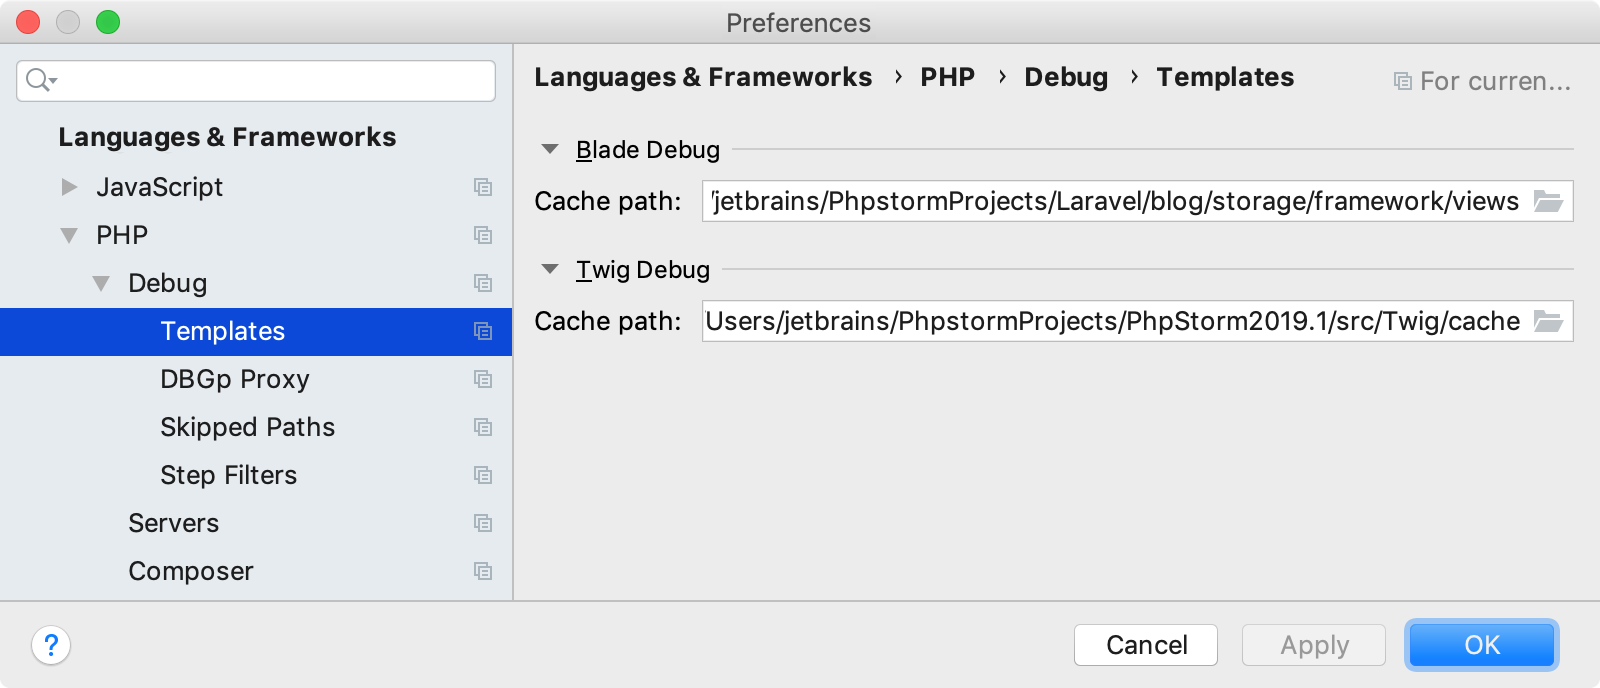
In the case of Twig, you also need to set the following configuration options:
debug: true
auto_reload: true
In the case of Laravel, just make sure you’re using version 5.8 or later, and you’re good to go.
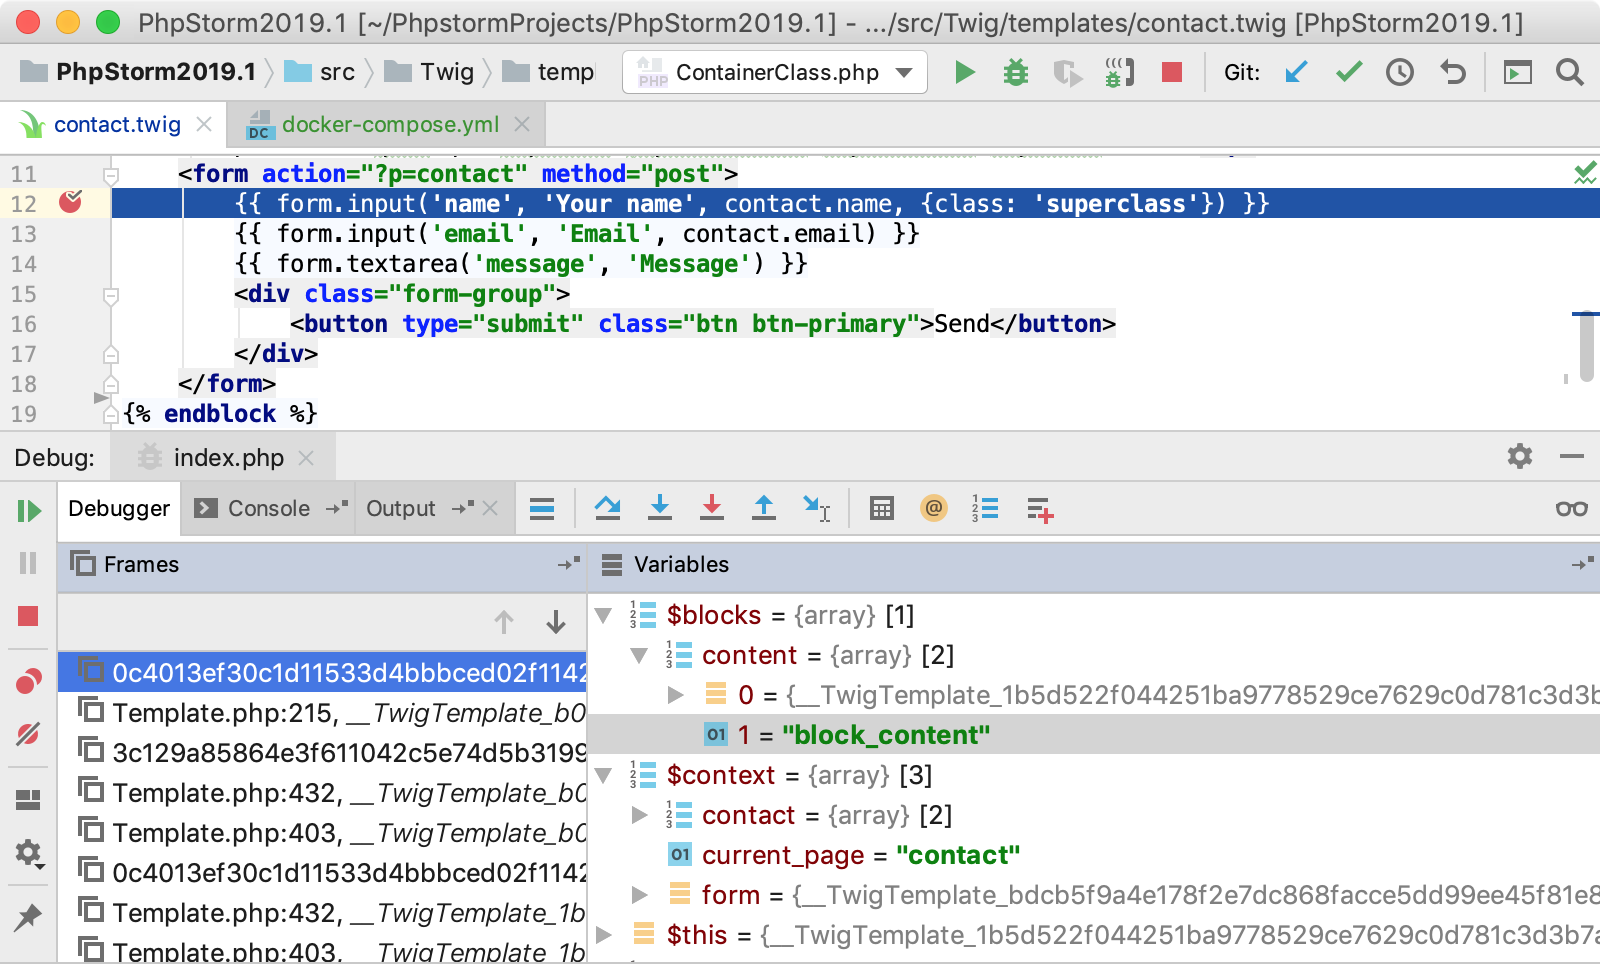
Now, set a breakpoint directly in your template file, just like you would with a PHP file, and begin step debugging!
New to debugging in PhpStorm? Check out the Ultimate Debugging Guide or this Quickstart video on getting started with debugging in Docker.
Your JetBrains PhpStorm Team
The Drive to Develop