PhpStorm 2022.3 Early Access #5

In this build, you can try the brand new rendered view for PHPDoc comments, return value debugging with Xdebug, and tools that will help you troubleshoot Xdebug configuration.
The EAP allows you to try new features from the upcoming PhpStorm 2022.3. EAP builds are free to use, and you can install them side by side with a stable version of PhpStorm. This way, if something doesn’t work correctly, you can quickly switch back to the previous version without disrupting your workflow.
Xdebug setup validation
Having a debugger on hand during development can save you hours, but setting it up can sometimes be tricky. We are working to provide as much assistance as possible to save you time when configuring Xdebug in PhpStorm.
If you’re just starting the setup process, we encourage you to first check out the documentation on how to configure Xdebug.
If you’re having trouble getting Xdebug set up after the above instructions, here are a few things you can do in PhpStorm 2022.3 to identify the problem.
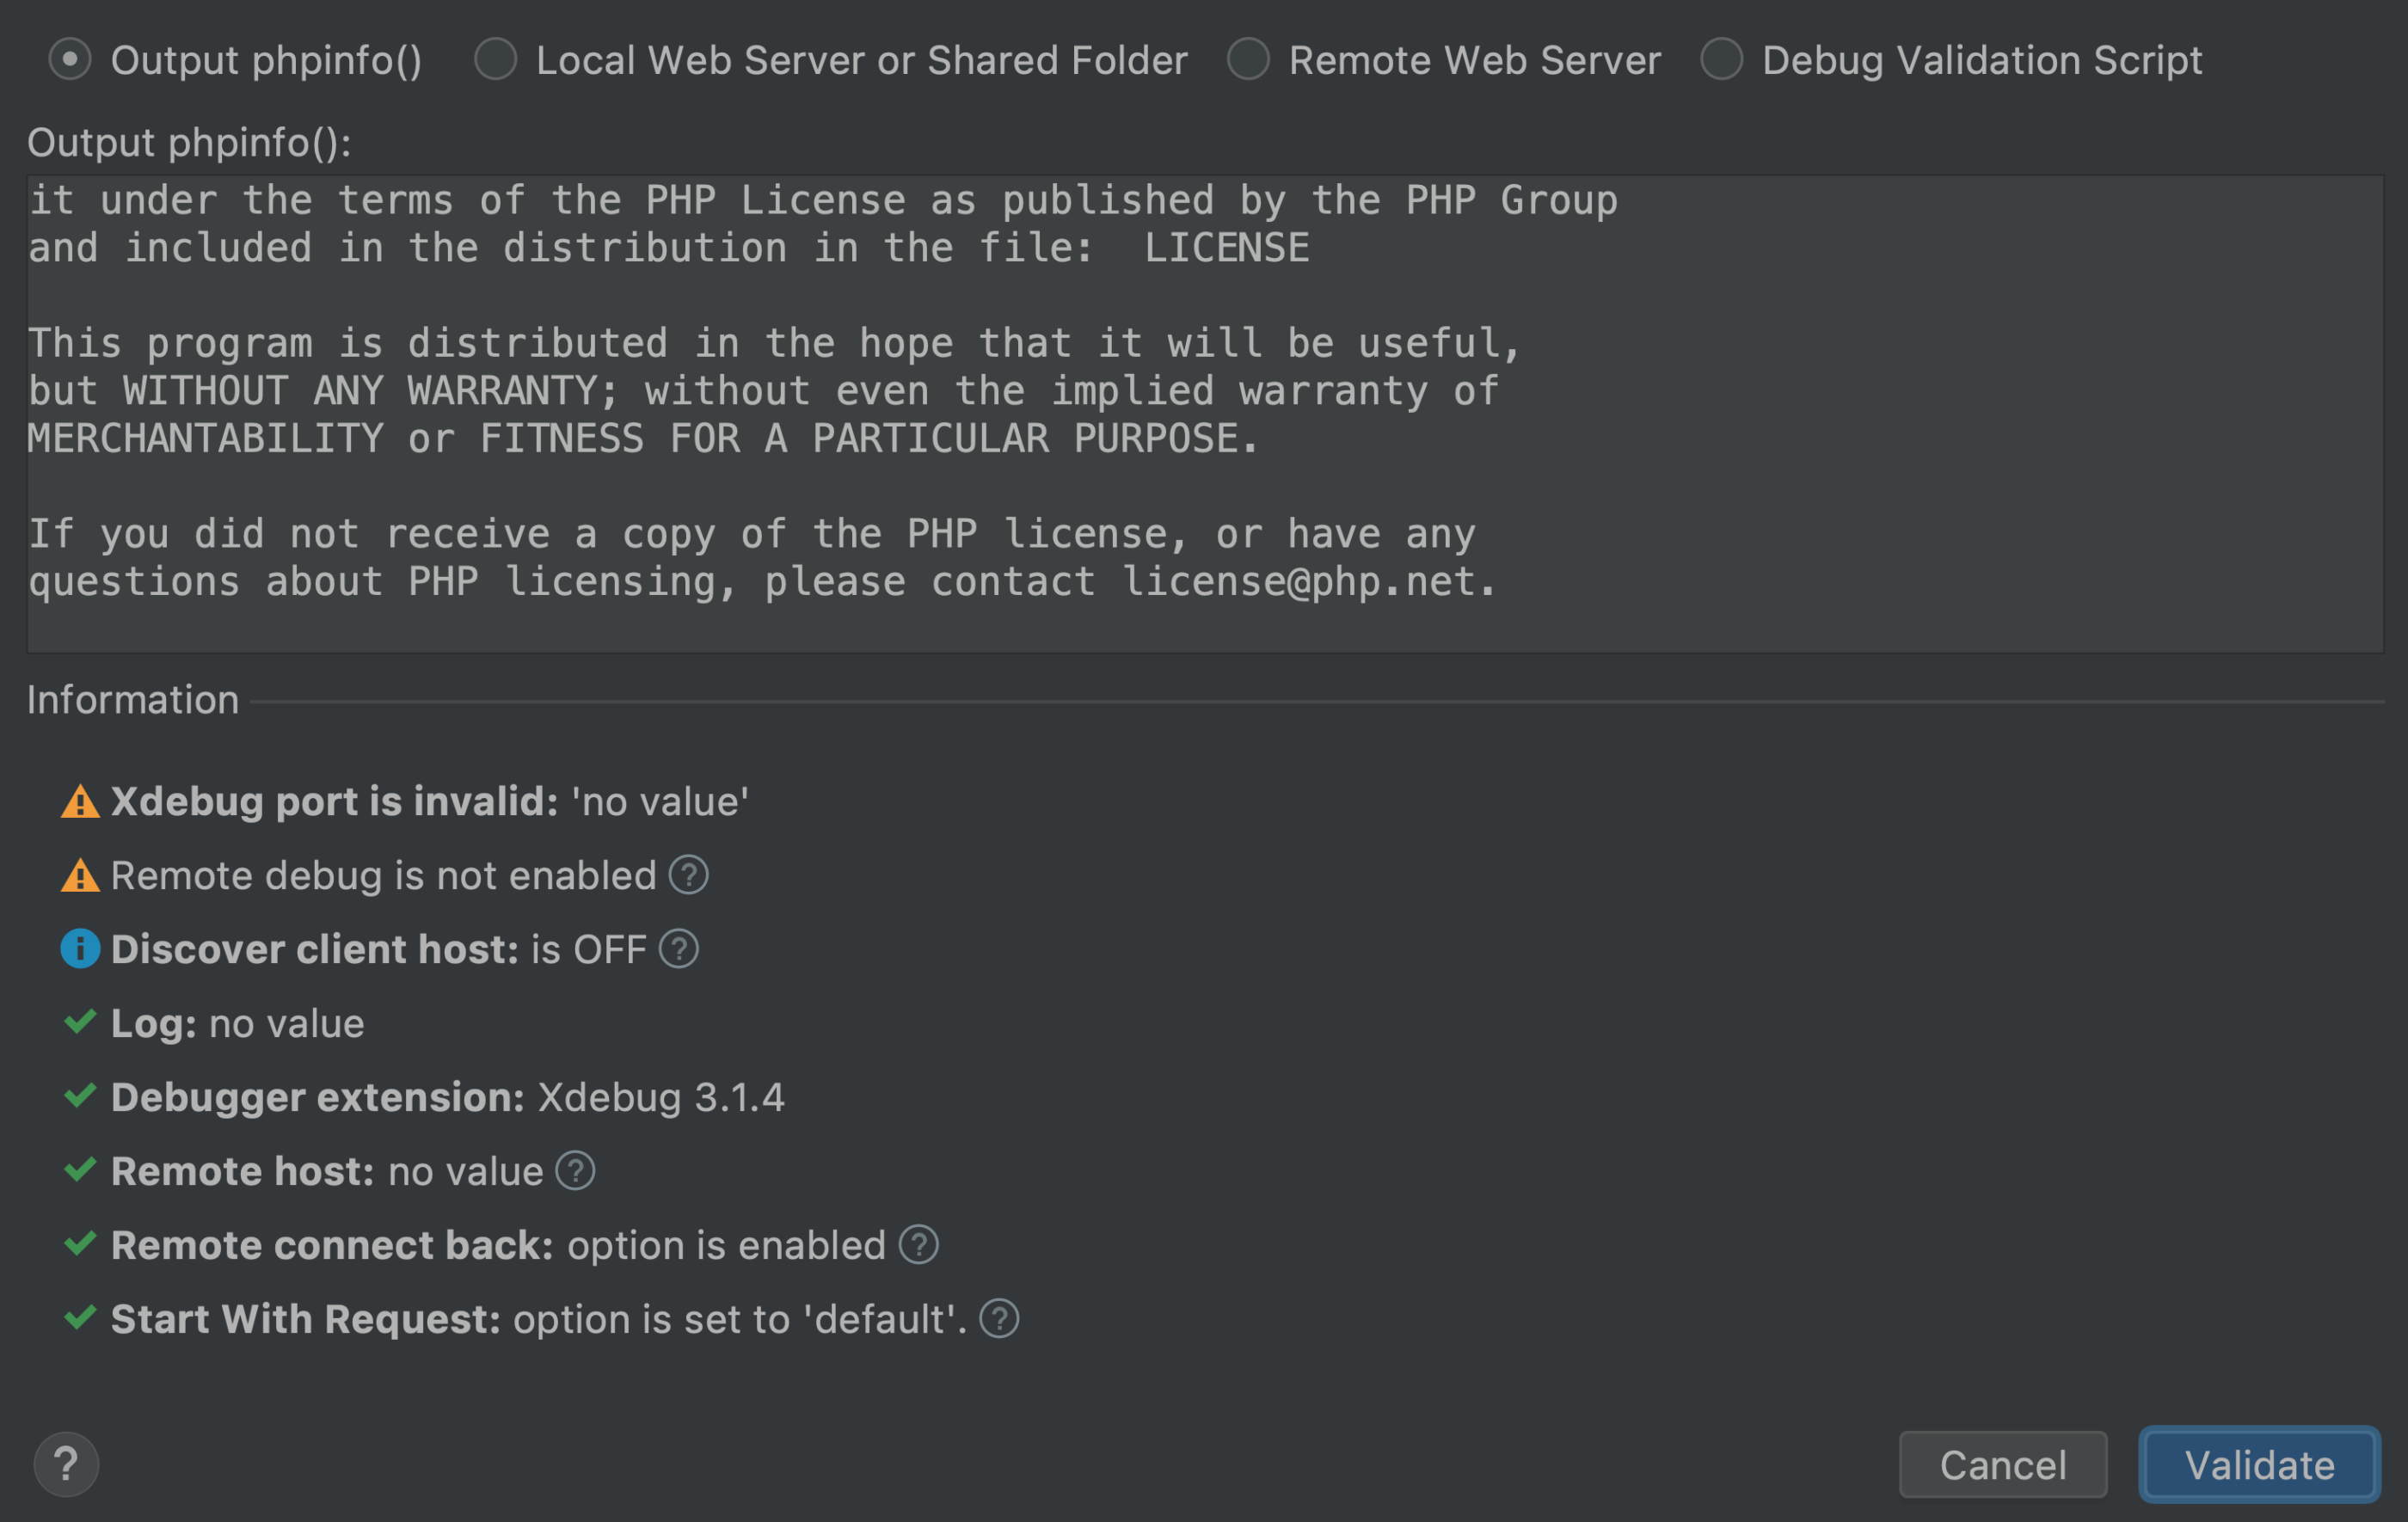
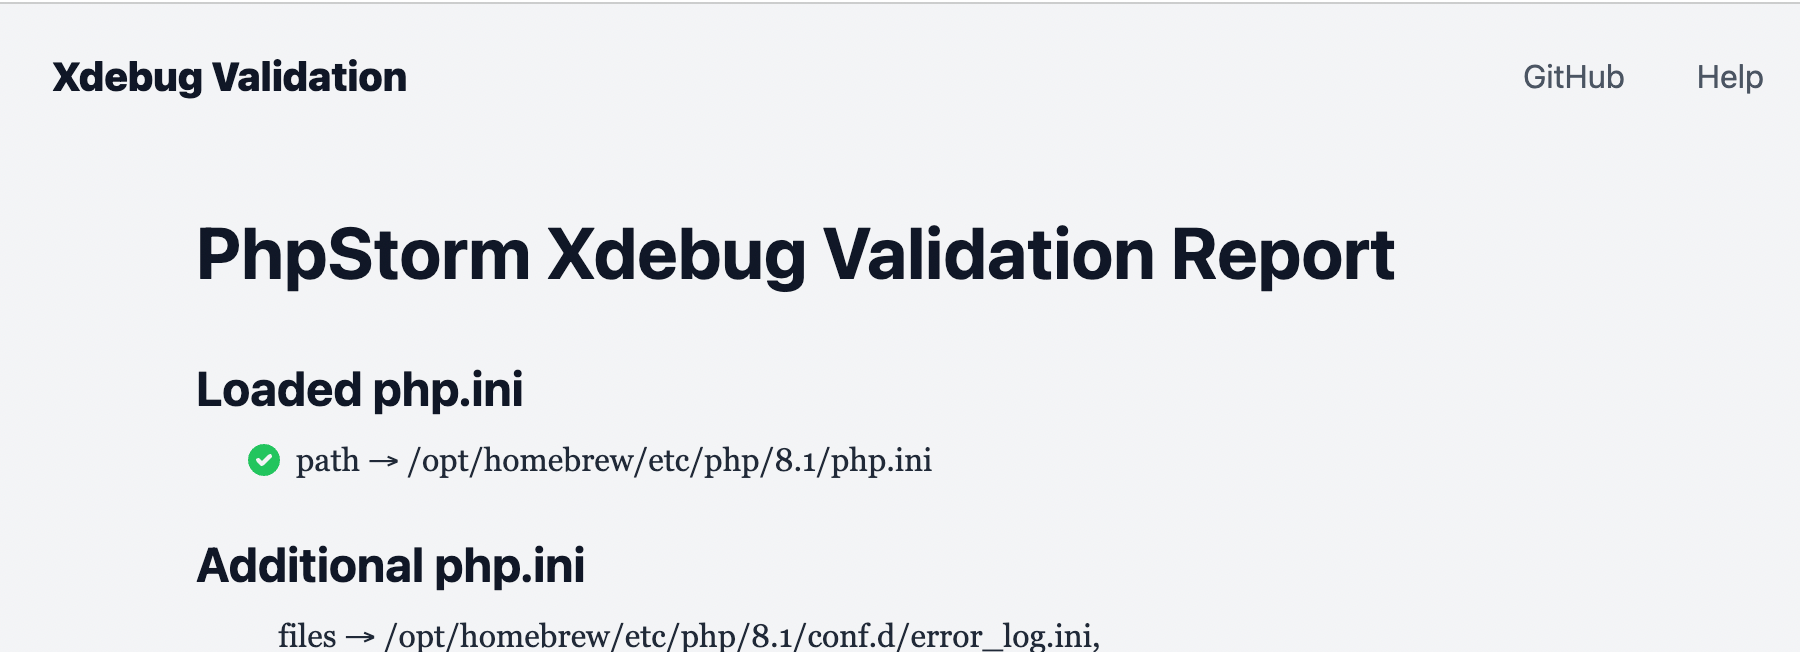
Validate phpinfo() output
First, try adding a phpinfo() call to your PHP script or page, and copying the output of the function that you see in your browser. Then call Run / Web Server Debug Validation, and you’ll see a dialog that allows you to paste the phpinfo() output.
If you are debugging a command line script, then you may want to copy the output from the php -i command.
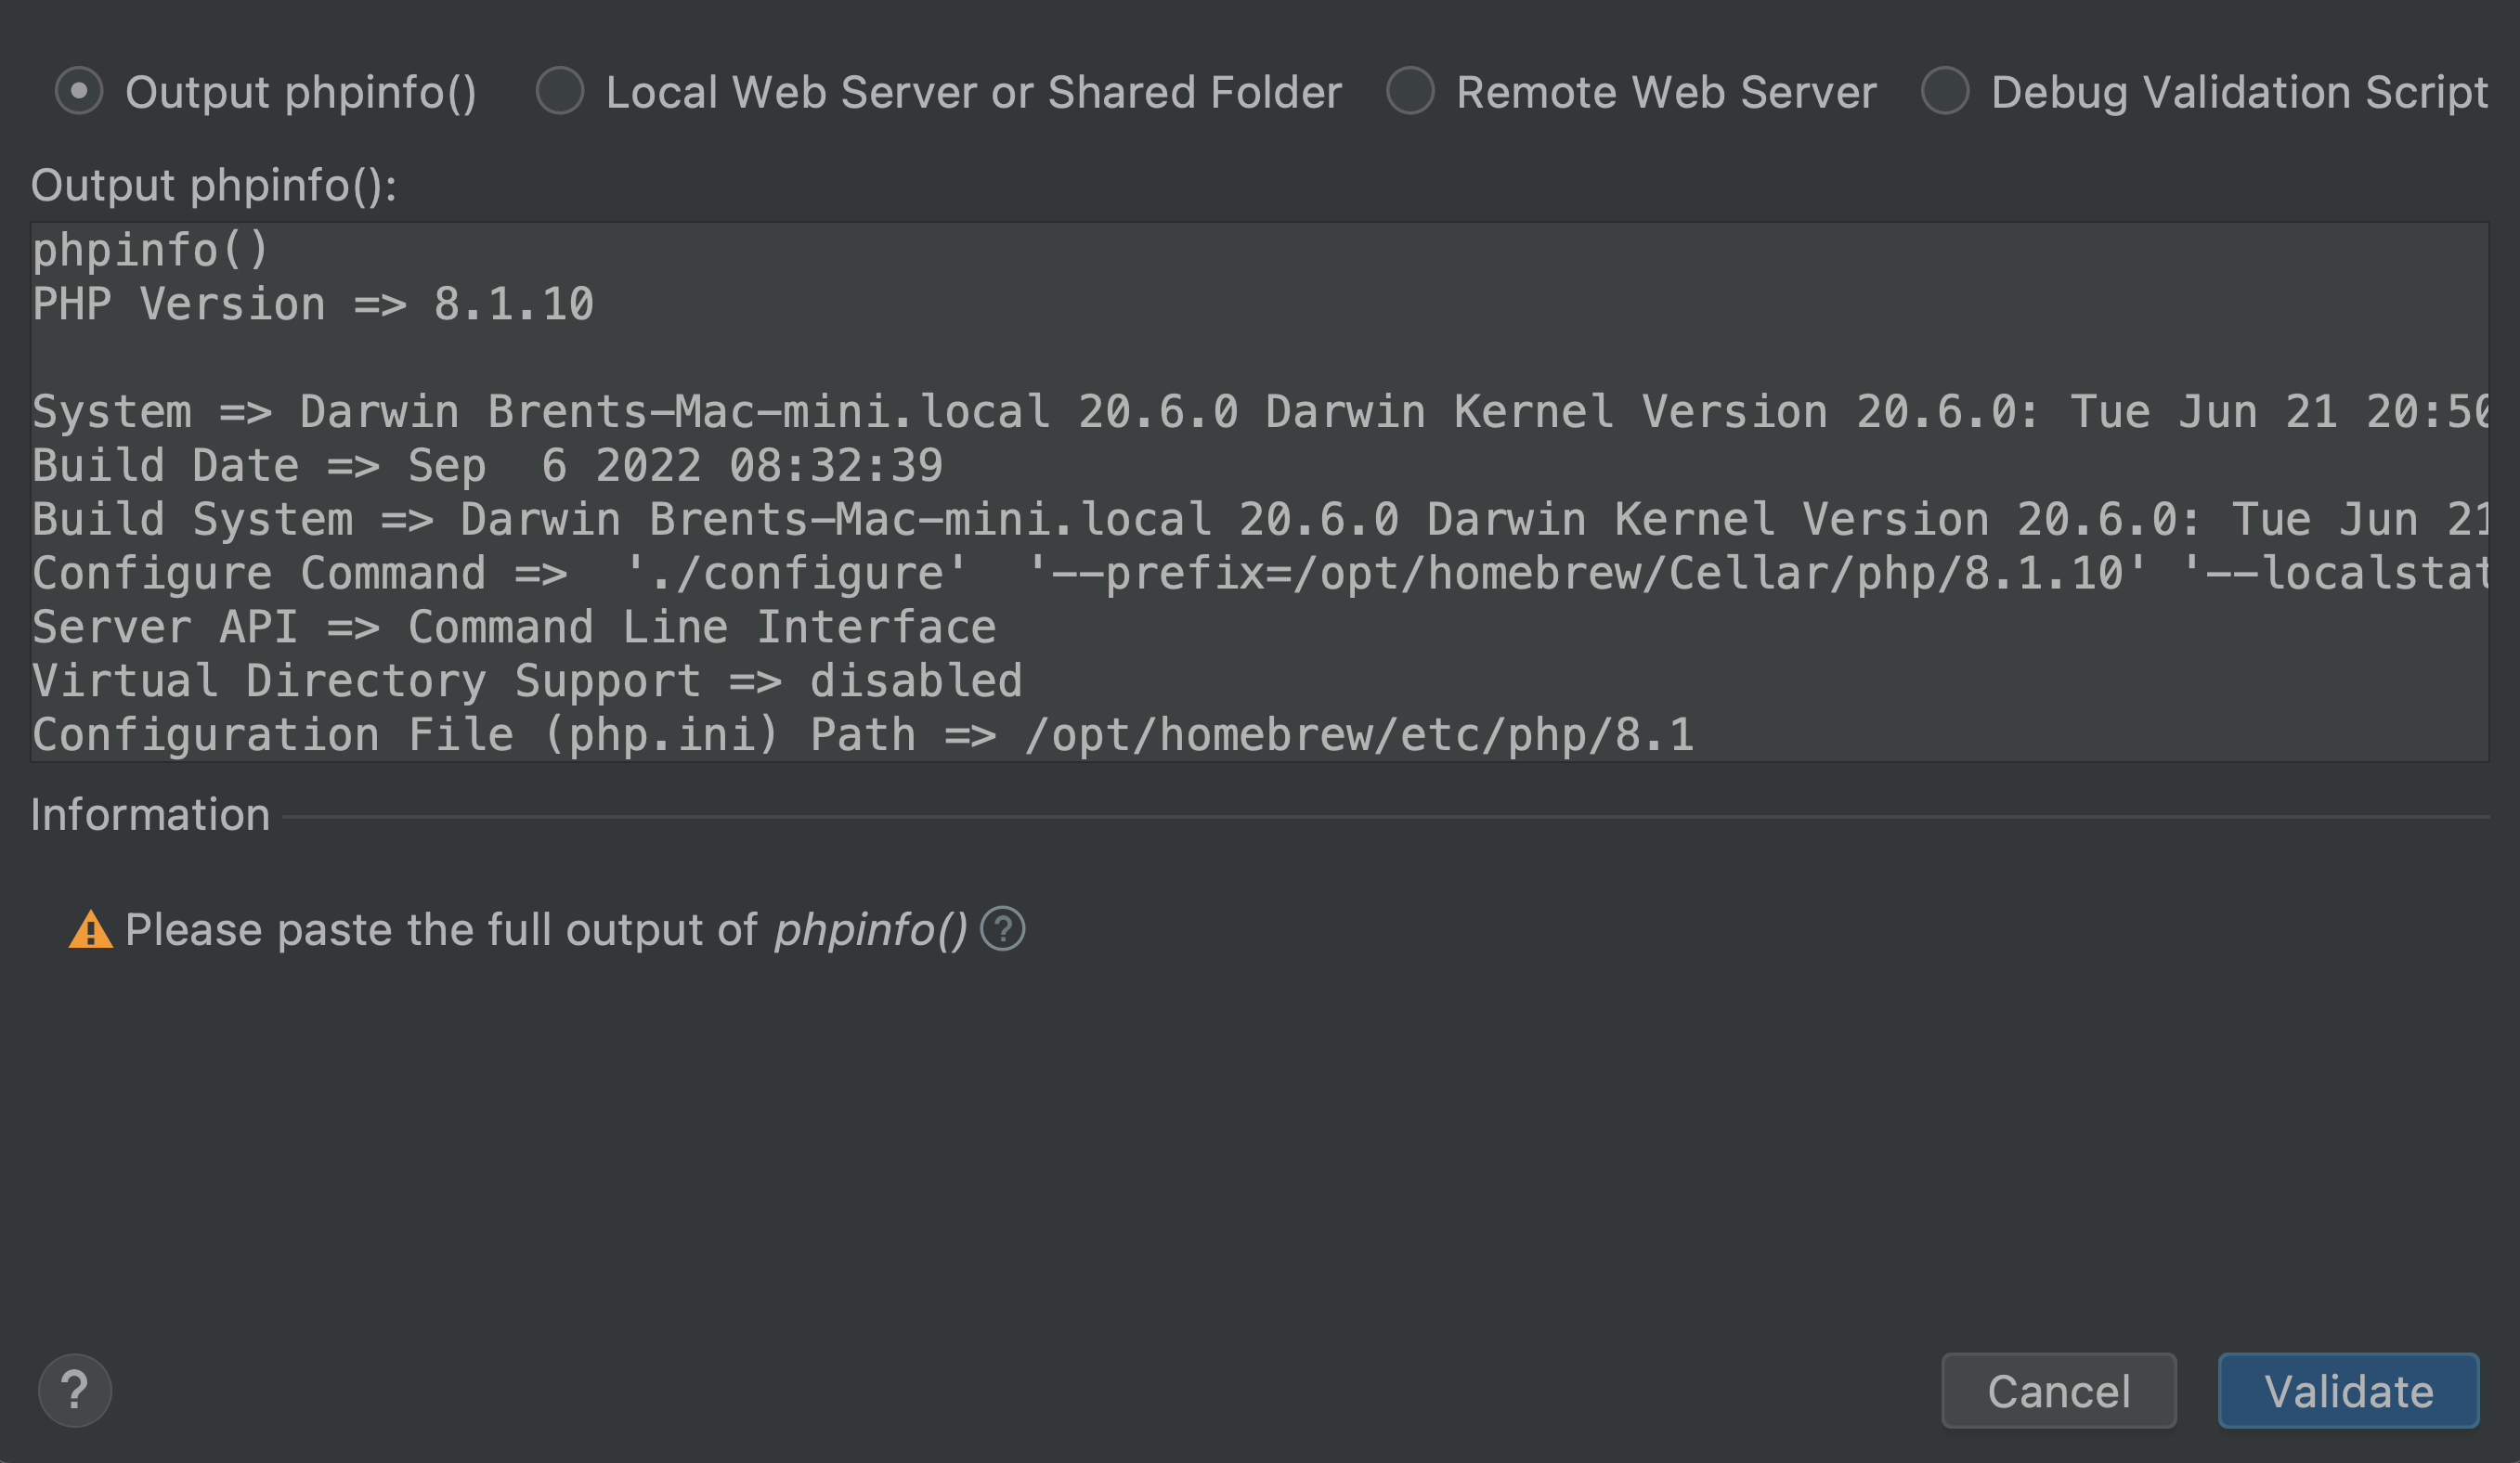
PhpStorm will analyze the server configuration and notify you if it detects any problems.
For instance, xdebug.remote_host could be unreachable:
Or a port could be busy, in which case PhpStorm will suggest fixing the Xdebug port configuration with one click:
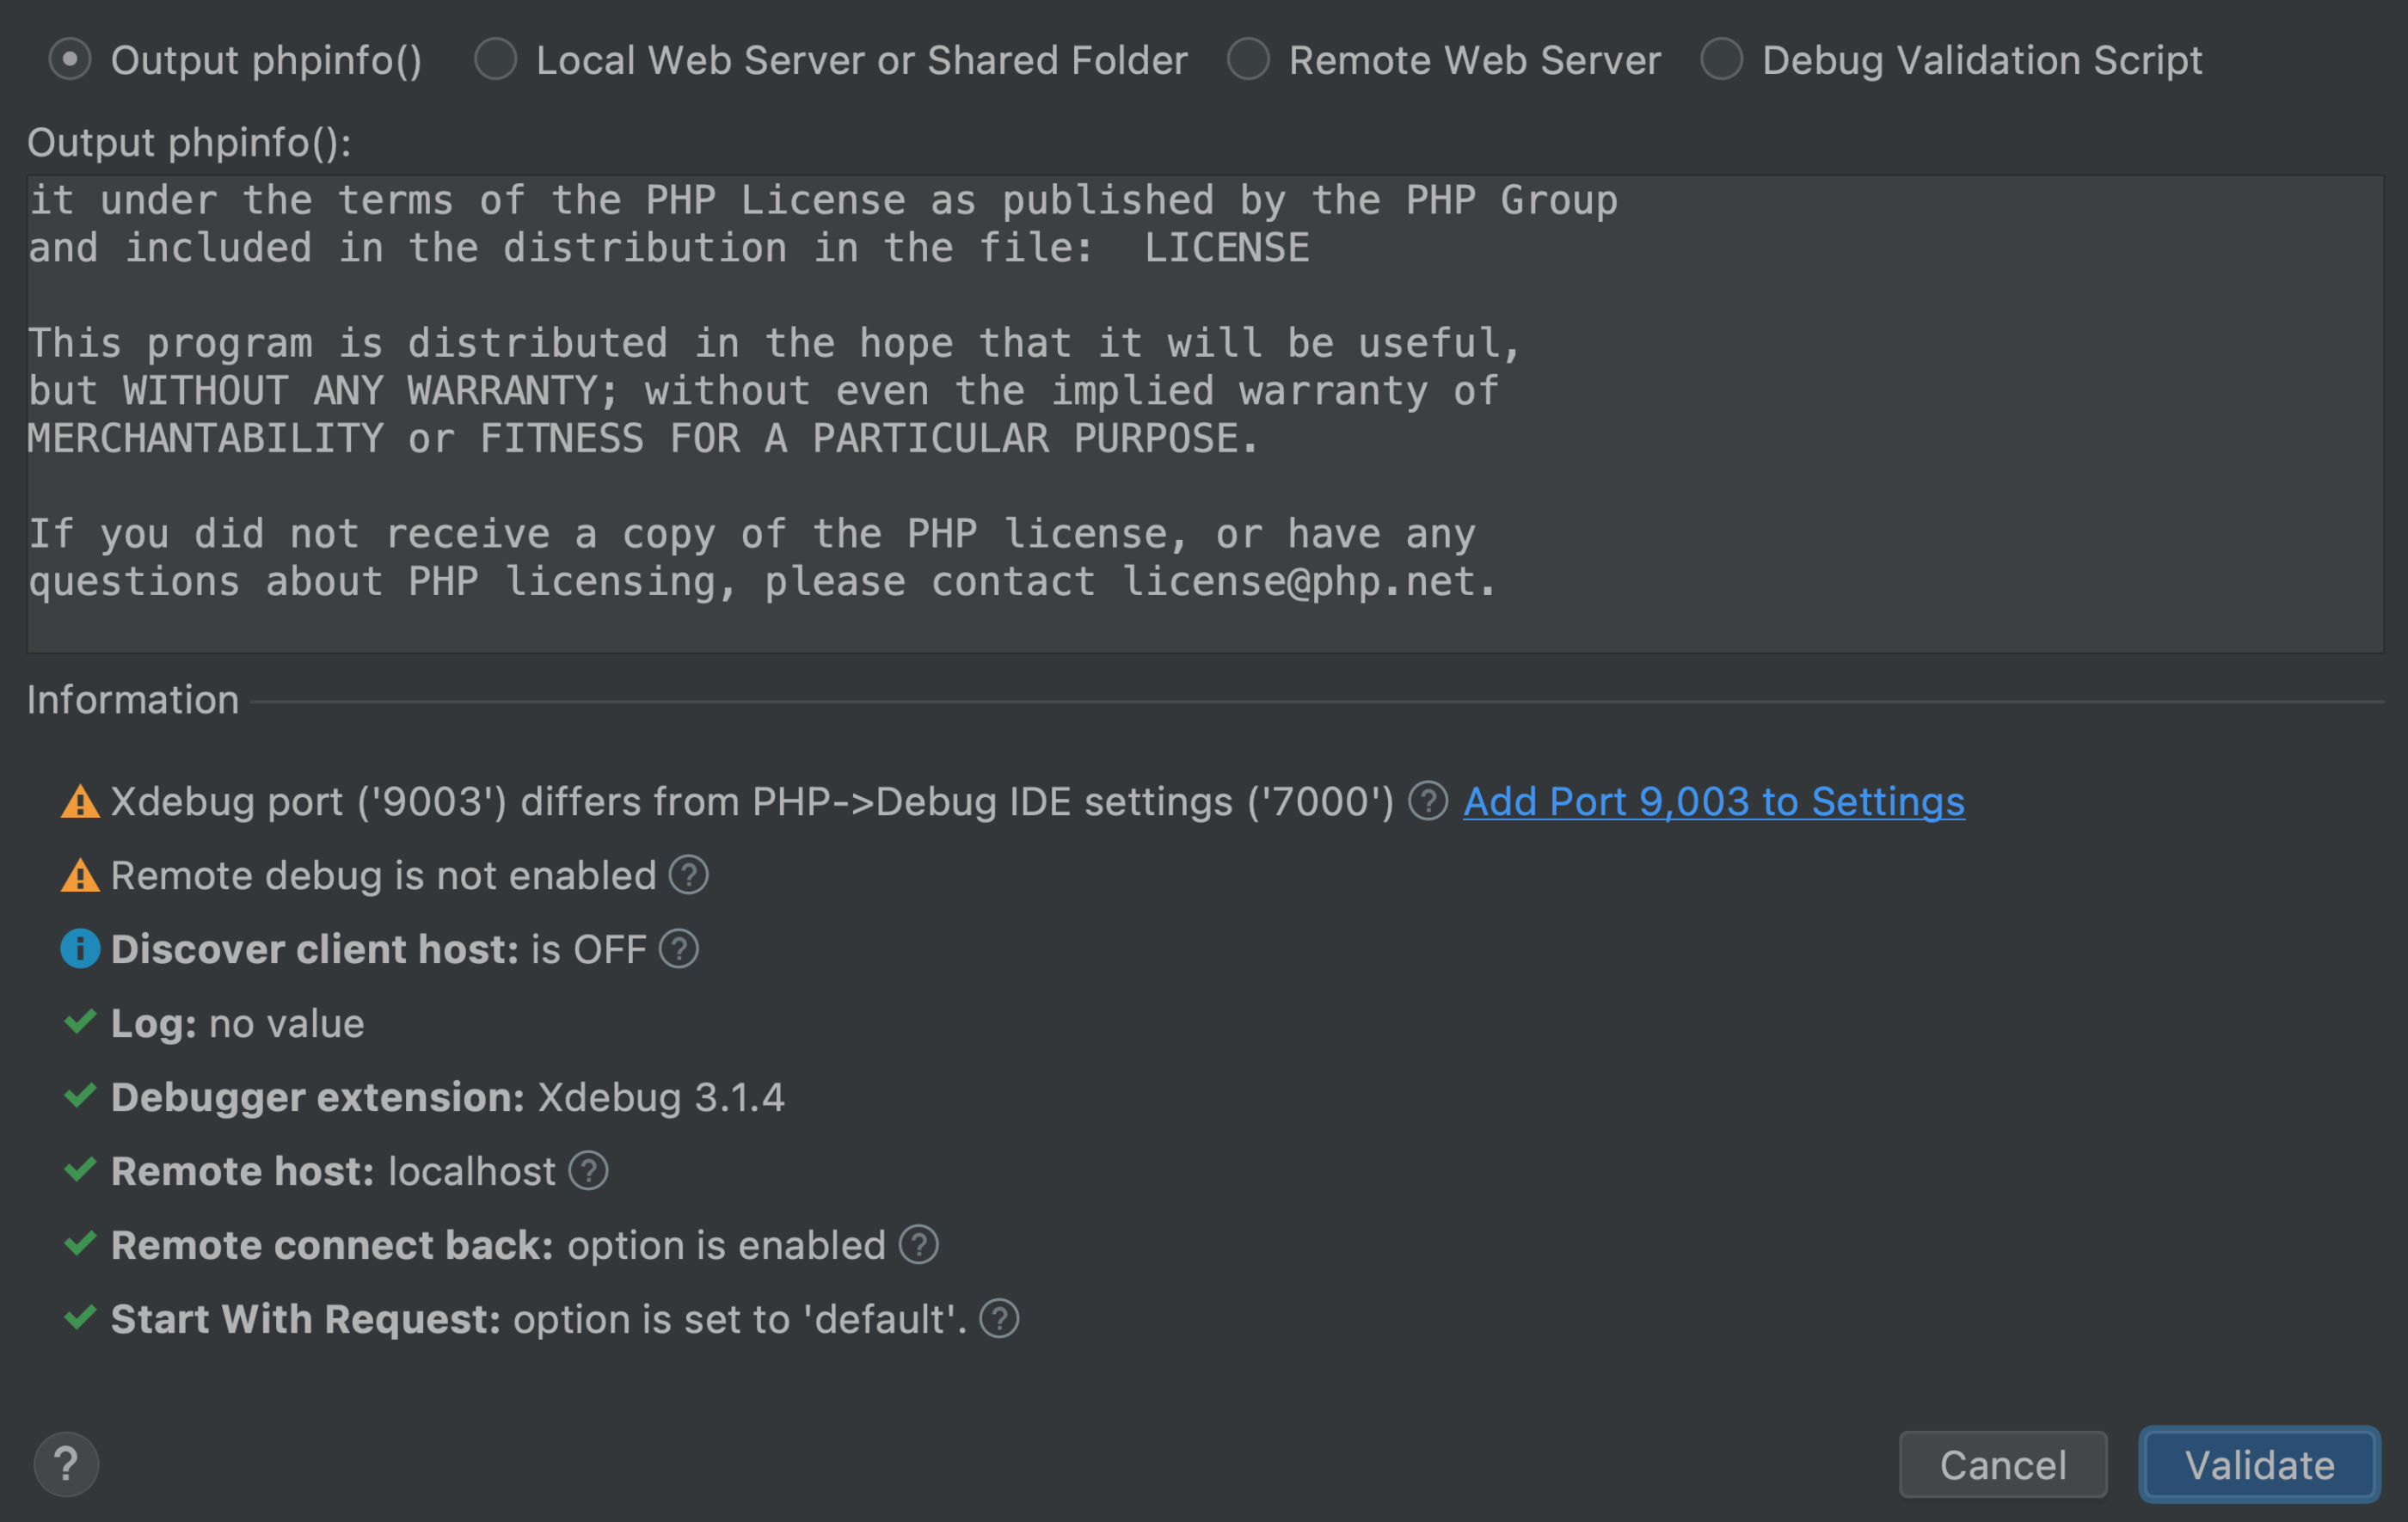
You will also notice that PhpStorm offers some additional useful information for troubleshooting the configuration, including details about the OS and if the configuration is a Docker environment.
Check the server configuration with a script
If the `phpinfo()` information didn’t help, you can use PhpStorm’s validation script on the server.
If you’re having trouble getting the debugger set up in PhpStorm, please tweet us @phpstorm or submit a ticket from the IDE by selecting Help | Submit a Bug Report.
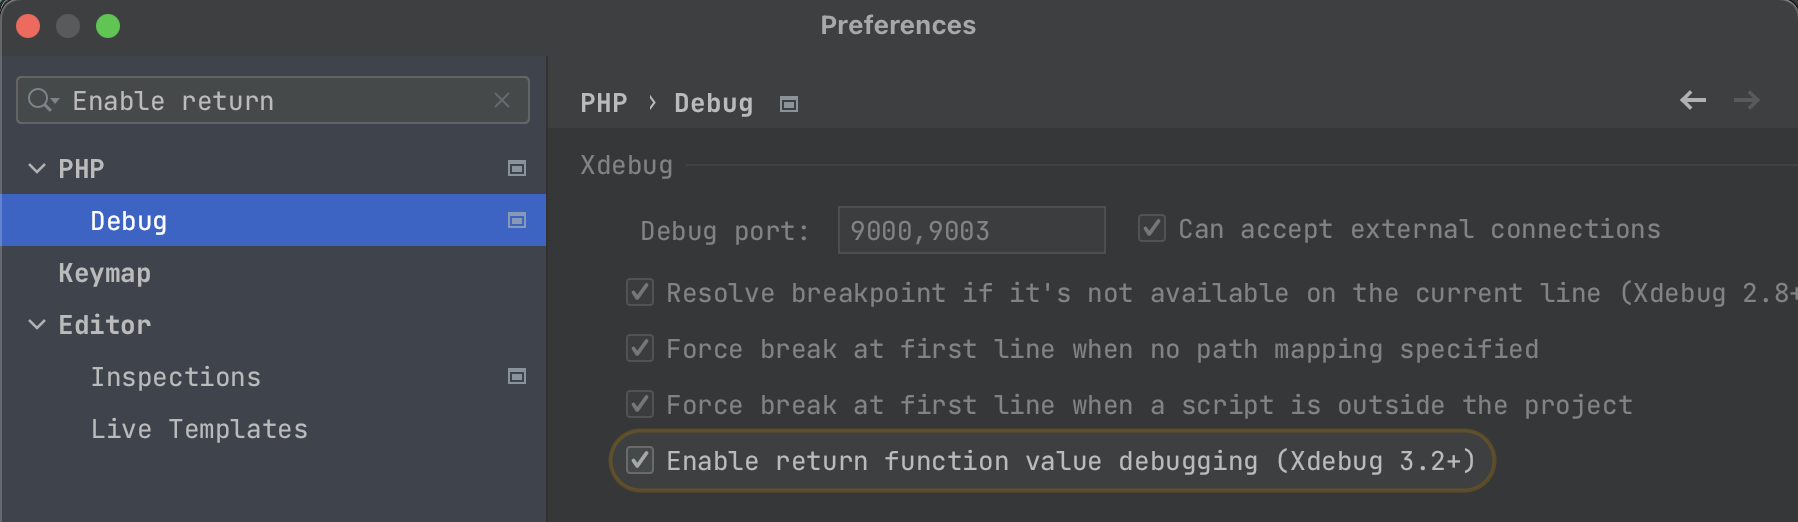
Return value debugging with Xdebug
Xdebug 3.2, which is expected at the end of November, will have an extra “return from function” debugging step that allows you to inspect the return value.
PhpStorm 2022.3 already supports this upcoming feature. To trigger it, press Step Into when you’re on the last statement in the function. As a result, an additional variable will be shown in Watches.
You can disable this feature by unchecking the corresponding setting under Settings / Preferences | PHP | Debug:
Interactive debug console for PHPUnit tests
When you stop at a certain breakpoint in a PHPUnit test, a console will now provide the possibility to analyze variables and the state of the test.
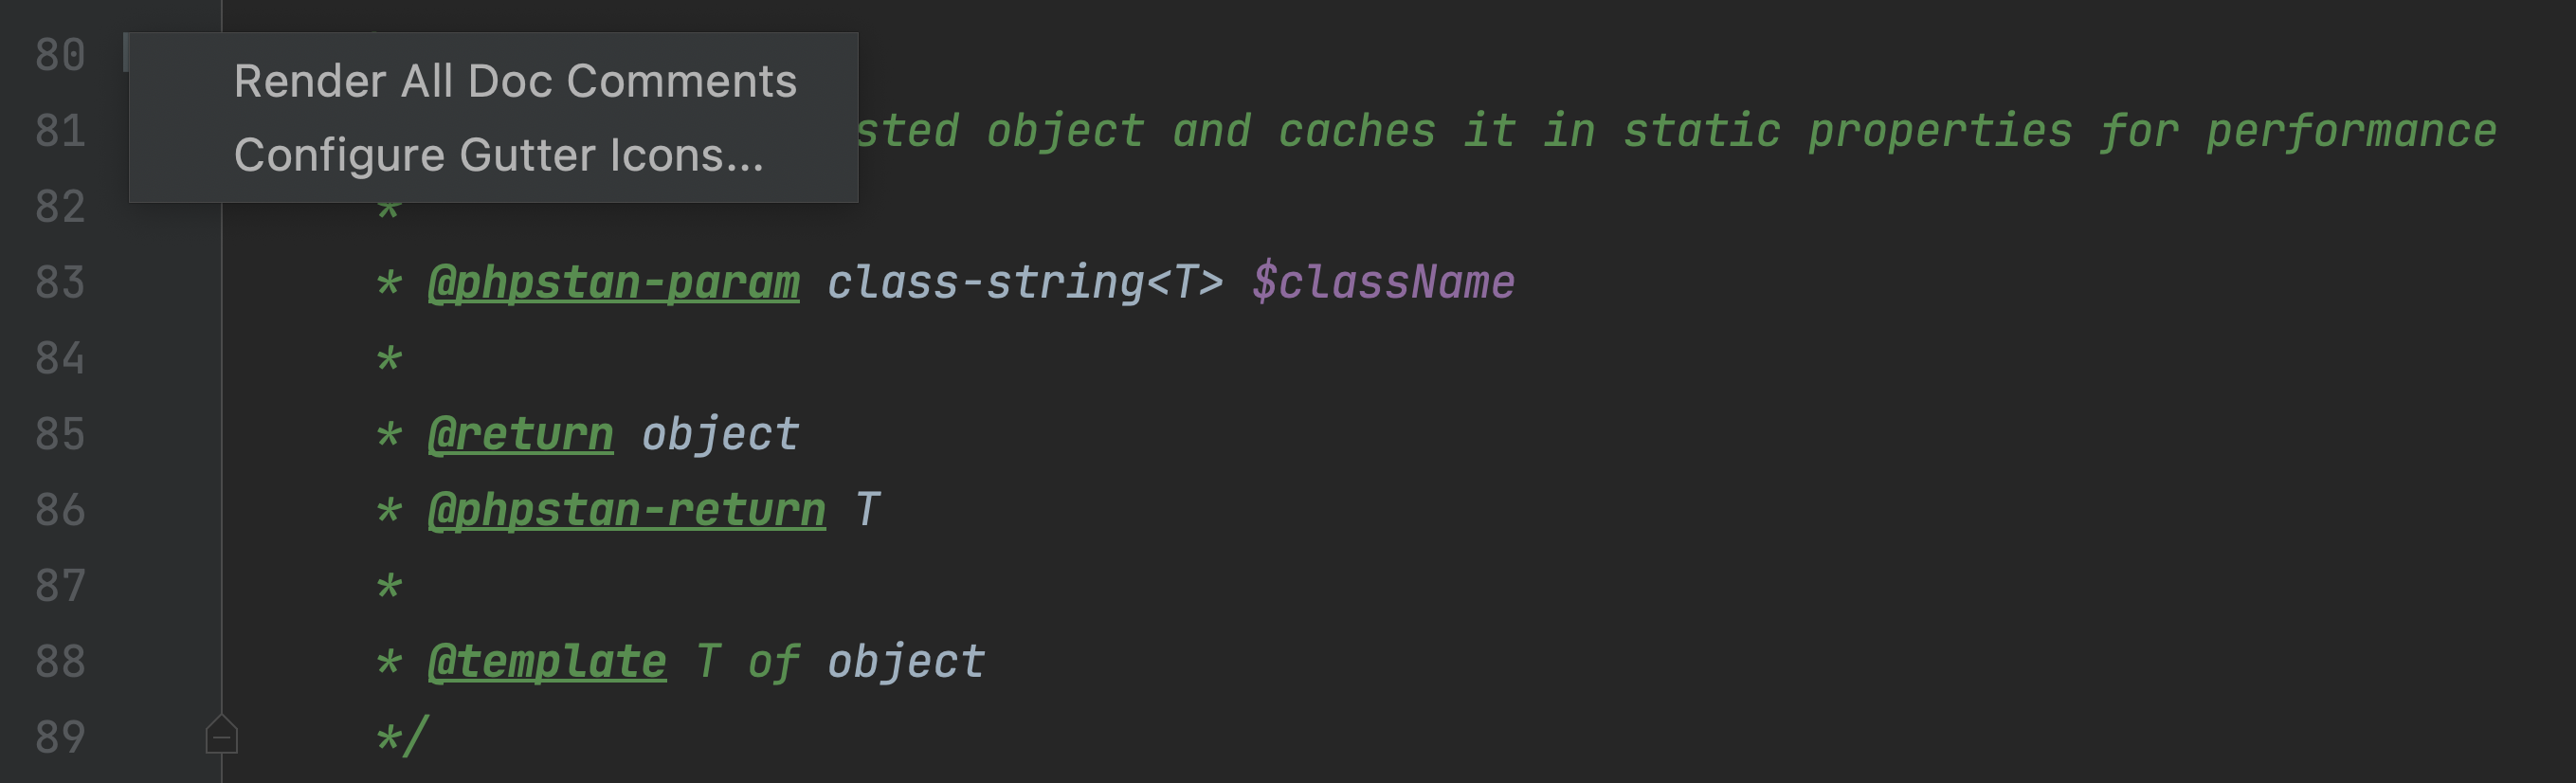
Render PHPDoc comments in the editor
When coding, it is crucial that you are able to read your code easily. You can now change how PHPDoc blocks look in PhpStorm 2022.3, with an option that provides better looking rendering and support for HTML formatting.
To toggle the new rendered view, click on a gutter icon ![]() near any PHPDoc block:
near any PHPDoc block:
To turn rendering for all PHPDoc comments, right-click on the gutter icon and choose Render All Doc Comments:
Please see the release notes for the complete list of changes in the EAP #5 build.
- Important! PhpStorm EAP builds are not fully tested and may be unstable.
- You can install an EAP build side by side with a stable PhpStorm version to try out the latest features.
- EAP builds are free to use and don’t require a license. However, they expire 30 days after the build date and then you’ll have to download a new build.
Please let us know about any problems you find by reporting them to our issue tracker or commenting on this post.